Yahoo! Inc 10-K 2013-12-31
Sign in or join
Add a note by highlighting text or Replying to an existing note.
Add a note by highlighting text or Replying to an existing note.
UNITED STATES
SECURITIES AND EXCHANGE COMMISSION
Washington, D.C. 20549
Form 10-K
| þ | ANNUAL REPORT PURSUANT TO SECTION 13 OR 15(d) OF THE SECURITIES EXCHANGE ACT OF 1934 |
For the fiscal year ended December 31, 2013
OR
| ¨ | TRANSITION REPORT PURSUANT TO SECTION 13 OR 15(d) OF THE SECURITIES EXCHANGE ACT OF 1934 |
For the transition period from to
Commission File Number 000-28018
Yahoo! Inc.
(Exact name of Registrant as specified in its charter)
| Delaware | 77-0398689 | |
| (State or other jurisdiction of incorporation or organization) | (I.R.S. Employer Identification No.) |
701 First Avenue
Sunnyvale, California 94089
(Address of principal executive offices, including zip code)
Registrants telephone number, including area code: (408) 349-3300
Securities registered pursuant to Section 12(b) of the Act:
| Title of Each Class |
Name of Each Exchange on Which Registered |
|
| Common stock, $.001 par value | The NASDAQ Stock Market LLC (NASDAQ Global Select Market) |
Securities registered pursuant to Section 12(g) of the Act: None
(Title of Class)
Indicate by check mark if the Registrant is a well-known seasoned issuer, as defined in Rule 405 of the Securities Act. Yes þ No ¨
Indicate by check mark if the Registrant is not required to file reports pursuant to Section 13 or Section 15(d) of the Act. Yes ¨ No þ
Indicate by check mark whether the Registrant (1) has filed all reports required to be filed by Section 13 or 15(d) of the Securities Exchange Act of 1934 during the preceding 12 months (or for such shorter period that the Registrant was required to file such reports), and (2) has been subject to such filing requirements for the past 90 days. Yes þ No ¨
Indicate by check mark whether the Registrant has submitted electronically and posted on its corporate Web site, if any, every Interactive Data File required to be submitted and posted pursuant to Rule 405 of Regulation S-T (§232.405 of this chapter) during the preceding 12 months (or for such shorter period that the registrant was required to submit and post such files). Yes þ No ¨
Indicate by check mark if disclosure of delinquent filers pursuant to Item 405 of Regulation S-K (§229.405 of this chapter) is not contained herein, and will not be contained, to the best of Registrants knowledge, in definitive proxy or information statements incorporated by reference in Part III of this Form 10-K or any amendment to this Form 10-K. ¨
Indicate by check mark whether the Registrant is a large accelerated filer, an accelerated filer, a non-accelerated filer, or a smaller reporting company. See definitions of large accelerated filer, accelerated filer, and smaller reporting company in Rule 12b-2 of the Exchange Act.
| Large accelerated filer þ |
Accelerated filer ¨ | |
|
Non-accelerated filer ¨ (Do not check if a smaller reporting company) |
Smaller reporting company ¨ |
Indicate by check mark whether the Registrant is a shell company (as defined by Rule 12b-2 of the Exchange Act). Yes ¨ No þ
As of June 28, 2013, the last business day of the Registrants most recently completed second fiscal quarter, the aggregate market value of voting stock held by non-affiliates of the Registrant, based upon the closing sales price for the Registrants common stock, as reported on the NASDAQ Global Select Market was $21,982,938,411. Shares of common stock held by each officer and director and by each person who owns 10 percent or more of the outstanding common stock have been excluded in that such persons may be deemed to be affiliates. This determination of affiliate status is not necessarily a conclusive determination for any other purpose.
The number of shares of the Registrants common stock outstanding as of February 14, 2014 was 1,009,392,339.
DOCUMENTS INCORPORATED BY REFERENCE
The following documents (or parts thereof) are incorporated by reference into the following parts of this Form 10-K:
Proxy Statement for the 2014 Annual Meeting of ShareholdersPart III Items 10, 11, 12, 13, and 14.
YAHOO! INC.
Form 10-K
Fiscal Year Ended December 31, 2013
The trademarks and/or registered trademarks of Yahoo! Inc. and its subsidiaries referred to herein include, but are not limited to, Yahoo!, Y!, Flickr, Tumblr, Xobni, Aviate, Yahoo Finance, Summly, Right Media, Yahoo Celebrity, Shine, Mojito, Stamped, Rivals, Yahoo BOSS, interclick and their respective logos. Other names are trademarks and/or registered trademarks of their respective owners.
2
Part I
| Item 1. | Business |
OVERVIEW
Yahoo! Inc., together with its consolidated subsidiaries (Yahoo, the Company, we, or us) is a global technology company focused on making the worlds daily habits inspiring and entertaining. Our mission is driven by our commitment to creating highly personalized experiences that reach our users wherever they might beon their mobile phone, tablet or desktop. Our more than 800 million monthly users connect to the things that matter most to them with beautiful, engaging experiences across Search, Communications, Digital Magazines and Videosome of which will be powered by Flickr and Tumblr.
We create value for advertisers with a streamlined, simplified advertising technology stack that leverages Yahoos data, reach and analytics to connect advertisers with their target audiences. For advertisers, the opportunity to be a part of users daily habits across products and platforms is a powerful tool to engage audiences and build brand loyalty.
Advertisers can build their businesses through advertising to targeted audiences on our online properties and services (Yahoo Properties) and a distribution network of third party entities (Affiliates) who integrate our advertising offerings into their Websites or other offerings (Affiliate sites; together with Yahoo Properties, the Yahoo Network). Our revenue is generated principally from display and search advertising.
We are proud of our storied history that has evolved with the Internet, beginning in 1994 when our founders, Jerry Yang and David Filo, then graduate students at Stanford University, created Jerry and Daves Guide to the World Wide Web, a simple directory of websites to help people navigate the Internet. Yahoo was incorporated in 1995 and is a Delaware corporation. We completed our initial public offering on April 12, 1996, and our stock is listed on the NASDAQ Global Select Market under the symbol YHOO. Yahoo is a global company headquartered in Sunnyvale, Californiawith offices in more than 30 countries, regions and territories.
EXECUTIVE LEADERSHIP
The management team reporting to Marissa Mayer, our Chief Executive Officer and President, is:
| | David FiloCo-Founder & Chief Yahoo; |
| | Ken GoldmanChief Financial Officer; |
| | Ron BellGeneral Counsel & Secretary; |
| | Jacqueline ResesChief Development Officer; |
| | Kathy SavittChief Marketing Officer; |
| | Adam CahanSenior Vice President, Mobile & Emerging Products; |
| | Mike KernsSenior Vice President, Homepage & Verticals; |
| | Laurence MannSenior Vice President, Search Products; |
| | Jeffrey BonforteSenior Vice President, Communication Products; |
| | Scott BurkeSenior Vice President, Advertising and Data; |
| | Jay RossiterSenior Vice President, Platforms and Personalization Products; |
| | Ned BrodySenior Vice President, Americas; |
| | Dawn AireySenior Vice President, Europe, Middle East, and Africa; and |
| | Rose TsouSenior Vice President, Asia Pacific. |
3
Our Board of Directors is composed of:
| | Marissa Mayer, our CEO; Maynard Webb, our Chairman of the Board; John Hayes; Susan James; Max Levchin; Peter Liguori; and Thomas McInerney. |
2013 BUSINESS HIGHLIGHTS: People, Products, Traffic & Revenue
During 2013, we focused our attention on triggering a chain reaction of growth, which starts with hiring the best people who will build beautiful, engaging products. Those products drive increased traffic. The increased traffic generates greater advertiser interest, which ultimately results in revenue growth. Our focus on people, products, traffic and revenue in 2013 had measurable impacts on our business and opportunities for future growth as we outline below.
We are committed to building our products focusing on mobile first. Today we have over 400 million monthly mobile users, an increase of more than 150 million users since we launched our new Mobile and Emerging Products team in October 2012. Today, mobile traffic represents more than half of our 800 million monthly users (and these numbers do not include Internet Message Access Protocol (IMAP) or Tumblr users). Our growth in mobile traffic has been the result of an engaging and inspiring suite of new and revamped product experiences designed to make users daily habits mobile.
PEOPLE: During 2013, we have continued to invest in people, building out our management team and hiring exceptional talent from around the world. We made hiring a priority and focused on recruiting the best talent company-wide by implementing a more rigorous hiring process.
| | We focused on filling several key leadership positions and addressing critical product needs. We hired Ned Brody as Senior Vice President, Americas, Dawn Airey as Senior Vice President, Europe, Middle East, and Africa, and Sandy Gould as the Senior Vice President of Talent Acquisition and Development. We also brought on several leaders to strengthen our Digital Magazines. We hired New York Times journalist and editor Megan Liberman as Editor-in-Chief for Yahoo News and Katie Couric as the Global Anchor in January 2014. |
| | We made hiring a priority and focused on attracting the best talent to Yahoo. Over the year, we received more than 340,000 applications to work at Yahoo, nearly double the number we received in 2012. We also accelerated our efforts towards hiring technical talent to bring excellence to our core products. Nearly half of our hires were technical talent. |
| | In 2013, we continued to work on several key initiatives that were launched in 2012 in an effort to enhance our culture and make Yahoo the best place to work by enhancing transparency, promoting accountability and improving employee efficiency. Some of these efforts include quarterly performance reviews for all employees; aggressive quarterly and annual goals for the company, for teams, and for individuals; and weekly all-hands meetings to communicate transparently and accountably on the most important events facing the Company. |
PRODUCTS: In 2013, we accelerated the pace of innovation, launching nearly a dozen new product experiences to strengthen and expand our core products. These investments furthered our mission to make users daily habits more inspiring and entertaining through beautiful, intuitive, and innovative products.
| | SEARCH: For Yahoo, Search remains one of our biggest areas of focus, and in 2013 we enhanced Search to create a better, more user-centered experience. |
| ¡ | We introduced several new ad formats on Search in Q3 2013, helping to further optimize and monetize Search queries. |
| ¡ | We acquired Aviate in Q4 2013 whose technology and talent will be critical to the future of Searchespecially contextual mobile search. Factoring context into our Search offering opens up tremendous opportunities to better answer users Search queries and make their daily habits easier. |
4
| | COMMUNICATIONS: In addition to Search, people come to Yahoo every day to communicate with their friends and family. We know how important email is to our users and so we continue to innovate our approach to everyday communications. |
| ¡ | We refreshed Yahoo Mail, and followed up with multiple iterations to continue improving the experience for our users. |
| ¡ | Additionally, we introduced threaded conversations, easier ways to reply to emails, and beautiful, photographic themesall resulting in improved ease of use and a much more modern email experience. |
| ¡ | In Q3 2013, we acquired Xobni as part of our continued efforts to deliver the best mail experience across all screens. With a strong reputation for building smart products that organize your inbox, this technology is helping us deliver a more personalized, more thoughtful and more precise mail experience making communicating easier for our users. |
| | DIGITAL MAGAZINES: In addition to Search and Communications, content has always been a key part of Yahoos business, and was a focus of our investments in 2013. Digital Magazines, which align with our verticals, bring users personalized, engaging content curated from across the web. |
| ¡ | We launched a new Yahoo Finance, our industry-leading business and financial news product, across desktop, mobile web and mobile app. |
| ¡ | Yahoo Sports was also upgraded, putting stats, highlights and footage of your favorite teams at your fingertips. |
| ¡ | In Q1 2013, we announced the acquisition of Summly, a company that helps simplify the way we provide informationmaking it faster, more precise and easier to read. The technology was wrapped into our Yahoo App in less than a month, bringing users a new, improved way to consume content. |
| | VIDEO: Video has also become an increasingly important aspect of our content offerings. We continued to focus on enhancing the user experience and developing partnerships to bring users the best video content from across the web. |
| ¡ | In September, we launched Yahoo Screen, our video experience across mobile and desktop. Screen seeks to bring users the absolute best contentincluding comedy, news, and live sports and concertsfrom across the web. |
| ¡ | We continue to offer premium content through our partnerships with ABC News and NBC Sports. |
| ¡ | Comedy has found a home at Yahoo with the introduction of the Saturday Night Live (SNL) clip archive and clips from Viacoms Comedy Central and MTV shows, including The Daily Show with Jon Stewart, The Colbert Report, and more. We also introduced eight original web series this past fall. |
| | FLICKR: With more than 10 billion photos, Flickr continues to be one of the worlds most comprehensive photo platforms and a continued focus of innovation for Yahoo. |
| ¡ | In Q2 2013, we successfully launched a reimagined and industry-leading Flickr photo solution for mobile. |
| ¡ | To improve the products functionality we added camera filtering and editing features to iOS devices in Q3 2013 and debuted in Apples share sheet in iOS7, making uploading much easier. |
| ¡ | Flickr photo books, a web embed player, new auto-tagging and social features were all added in Q4 2013, rounding out a year of investing in Flickr. |
| | TUMBLR: Tumblrs popularity and engagement among creators, curators and audiences of all ages brings a significant community of users to our network. |
TRAFFIC: In 2013, we saw several positive traffic trends. By the end of the year, Yahoo had more than 800 million monthly users, with more than 400 million of them joining us on mobile. These numbers do not include IMAP or Tumblr users.
5
REVENUE: While we are focused on creating the absolute best experiences for our users, we are also committed to delivering value to our advertisers and publishers. In 2013, we invested in our ad technology to continue strengthening this commitment.
| | We announced a global, non-exclusive agreement with Google to display ads on various Yahoo Properties and certain co-branded sites using Googles AdSense for Content and AdMob services. By adding Google to our list of world-class contextual ad partners, we can serve ads that are even more meaningful and personalized to our users. |
| | We introduced two new advertising formats designed to enhance the content experience in a more intuitive and immersive way. |
| ¡ | Yahoo Stream Ads offer unobtrusive native ads that are part of a users Yahoo news stream. |
| ¡ | Billboard Ads on Yahoo.com were designed to deliver richer content interactions to users and increased effectiveness to advertisers. |
| | We continue to generate business opportunities through streamlined advertising seamlessly integrated with the content experience. In Q3 2013, Yahoo expanded Yahoo Stream Ads across Mail and mobile content properties. |
OUR BUSINESS
USER OFFERINGS
We are focused on building beautiful products that make the worlds daily habits inspiring and entertaining. With hundreds of Search partners, a world-class mail platform, three industry-leading verticals (News, Sports and Finance), a growing video content offering, the photo resources of Flickr and the social reach of Tumblr, we play an important role in the digital lives of our more than 800 million monthly users on Yahoo Properties.
Our user offerings include:
SEARCH
Yahoo Search serves as a starting point to navigate the Internet and discover information that matters to users, offering rich search results ranked and organized based on their relevance to the query. Our Search continues to evolve to help users find the right information at the right time through web Search.
Under our Search and Advertising Services and Sales Agreement (Search Agreement) with Microsoft Corporation (Microsoft), Microsoft is the exclusive algorithmic and paid search advertising services provider on Yahoo Properties and non-exclusive provider of such services on Affiliates sites. Yahoo continues to develop and launch features around the results to enhance the search experience for our users. These features include rich results, contextual search results, site filters, related topic suggestions and more.
Yahoo Answers enables users to seek, discover and share knowledge and opinions across mobile phones, tablets and desktop.
COMMUNICATIONS
Yahoo Mail connects users to the people and things that are most important to them across mobile phones, tablets and desktop. In addition to mail, we offer users integrated contacts, calendar and messaging products, all outfitted with one terabyte of storage and beautiful photo themes.
6
Yahoo Messenger is an instant messaging service that provides an interactive and personalized way for users to connect, communicate and share experiences on a real-time basis. Similar to mail, we connect users across mobile phones, tablets and desktop.
Yahoo Groups allows users to join groups based on shared interests and involvements, providing access to messages, event calendars, polls and other shared information.
DIGITAL MAGAZINES
Yahoo.com brings together the most relevant contentincluding Yahoo original content and partner contentcurated from across the Web. Our homepage is optimized across mobile phones, tablets and desktop.
In addition, users can see a preview of their mailbox, local weather, stock quotes, sports scores, comics, and more. On our content properties, we generate revenue from display and search advertising, as well as from fee-based services. Many of our properties are also available in mobile-optimized versions for display on mobile phones and tablet devices, or available as native applications across different operating platforms for iOS, Android and Windows phones.
My Yahoo is a customizable homepage that gives registered users the ability to create, configure and easily modify their custom page with news and information from around the Web. It is a starting point for mobile users to bring relevant and personalized content from across the Web and other Yahoo Properties to users devices.
Yahoo Weather provides users with real-time weather conditions and information for their favorite cities and locations and is available on desktop, tablets and mobile phones.
Yahoo News provides original, premium, partner, and syndicated news via text, photos, and video to engage users with wide-ranging, up-to-the-minute coverage and analysis into topical news events. In addition, we have a number of key content partnerships in place, including a strategic partnership with ABC News and the Good Morning America brand.
Yahoo Sports serves one of the largest audiences of digital sports enthusiasts in the world. Yahoo Sports is anchored by Fantasy Sports, editorial reporting, real-time scores, statistics and breaking news, coverage of the biggest global sports events, and premium college sports coverage through our Rivals publisher network. With award-winning writers, a leading fantasy platform and live game tracking, Yahoo Sports delivers experiences for every fan, every day. During 2013, we also released several new products and innovations, including:
| | A redesign of Yahoo Sports to include greater content personalization, and a more visual interface to provide up-to-the-minute news, scores, statistics, and Fantasy updates for fans. |
| | A rebuilt Yahoo Sports mobile application and mobile website, which brings fans scores, statistics and play-by-play for their favorite teams. |
| | New mobile app experiences for Fantasy Football, Baseball, Basketball and Hockey featuring live drafting features for the first time on Yahoo Sports mobile. |
Yahoo Finance provides a comprehensive set of financial data, information, and tools that help users make informed financial decisions. Yahoo Finance features a robust content offering that is a mix of original editorial and syndicated news via relationships with several third-party providers and is available on mobile phones, tablets and desktop.
Yahoo Entertainment and Lifestyles is a collection of properties focused on emerging trends and information in popular culture, womens issues, and media. Yahoo Celebrity, Movies, TV and Music are leading destinations for celebrity gossip, movie, music, and TV premieres, and awards coverage. Yahoo Shine is targeted to women and provides tips, features and in-depth analysis in areas such as well-being, food, fashion, relationships and parenting.
7
VIDEO
We provide original, premium and third-party news, finance, sports, entertainment, and lifestyle video content distributed in contextually relevant experiences across Yahoo Properties.
Yahoo Screen is a video destination site where videos from across Yahoo Properties are aggregated and watched. In 2013, we launched a brand new experience on Yahoo Screen for desktop computers and mobile web that lets users easily flip through channels of their favorite contentjust like TV. We also launched applications on new platforms including iPhone, iPad, and Apple TV, and added new partners including SNL and Viacom.
Yahoo Smart TV is a software platform that enhances television through engaging interactive experiences. Yahoo Smart TV is accessible on certain televisions of major manufacturers including Samsung and VIZIO. We generate revenue from this offering through advertising and an application store.
FLICKR
Flickr is a web and mobile photo management and sharing service that makes it easy for users to upload, store, organize, and share their photos. Flickr offers all members one terabyte of free storage. Members also have the ability to purchase printed books of their photos.
TUMBLR
Tumblr offers a web service and mobile applications (particularly on the iOS and Android platforms) that allow users to create and share content of all kindsincluding images, video, audio, and text, and to follow their interests and passions in the Tumblr Dashboard stream. Tumblrs primary form of monetization is native brand advertising within the Tumblr Dashboard. In addition, Tumblr generates revenue by enabling a marketplace for the sale of third-party developed blog themes and licensing its real-time feed of user-generated posts. At the end of 2013, Tumblr was home to nearly 150 million blogs and over 65 billion posts, reaching an audience of hundreds of millions of people worldwide each month.
ADVERTISER OFFERINGS
As one of the Webs largest publishers and the owner of leading properties across multiple content categories, Yahoo provides a canvas of personalized content and experiences where advertisers can connect with users in a meaningful way. Advertisers seek partners that can address their business objectives, from high-impact branding campaigns that generate awareness among consumers to tactical campaigns that drive specific audiences to action. We have aligned our resources and developed a new, unified approach to digital advertising across search, native, audience, premium display, and video advertising. These products are supported by Yahoos platform, data and analytical tools, with insights into the daily digital habits of more than 800 million people worldwide.
Search Advertising: The Yahoo Bing Network connects advertisers with an audience of hundreds of millions of users, with the support of strategic account teams, reporting, analytics, and extensive campaign controls. Yahoo continues to focus on developing new search ad formats to engage users across devices, including personalized search retargeting, click-to-call functionality in search ads, sitelink extensions, location extensions, product ads and more.
Native Advertising provides brand new ways for advertisers to engage their audience across devices on Yahoos network of leading consumer products. Yahoos native advertising offerings include Yahoo Stream Ads (served within content streams across our media properties and in Mail); Yahoo Image Ads (HD-quality image-rich ads served within native image environments and slideshows); and Tumblr Sponsored Postsall powered by the Yahoo Advertising platform. Because native ads are a seamless part of a users experience, they can help deliver higher impact for advertisers.
8
Yahoo Audience Ads allow advertisers to buy display, video and mobile ads targeted to specific audiences. Yahoo Audience Ads deliver the right messages to the right users across Yahoo and other high-quality sites with the scale and targeting precision of real-time programmatic buying. Yahoo Audience Ads offer optimized, data-driven ad buying with enhanced analytics. Advertisers have access to a comprehensive set of audience data, combining Yahoo data with advertiser data and third-party data, all usable on an extended pool of high-quality inventory.
Yahoo Premium Ads offer the largest digital advertising canvas for brand and performance advertisers on the web. We offer high-impact advertising opportunities on the Yahoo Homepage; Yahoos leading vertical content properties; Yahoo Mail; program sponsorships of major events; and premium video placementsall with custom integrations, personalization and targeting that unite advertisers brands with consumers digital daily habits.
Yahoo Video is a premium video advertising platform anchored by Yahoos award-winning original programming and world-class partner content. Yahoo Video connects brands to their target audience at scale through a complete set of advertising opportunities including video channels, video programs, audience targeting, branded entertainment, live events, and ad placements that occur before, during and after a video rolls.
A SIMPLIFIED AD PLATFORM
Yahoo Ad Manager is a simplified ad platform that gives advertisers direct, hands-on access to Yahoos advertising products. Yahoo Stream Ads, Yahoo Image Ads and Tumblr Sponsored Posts powered by Yahoo Advertising are available through Yahoo Ad Manager, with a simple user interface that helps advertisers get ads online in a matter of minutes, with insights and analytics built in.
Yahoo Ad Manager Plus is an extension of Yahoo Ad Manager for larger advertisers to plan, execute and optimize complex display ad campaigns directly, giving them greater control over the performance of their ads on Yahoo and third-party programmatic inventory. Yahoo offers managed services through Yahoo Ad Manager Plus for advertisers who want custom audience definition, richer campaign measurement and insights, access to exclusive inventory, varied pricing options, and full-service campaign optimization.
Yahoo Ad Exchange enables advertisers to easily target global audiences across Yahoo Properties, Affiliate sites and other publisher sites on mobile and the Web. Enhanced campaign measurement tools and insights are provided to optimize audience targeting and ad formats and placements as a means of increasing return on advertiser ad spend.
PUBLISHER OFFERINGS
We work with high-quality publishers to attract new audiences and create engaging experiences across the Web. We monetize these experiences with a set of application programming interfaces (APIs) and tools to grow partner businesses. With these offerings, publishers are able to participate in the Yahoo Search and Bing Unified Search Marketplaces as well as the Yahoo Ad Exchange for display advertising.
PRODUCT DEVELOPMENT
Yahoo continually launches, improves, and scales products and features to meet evolving user, advertiser, and publisher needs. Most of our software products and features are developed internally by our employees. In some instances, however, we might purchase technology and license intellectual property rights if the opportunity is strategically aligned, operationally compatible, and economically advantageous. While it may be necessary in the future to seek or renew licenses relating to various aspects of our products, we believe based on past experience and industry practice that such licenses generally could be obtained on commercially-reasonable terms. We believe our continuing innovation and product development are not materially dependent upon any single license or other agreement with a third party relating to the development of our products.
9
Yahoos product teams include a broad array of engineering and product talent and support a large portion of the Yahoo product portfolio and technology infrastructure. Our product teams have expertise in consumer applications (Web/Mobile), scalable software platforms, information retrieval, machine learning and science, editorial, networking/communications technologies, and presentation layer frameworks.
Our engineering and production teams are primarily located in our Sunnyvale, California, headquarters, Bangalore, India, and Beijing, China. Product development expenses for 2011, 2012, and 2013 totaled approximately $919 million, $886 million, and $1 billion, respectively, which included stock-based compensation expense of $81 million, $74 million, and $83 million, respectively.
M&A ACTIVITY
As part of our overall strategy, we focused on acquisitions in 2013 that help us achieve three different goals. The first is to grow our technical talent base. Our acquisition of Stamped is a good example of this, where the team came to Yahoo and focused on building the Yahoo Screen mobile experience which launched in Q3 2013. Second, is to enhance our technology and core products offerings. Our 2013 acquisition of Summly is an example where we acquired the summarization technology that was initially incorporated in our Yahoo App last Spring and continued with the launch of Yahoo News Digest in Q1 2014. Third, is to expand audience and engagement. Our acquisition of Tumblr in Q2 2013 is an example where we gained access to an engaged community of younger users that complemented our core audience.
We expect to make additional acquisitions and strategic investments in the future.
GLOBAL OPERATIONS
We manage our business geographically. The primary areas of measurement and decision-making are Americas, EMEA (Europe, Middle East, and Africa), and Asia Pacific. Additional information required by this item is incorporated herein by reference to Note 18Segments of the Notes to our consolidated financial statements, which appears in Part II, Item 8 of this Annual Report on Form 10-K.
We own a majority or 100 percent of all of these international operations (except in Australia and New Zealand, China, and Japan where we have joint ventures and/or noncontrolling interests). We support these businesses through a network of offices worldwide.
Revenue is primarily attributed to individual countries according to the international online property that generated the revenue.
Information regarding risks involving our international operations is included in Part I, Item 1A Risk Factors of this Annual Report on Form 10-K and is incorporated herein by reference.
SALES
We maintain three primary channels for selling our advertising services: field, mid-market, and reseller/small business. Our field advertising sales team sells display advertising in all markets and search advertising to premium advertisers under the Search Agreement with Microsoft. Our mid-market channel sells our services to medium-sized businesses, while our reseller/small business channel enables us to sell advertising services to additional regional and small business advertisers. In 2013, we reorganized our U.S. sales force from a regional structure to a vertical structure providing one, customer-centric solution to our customers. We believe that this will allow us to provide the best solutions across all of our products based on a deeper understanding of our customers businesses.
10
In the U.S., we employ sales professionals in multiple locations, including Atlanta, Boston, Burbank, Chicago, Dallas, Detroit, Hillsboro, Los Angeles, Miami, New York, Omaha, San Francisco, and Sunnyvale. In international markets, we either have our own internal sales professionals or rely on our established sales agency relationships in more than 50 countries, regions, and territories.
No individual customer represented more than 10 percent of our revenue in 2011, 2012, or 2013. Revenue under the Search Agreement represented approximately 20 percent, 25 percent, and 31 percent of our revenue for the years ended December 31, 2011, 2012 and, 2013, respectively.
Internet usage is subject to seasonal fluctuations, typically declining during customary summer vacation periods and increasing during the fourth quarter holiday period due to higher online retail activity. These seasonal patterns have affected, and we expect will continue to affect, our business and quarterly sequential revenue growth rates.
MARKETING
Yahoo is one of the most recognized brands in the world. Our products, services, and content enable us to attract, retain, and engage users, advertisers, and publishers. Our marketing teams engage in each step of the development, deployment, and management of products and services, and in content design. Our marketing team will help shape our offerings to better market them to our potential and existing users.
COMPETITION
We face significant competition from online media companies, social media and networking sites, traditional print and broadcast media, search engines, and various e-commerce sites. Our competitors include Google, Facebook, Microsoft, and AOL. Several of our competitors offer an integrated variety of Internet products, advertising services, technologies, online services and/or content in a manner similar to us that compete for the attention of our users, advertisers, and publishers. We also compete with these companies to obtain agreements with third parties to promote or distribute our services. In addition, we compete with social media and networking sites which are attracting an increasing share of users, users online time and online advertising dollars.
We compete with advertising networks, exchanges, demand side platforms and other platforms, such as Google AdSense, DoubleClick Ad Exchange, AOLs Ad.com and Microsoft Media Network, as well as traditional media companies for a share of advertisers marketing budgets and in the development of the tools and systems for managing and optimizing advertising campaigns.
In a number of international markets, especially those in Asia, Europe, the Middle East and Latin America, we face substantial competition from local Internet service providers and other portals that offer search, communications, and other commercial services and often have a competitive advantage due to dominant market share in their territories, greater local brand recognition, focus on a single market, familiarity with local tastes and preferences, or greater regulatory and operational flexibility.
Yahoos competitive advantage centers on the fact that we make peoples daily digital habits more entertainingthis includes daily activities like communicating, searching, reading and sharing information. We believe our principal competitive strengths include the usefulness, accessibility, integration, and personalization of the online services that we offer; the quality, personalization, and presentation of our search results; and the overall user experience on our leading premium content properties and other Yahoo Properties. Our principal competitive strengths relating to attracting advertisers and publishers are the reach, effectiveness, and efficiency of our marketing services as well as the creativity of the marketing solutions that we offer. Reach is the size of the audience and/or demographic that can be accessed through the Yahoo Network. Effectiveness for advertisers is the achievement of marketing objectives, which we support by developing campaigns, measuring the
11
performance of these campaigns against their objectives, and optimizing their objectives across the Yahoo Network. Effectiveness for publishers is the monetization of their online audiences. Efficiency is the simplicity and ease of use of the services we offer advertisers and publishers.
Additional information regarding competition is included in Part I, Item 1A Risk Factors of this Annual Report on Form 10-K and is incorporated herein by reference.
INTELLECTUAL PROPERTY
We create, own, and maintain a wide array of intellectual property assets that we believe are among our most valuable assets. Our intellectual property assets include patents and patent applications related to our innovations, products and services; trademarks related to our brands, products and services; copyrights in software and creative content; trade secrets; and other intellectual property rights and licenses of various kinds. We seek to protect our intellectual property assets through patents, copyrights, trade secrets, trademarks and laws of the U.S. and other countries, and through contractual provisions. We enter into confidentiality and invention assignment agreements with our employees and contractors, and utilize non-disclosure agreements with third parties with whom we conduct business in order to secure and protect our proprietary rights and to limit access to, and disclosure of, our proprietary information. We consider the Yahoo! trademark and our many related company brands to be among our most valuable assets, and we have registered these trademarks in the U.S. and other countries throughout the world and actively seek to protect them. We have licensed in the past, and expect that we may license in the future, certain of our technology and proprietary rights, such as trademark, patent, copyright, and trade secret rights, to third parties.
Additional information regarding certain risks related to our intellectual property is included in Part I, Item 1A Risk Factors of this Annual Report on Form 10-K and is incorporated herein by reference.
EMPLOYEES
As of December 31, 2013, we had approximately 12,200 full-time employees and fixed term contractors. Our future success is substantially dependent on the performance of our senior management and key technical personnel, as well as our continuing ability to attract, maintain the caliber of, and retain highly qualified technical, executive, and managerial personnel. Additional information regarding certain risks related to our employees is included in Part I, Item 1A Risk Factors of this Annual Report on Form 10-K and is incorporated herein by reference.
AVAILABLE INFORMATION
Our Website is located at http://www.yahoo.com. Our investor relations Website is located at http://investor.yahoo.net. We make available free of charge on our investor relations Website under Financial Info our Annual Reports on Form 10-K, Quarterly Reports on Form 10-Q, Current Reports on Form 8-K, and any amendments to those reports as soon as reasonably practicable after we electronically file or furnish such materials to the U.S. Securities and Exchange Commission (SEC). The SEC maintains a Website that contains reports, proxy and information statements, and other information regarding our filings at http://www.sec.gov.
12
| Item 1A. | Risk Factors |
We face significant competition for users, advertisers, publishers, developers, and distributors.
We face significant competition from online media companies, social media and networking sites, traditional print and broadcast media, search engines, and various e-commerce sites. In a number of international markets, especially those in Asia, Europe, the Middle East and Latin America, we face substantial competition from local Internet service providers and other portals that offer search, communications, and other commercial services.
Several of our competitors offer an integrated variety of Internet products, advertising services, technologies, online services and content in a manner similar to Yahoo. We compete against these and other companies to attract and retain users, advertisers, developers, and third-party Website publishers as participants in our Affiliate network, and to obtain agreements with third parties to promote or distribute our services. We also compete with social media and networking sites which are increasingly used to communicate and share information, and which are attracting a substantial and increasing share of users, users online time, and online advertising dollars.
A key element of our strategy is focusing on mobile products and mobile advertising formats, as well as increasing our revenue from mobile. A number of our competitors have devoted significant resources to the development of products and services for mobile devices. Currently our revenue from mobile is not material and our competitors have mobile revenue significantly greater than ours. If we are unable to develop products for mobile devices that users find engaging and that help us grow our mobile revenue, our competitive position, our financial condition and operating results could be harmed.
In addition, a number of competitors offer products and services that directly compete for users with our offerings, including e-mail, search, sports, news and finance. Similarly, the advertising networks operated by our competitors or by other participants in the display marketplace offer advertising exchanges, ad networks, demand side platforms, ad serving technologies, sponsored search offerings, and other services that directly compete for advertisers with our offerings. We also compete with traditional print and broadcast media companies to attract domestic and international advertising spending. Some of our existing competitors and possible entrants may have greater brand recognition for certain products and services, more expertise in particular market segments, and greater operational, strategic, technological, financial, personnel, or other resources than we do. Many of our competitors have access to considerable financial and technical resources with which to compete aggressively, including by funding future growth and expansion and investing in acquisitions, technologies, and research and development. Further, emerging start-ups may be able to innovate and provide new products and services faster than we can. In addition, competitors may consolidate or collaborate with each other, and new competitors may enter the market. Some of our competitors in international markets have a substantial competitive advantage over us because they have dominant market share in their territories, have greater local brand recognition, are focused on a single market, are more familiar with local tastes and preferences, or have greater regulatory and operational flexibility due to the fact that we may be subject to both U.S. and foreign regulatory requirements.
If our competitors are more successful than we are in developing and deploying compelling products or in attracting and retaining users, advertisers, publishers, developers, or distributors, our revenue and growth rates could decline.
We generate the majority of our revenue from display and search advertising, and the reduction in spending by or loss of current or potential advertisers would cause our revenue and operating results to decline.
For the twelve months ended December 31, 2013, 79 percent of our total revenue came from display and search advertising. Our ability to retain and grow display and search revenue depends upon:
| | maintaining and growing our user base and popularity as an Internet destination site; |
| | maintaining the popularity of our existing products and introducing engaging new products and making our new and existing products popular and distributable on mobile and other alternative devices and platforms; |
13
| | maintaining and expanding our advertiser base on PCs and mobile devices; |
| | broadening our relationships with advertisers to small- and medium-sized businesses; |
| | successfully implementing changes and improvements to our advertising management platforms and obtaining the acceptance of our advertising management platforms by advertisers, Website publishers, and online advertising networks; |
| | successfully acquiring, investing in, and implementing new technologies and strategic partnerships; |
| | successfully implementing changes in our sales force, sales development teams, and sales strategy; |
| | continuing to innovate and improve the monetization capabilities of our display advertising and mobile products; |
| | effectively monetizing mobile and other search queries; |
| | continuing to innovate and improve users search experiences; |
| | maintaining and expanding our Affiliate program for search and display advertising services; and |
| | deriving better demographic and other information about our users to enable us to offer better experiences to both our users and advertisers. |
In most cases, our agreements with advertisers have a term of one year or less, and may be terminated at any time by the advertiser or by us. Search marketing agreements often have payments dependent upon usage or click-through levels. Accordingly, it is difficult to forecast display and search revenue accurately. In addition, our expense levels are based in part on expectations of future revenue, including occasional guaranteed minimum payments to our Affiliates in connection with search and/or display advertising, and are fixed over the short-term in some categories. The state of the global economy, growth rate of the online advertising market, and availability of capital has impacted and could further impact the advertising spending patterns of our existing and potential advertisers. Any reduction in spending by, or loss of, existing or potential advertisers would negatively impact our revenue and operating results. Further, we may be unable to adjust our expenses and capital expenditures quickly enough to compensate for any unexpected revenue shortfall.
If we do not manage our operating expenses effectively, our profitability could decline.
We plan to continue to manage costs to better and more efficiently manage our business. However, our operating expenses might increase as we expand our operations in areas of desired growth, continue to develop and extend the Yahoo brand, fund product development, build or expand data centers, acquire additional office space, and continue to make talent acquisitions and to acquire and integrate complementary businesses and technologies. If our expenses increase at a greater pace than our revenue, or if we fail to effectively manage costs, our profitability will decline.
If we are unable to provide innovative search experiences and other products and services that generate significant traffic to our Websites, our business could be harmed, causing our revenue to decline.
Internet search is characterized by rapidly changing technology, significant competition, evolving industry standards, and frequent product and service enhancements. Even though we have substantially completed the transition to Microsofts platform, we still need to continue to invest and innovate to improve our users search experience to continue to attract, retain, and expand our user base and paid search advertiser base. We also need to continue to invest in and innovate on the mobile search experience.
We also generate revenue through other online products and services, such as Yahoo Mail, and continue to innovate the products and services that we offer. The research and development of new, technologically advanced products is a complex process that requires significant levels of innovation and investment, as well as
14
accurate anticipation of technology, market and consumer trends. If we are unable to provide innovative products and services which generate significant traffic to our Websites, our business could be harmed, causing our revenue to decline.
Risks associated with our Search Agreement with Microsoft may adversely affect our business and operating results.
Under our Search Agreement with Microsoft, Microsoft is the exclusive algorithmic and paid search services provider on Yahoo Properties and non-exclusive provider of such services on Affiliate sites for the transitioned markets. Approximately 31 percent, 25 percent, and 20 percent of our revenue for 2013, 2012 and 2011, respectively, were attributable to the Search Agreement. Our business and operating results would be adversely affected by a significant decline in or loss of this revenue.
Implementation of our Search Agreement with Microsoft commenced on February 23, 2010. We have completed the transition of our algorithmic search platform to the Microsoft platform and have substantially completed transition of paid search.
In September 2013, the Company advised Microsoft that we were delaying the transition of paid search in Taiwan and Hong Kong. Microsoft disagreed with the delay and the parties engaged in litigation regarding the transition of these markets. The transition of paid search in Taiwan and Hong Kong was completed in December 2013; however, Microsoft could seek recovery of its costs and damages.
Under the Search Agreement, Microsoft initially agreed to guarantee Yahoos revenue per search (RPS Guarantee) on Yahoo Properties for 18 months after the transition of paid search services to Microsofts platform in each market based on the difference in revenue per search between the pre-transition and post-transition periods and certain other factors. Paid search services in the U.S. and Canada transitioned to Microsofts platform in the fourth quarter of 2010, other markets followed as described above. To date, there has been a gap in revenue per search between pre-transition and post-transition periods in most markets and the payments under the RPS Guarantee were intended to compensate for the difference. In the fourth quarter of 2011, Microsoft agreed to extend the RPS Guarantee in the U.S. and Canada through March 2013, and in the second quarter of 2013 Microsoft extended the RPS Guarantee in the U.S. through March 2014. In June 2013, Microsoft and Yahoo agreed upon the RPS Guarantee payment amounts to be paid to us for the quarters ended December 31, 2012, March 31, 2013 and June 30, 2013. We also agreed to fixed quarterly payments in lieu of the RPS Guarantee in the U.S. for the quarters ending September 30, 2013, December 31, 2013 and March 31, 2014. In addition, we agreed to waive our right to receive any future RPS Guarantee payments in all markets except Taiwan and Hong Kong.
To the extent the fixed quarterly payments and any RPS Guarantee payments we receive from Microsoft do not fully offset any shortfall relating to revenue per search in the transitioned markets or any shortfall continues after the expiration of the fixed quarterly payments and RPS Guarantee payments, our search revenue and profitability would decline. Notwithstanding the fixed quarterly payments or any RPS Guarantee payments we may receive from Microsoft, our competitors may continue to increase revenue, profitability, and market share at a higher rate than we do.
As mobile advertising continues to evolve and people increasingly access our products via mobile devices rather than PCs, our financial results may be adversely impacted if our mobile offerings are not widely adopted by users, advertisers and device manufacturers or if we do not generate adequate revenue from our mobile offerings.
The number of people who access the Internet through mobile devices rather than a PC, including mobile telephones, smartphones and tablets, is increasing and will likely continue to increase dramatically. Approximately half of our monthly users are now joining us on mobile. In addition, search queries are increasingly being undertaken through mobile devices. We expect our ability to grow advertising revenue will become increasingly dependent on our ability to generate revenue from ads displayed on mobile devices.
15
A key element of our strategy is focusing on mobile devices and we expect to continue to devote significant resources to the creation and support of developing new and innovative mobile products and services. However, if our new mobile products and services, including new forms of Internet advertising for mobile devices, are not more attractive and successful in attracting and retaining users, advertisers and device manufacturers than those of our competitors and fail to generate and grow revenue, our operating and financial results will be adversely impacted.
To the extent that an access provider or device manufacturer enters into a distribution arrangement with one of our competitors, or as our competitors design, develop, or acquire control of alternative devices or their operating systems, we face an increased risk that our users will favor the services or properties of that competitor. We are dependent on the interoperability of our products and services with mobile operating systems we do not control. The manufacturer or access provider might promote a competitors services or might impair users access to our services by blocking access through their devices or by not making our services or apps available in a readily-discoverable manner on their devices. If distributors impair access to or refuse to distribute our services or apps, then our user engagement and revenue could decline.
If we are unable to license or acquire compelling content and services at reasonable cost or if we do not develop or commission compelling content of our own, the number of users of our services may not grow as anticipated, or may decline, or users level of engagement with our services may decline, all or any of which could harm our operating results.
Our future success depends in part on our ability to aggregate compelling content and deliver that content through our online properties. We license from third parties much of the content and services on our online properties, such as news items, stock quotes, weather reports, video, and maps. We believe that users will increasingly demand high-quality content and services. We may need to make substantial payments to third parties from whom we license or acquire such content or services. Our ability to maintain and build relationships with such third-party providers is critical to our success. In addition, as users increasingly access the Internet via mobile and other alternative devices, we may need to enter into amended agreements with existing third-party providers to cover the new devices. We may be unable to enter into new, or preserve existing, relationships with the third-parties whose content or services we seek to obtain. In addition, as competition for compelling content increases both domestically and internationally, our third-party providers may increase the prices at which they offer their content and services to us, and potential providers may not offer their content or services to us at all, or may offer them on terms that are not agreeable to us. An increase in the prices charged to us by third-party providers could harm our operating results and financial condition. Further, because many of our content and services licenses with third parties are non-exclusive, other media providers may be able to offer similar or identical content. This increases the importance of our ability to deliver compelling editorial content and personalization of this content for users in order to differentiate Yahoo from other businesses. If we are unable to license or acquire compelling content at reasonable cost, if other companies distribute content or services that are similar to or the same as that provided by us, or if we do not develop or commission compelling editorial content or personalization services, the number of users of our services may not grow as anticipated, or may decline, or users level of engagement with our services may decline, all or any of which could harm our operating results.
Acquisitions and strategic investments could result in adverse impacts on our operations and in unanticipated liabilities.
We have acquired, and have made strategic investments in, a number of companies (including through joint ventures) in the past, and we expect to make additional acquisitions and strategic investments in the future. Such transactions may result in dilutive issuances of our equity securities, use of our cash resources, and incurrence of debt and amortization expenses related to intangible assets. Our acquisitions and strategic investments to date were accompanied by a number of risks, including:
| | the difficulty of assimilating the operations and personnel of acquired companies into our operations; |
| | the potential disruption of our ongoing business and distraction of management; |
16
| | the incurrence of additional operating losses and operating expenses of the businesses we acquired or in which we invested; |
| | the difficulty of integrating acquired technology and rights into our services and unanticipated expenses related to such integration; |
| | the failure to successfully further develop an acquired business or technology and any resulting impairment of amounts currently capitalized as intangible assets; |
| | the failure of strategic investments to perform as expected or to meet financial projections; |
| | the potential for patent and trademark infringement and data privacy and security claims against the acquired companies, or companies in which we have invested; |
| | litigation or other claims in connection with acquisitions, acquired companies, or companies in which we have invested; |
| | the impairment or loss of relationships with customers and partners of the companies we acquired or in which we invested or with our customers and partners as a result of the integration of acquired operations; |
| | the impairment of relationships with, or failure to retain, employees of acquired companies or our existing employees as a result of integration of new personnel; |
| | our lack of, or limitations on our, control over the operations of our joint venture companies; |
| | the difficulty of integrating operations, systems, and controls as a result of cultural, regulatory, systems, and operational differences; |
| | in the case of foreign acquisitions and investments, the impact of particular economic, tax, currency, political, legal and regulatory risks associated with specific countries; and |
| | the impact of known potential liabilities or liabilities that may be unknown, including as a result of inadequate internal controls, associated with the companies we acquired or in which we invested. |
We are likely to experience similar risks in connection with our future acquisitions and strategic investments. Our failure to be successful in addressing these risks or other problems encountered in connection with our past or future acquisitions and strategic investments could cause us to fail to realize the anticipated benefits of such acquisitions or investments, incur unanticipated liabilities, and harm our business generally.
We may be required to record a significant charge to earnings if our goodwill, amortizable intangible assets, investments in equity interests, including investments held by our equity method investees, or other investments become impaired.
We are required under generally accepted accounting principles to test goodwill for impairment at least annually and to review our amortizable intangible assets and investments in equity interests, including investments held by our equity method investees, for impairment when events or changes in circumstance indicate the carrying value may not be recoverable. Factors that could lead to impairment of goodwill and amortizable intangible assets (including goodwill or assets acquired via acquisitions) include significant adverse changes in the business climate and actual or projected operating results (affecting our company as a whole or affecting any particular reporting unit) and declines in the financial condition of our business. Factors that could lead to impairment of investments in equity interests include a prolonged period of decline in the stock price or operating performance of, or an announcement of adverse changes or events by, the companies in which we invested or the investments held by those companies. Factors that could lead to an impairment of U.S. government securities, which constitute a significant portion of our assets, include any downgrade of U.S. government debt or concern about the creditworthiness of the U.S. government. We have recorded and may be required in the future to record additional charges to earnings if our goodwill, amortizable intangible assets, investments in equity interests, including investments held by our equity investees, or other investments become impaired. Any such charge would adversely impact our financial results.
17
Fluctuations in foreign currency exchange rates may adversely affect our operating results and financial condition.
Revenue generated and expenses incurred by our international subsidiaries and equity method investees are often denominated in the currencies of the local countries. As a result, our consolidated U.S. dollar financial statements are subject to fluctuations due to changes in exchange rates as the financial results of our international subsidiaries and equity method investees are translated from local currencies into U.S. dollars. Our financial results are also subject to changes in exchange rates that impact the settlement of transactions in non-local currencies. The carrying values of our equity investments in our equity investees are also subject to fluctuations in the exchange rates of foreign currencies.
We use derivative instruments, such as foreign currency forward contracts, to partially offset certain exposures to fluctuations in foreign currency exchange rates. The use of such instruments may not offset any, or more than a portion, of the adverse financial effects of unfavorable movements in foreign currency exchange rates. Any losses on these instruments that we experience may adversely impact our financial results, cash flows and financial condition. Further, we hedge a portion of our net investment in Yahoo Japan with currency forward contracts. If the Japanese yen appreciated at maturity beyond the forward contract execution rates, we would be required to settle the contract by making a cash payment which could be material and could adversely impact our cash flows and financial condition. See Part II, Item 7AQuantitative and Qualitative Disclosures About Market Risk of this Annual Report.
Our business depends on a strong brand, and failing to maintain or enhance the Yahoo brands in a cost-effective manner could harm our operating results.
Maintaining and enhancing our brands is an important aspect of our efforts to attract and expand our user, advertiser, and Affiliate base. We believe that the importance of brand recognition will increase due to the relatively low barriers to entry in certain portions of the Internet market. Maintaining and enhancing our brands will depend largely on our ability to provide high-quality, innovative products and services, which we might not do successfully. We have spent and expect to spend considerable money and resources on the establishment and maintenance of our brands, as well as advertising, marketing, and other brand-building efforts to preserve and enhance consumer awareness of our brands. Our brands may be negatively impacted by a number of factors such as service outages, product malfunctions, data protection and security issues, exploitation of our trademarks by others without permission, and poor presentation or integration of our search marketing offerings by Affiliates on their sites or in their software and services.
Further, while we attempt to ensure that the quality of our brands is maintained by our licensees, our licensees might take actions that could impair the value of our brands, our proprietary rights, or the reputation of our products and media properties. If we are unable to maintain or enhance our brands in a cost-effective manner, or if we incur excessive expenses in these efforts, our business, operating results and financial condition could be harmed.
We are regularly involved in claims, suits, government investigations, and other proceedings that may result in adverse outcomes.
We are regularly involved in claims, suits, government investigations, and proceedings arising from the ordinary course of our business, including actions with respect to intellectual property claims, privacy, consumer protection, information security, data protection or law enforcement matters, tax matters, labor and employment claims, commercial claims, as well as actions involving content generated by our users, stockholder derivative actions, purported class action lawsuits, and other matters. Such claims, suits, government investigations, and proceedings are inherently uncertain and their results cannot be predicted with certainty. Regardless of the outcome, such legal proceedings can have an adverse impact on us because of legal costs, diversion of management and other personnel, and other factors. In addition, it is possible that a resolution of one or more such proceedings could result in reputational harm, liability, penalties, or sanctions, as well as judgments,
18
consent decrees, or orders preventing us from offering certain features, functionalities, products, or services, or requiring a change in our business practices, products or technologies, which could in the future materially and adversely affect our business, operating results, and financial condition. See Note 12Commitments and Contingencies in the Notes to our consolidated financial statements.
On May 15, 2013, the Superior Court of Justice for the Federal District of Mexico reversed a judgment of U.S. $2.75 billion that had been entered against us and our subsidiary, Yahoo! Mexico, in a lawsuit brought by plaintiffs Worldwide Directories S.A. de C.V. and Ideas Interactivas, S.A. de C.V. The plaintiffs have appealed. We believe the plaintiffs claims are without legal or factual merit. We do not believe that it is probable the judgment will be reinstated on appeal, however we cannot predict the timing of a decision or assure the ultimate outcome of the pending or further appeals. If we are ultimately required to pay all or a significant portion of the judgment, together with any potential additional damages, interests and costs, it would have a material adverse effect on our financial condition, results of operations and cash flows. We will also be required to record an accrual for the judgment if we should determine in the future that it is probable that we will be required to pay the judgment.
Our intellectual property rights are valuable, and any failure or inability to sufficiently protect them could harm our business and our operating results.
We create, own, and maintain a wide array of copyrights, patents, trademarks, trade dress, trade secrets, rights to domain names and other intellectual property assets which we believe are collectively among our most valuable assets. We seek to protect our intellectual property assets through patent, copyright, trade secret, trademark, and other laws of the U.S. and other countries of the world, and through contractual provisions. However, the efforts we have taken to protect our intellectual property and proprietary rights might not be sufficient or effective at stopping unauthorized use of those rights. Protection of the distinctive elements of Yahoo might not always be available under copyright law or trademark law, or we might not discover or determine the full extent of any unauthorized use of our copyrights and trademarks in order to protect our rights. In addition, effective trademark, patent, copyright, and trade secret protection might not be available or cost-effective in every country in which our products and media properties are distributed or made available through the Internet. Changes in patent law, such as changes in the law regarding patentable subject matter, could also impact our ability to obtain patent protection for our innovations. In particular, recent amendments to the U.S. patent law may affect our ability to protect our innovations and defend against claims of patent infringement. Further, given the costs of obtaining patent protection, we might choose not to protect (or not to protect in some jurisdictions) certain innovations that later turn out to be important. There is also a risk that the scope of protection under our patents may not be sufficient in some cases or that existing patents may be deemed invalid or unenforceable. To help maintain our trade secrets, we have entered into confidentiality agreements with most of our employees and contractors, and confidentiality agreements with many of the parties with whom we conduct business, in order to limit access to and disclosure of our proprietary information. If these confidentiality agreements are breached it could compromise our trade secrets and cause us to lose any competitive advantage provided by those trade secrets.
If we are unable to protect our proprietary rights from unauthorized use, the value of our intellectual property assets may be reduced. In addition, protecting our intellectual property and other proprietary rights is expensive and time consuming. Any increase in the unauthorized use of our intellectual property could make it more expensive to do business and consequently harm our operating results.
We are, and may in the future be, subject to intellectual property infringement or other third-party claims, which are costly to defend, could result in significant damage awards, and could limit our ability to provide certain content or use certain technologies in the future.
Internet, technology, media, and patent holding companies often possess a significant number of patents. Further, many of these companies and other parties are actively developing or purchasing search, indexing, electronic commerce, and other Internet-related technologies, as well as a variety of online business models and methods.
19
We believe that these parties will continue to take steps such as seeking patent protection to protect these technologies. In addition, patent holding companies may continue to seek to monetize patents they have purchased or otherwise obtained. As a result, disputes regarding the ownership of technologies and rights associated with online businesses are likely to continue to arise in the future. From time to time, parties assert patent infringement claims against us. Currently, we are engaged in a number of lawsuits regarding patent issues and have been notified of a number of other potential disputes.
In addition to patent claims, third parties have asserted, and are likely in the future to assert, claims against us alleging infringement of copyrights, trademark rights, trade secret rights or other proprietary rights, or alleging unfair competition, violation of federal or state statutes or other claims, including alleged violation of international statutory and common law. In addition, third parties have made, and may continue to make, infringement and related claims against us over the display of content or search results triggered by search terms, including the display of advertising, that include trademark terms.
As we expand our business and develop new technologies, products and services, we may become increasingly subject to intellectual property infringement and other claims, including those that may arise under international laws. In the event that there is a determination that we have infringed third-party proprietary rights such as patents, copyrights, trademark rights, trade secret rights, or other third-party rights such as publicity and privacy rights, we could incur substantial monetary liability, or be required to enter into costly royalty or licensing agreements or be prevented from using such rights, which could require us to change our business practices in the future, hinder us from offering certain features, functionalities, products or services, require us to develop non-infringing products or technologies, and limit our ability to compete effectively. We may also incur substantial expenses in defending against third-party claims regardless of the merit of such claims. In addition, many of our agreements with our customers or Affiliates require us to indemnify them for some types of third-party intellectual property infringement claims, which could increase our costs in defending such claims and our damages. Furthermore, such customers and Affiliates may discontinue the use of our products, services, and technologies either as a result of injunctions or otherwise. The occurrence of any of these results could harm our brands or have an adverse effect on our business, financial position, operating results, and cash flows.
A variety of new and existing U.S. and foreign government laws and regulations could subject us to claims, judgments, monetary liabilities and other remedies, and to limitations on our business practices.
We are subject to numerous U.S. and foreign laws and regulations covering a wide variety of subject matters. New laws and regulations, changes in existing laws and regulations or the interpretation of them, our introduction of new products, or an extension of our business into new areas, could increase our future compliance costs, make our products and services less attractive to our users, or cause us to change or limit our business practices. We may incur substantial expenses to comply with laws and regulations or defend against a claim that we have not complied with them. Further, any failure on our part to comply with any relevant laws or regulations may subject us to significant civil or criminal liabilities, penalties, and negative publicity.
The application of existing domestic and international laws and regulations to us relating to issues such as user privacy and data protection, security, defamation, pricing, advertising, taxation, gambling, sweepstakes, promotions, billing, real estate, consumer protection, accessibility, content regulation, quality of services, law enforcement demands, telecommunications, mobile, television, and intellectual property ownership and infringement in many instances is unclear or unsettled. Further, the application to us or our subsidiaries of existing laws regulating or requiring licenses for certain businesses of our advertisers can be unclear. U.S. export control laws and regulations also impose requirements and restrictions on exports to certain nations and persons and on our business. Internationally, we may also be subject to laws regulating our activities in foreign countries and to foreign laws and regulations that are inconsistent from country to country.
The Digital Millennium Copyright Act (DMCA) is intended, in part, to limit the liability of eligible online service providers for caching, hosting, listing or linking to, third-party Websites or user content that include
20
materials that give rise to copyright infringement. Portions of the Communications Decency Act (CDA) are intended to provide statutory protections to online service providers who distribute third-party content. We rely on the protections provided by both the DMCA and the CDA in conducting our business, and may be adversely impacted by future legislation and future judicial decisions altering these safe harbors or if international jurisdictions refuse to apply similar protections.
The Childrens Online Privacy Protection Act and rule, as amended in December 2012 (COPPA), impose restrictions on the ability of online services to collect some types of information from children under the age of 13. In addition, Providing Resources, Officers, and Technology to Eradicate Cyber Threats to Our Children Act of 2008 (PROTECT) requires online service providers to report evidence of violations of federal child pornography laws under certain circumstances. COPPA and PROTECT currently impose restrictions and requirements on our business, and other federal, state or international laws and legislative efforts designed to protect children on the Internet may impose additional requirements on us.
Changes in regulations or user concerns regarding privacy and protection of user data, or any failure to comply with such laws, could adversely affect our business.
Federal, state, and international laws and regulations govern the collection, use, retention, disclosure, sharing and security of data that we receive from and about our users. The use of consumer data by online service providers and advertising networks is a topic of active interest among federal, state, and international regulatory bodies, and the regulatory environment is unsettled. Many states have passed laws requiring notification to users where there is a security breach for personal data, such as Californias Information Practices Act. We face similar risks in international markets where our products and services are offered. Any failure, or perceived failure, by us to comply with or make effective modifications to our policies, or to comply with any federal, state, or international privacy, data-retention or data-protection-related laws, regulations, orders or industry self-regulatory principles could result in proceedings or actions against us by governmental entities or others, a loss of user confidence, damage to the Yahoo brands, and a loss of users, advertising partners, or Affiliates, any of which could potentially have an adverse effect on our business.
In addition, various federal, state and foreign legislative or regulatory bodies may enact new or additional laws and regulations concerning privacy, data-retention and data-protection issues, including laws or regulations mandating disclosure to domestic or international law enforcement bodies, which could adversely impact our business, our brand or our reputation with users. For example, some countries are considering laws mandating that user data regarding users in their country be maintained in their country. Having to maintain local data centers in individual countries could increase our operating costs significantly. The interpretation and application of privacy, data protection and data retention laws and regulations are often uncertain and in flux in the U.S. and internationally. These laws may be interpreted and applied inconsistently from country to country and inconsistently with our current policies and practices, complicating long-range business planning decisions. If privacy, data protection or data retention laws are interpreted and applied in a manner that is inconsistent with our current policies and practices we may be fined or ordered to change our business practices in a manner that adversely impacts our operating results. Complying with these varying international requirements could cause us to incur substantial costs or require us to change our business practices in a manner adverse to our business and operating results.
If our security measures are breached, our products and services may be perceived as not being secure, users and customers may curtail or stop using our products and services, and we may incur significant legal and financial exposure.
Our products and services involve the storage and transmission of Yahoos users and customers personal and proprietary information in our facilities and on our equipment, networks and corporate systems. Security breaches expose us to a risk of loss of this information, litigation, remediation costs, increased costs for security measures, loss of revenue, damage to our reputation, and potential liability. Security breaches or unauthorized
21
access have resulted in and may in the future result in a combination of significant legal and financial exposure, increased remediation and other costs, damage to our reputation and a loss of confidence in the security of our products, services and networks that could have an adverse effect on our business. We take steps to prevent unauthorized access to our corporate systems, however, because the techniques used to obtain unauthorized access, disable or degrade service, or sabotage systems change frequently or may be designed to remain dormant until a triggering event, we may be unable to anticipate these techniques or implement adequate preventative measures. If an actual or perceived breach of our security occurs, the market perception of the effectiveness of our security measures could be harmed and we could lose users and customers.
Interruptions, delays, or failures in the provision of our services could damage our reputation and harm our operating results.
Delays or disruptions to our service, or the loss or compromise of data, could result from a variety of causes, including the following:
| | Our operations are susceptible to outages and interruptions due to fire, flood, earthquake, tsunami, other natural disasters, power loss, equipment or telecommunications failures, cyber attacks, terrorist attacks, political or social unrest, and other events over which we have little or no control. We do not have multiple site capacity for all of our services and some of our systems are not fully redundant in the event of delays or disruptions to service, so some data or systems may not be fully recoverable after such events. |
| | The systems through which we provide our products and services are highly technical, complex, and interdependent. Design errors might exist in these systems, or might be introduced when we make modifications, which might cause service malfunctions or require services to be taken offline while corrective responses are developed. |
| | Despite our implementation of network security measures, our servers are vulnerable to computer viruses, malware, worms, hacking, physical and electronic break-ins, router disruption, sabotage or espionage, and other disruptions from unauthorized access and tampering, as well as coordinated denial-of-service attacks. We may not be in a position to promptly address attacks or to implement adequate preventative measures if we are unable to immediately detect such attacks. Such events could result in large expenditures to investigate or remediate, to recover data, to repair or replace networks or information systems, including changes to security measures, to deploy additional personnel, to defend litigation or to protect against similar future events, and may cause damage to our reputation or loss of revenue. |
| | We rely on third-party providers over which we have little or no control for our principal Internet connections and co-location of a significant portion of our data servers, as well as for our payment processing capabilities and key components or features of certain of our products and services. Any disruption of the services they provide us or any failure of these third-party providers to handle higher volumes of use could, in turn, cause delays or disruptions in our services and loss of revenue. In addition, if our agreements with these third-party providers are terminated for any reason, we might not have a readily available alternative. |
Prolonged delays or disruptions to our service could result in a loss of users, damage to our brands, legal costs or liability, and harm to our operating results.
Our international operations expose us to additional risks that could harm our business, operating results, and financial condition.
In addition to uncertainty about our ability to continue to generate revenue from our foreign operations and expand our international market position, there are additional risks inherent in doing business internationally (including through our international joint ventures), including:
| | tariffs, trade barriers, customs classifications and changes in trade regulations; |
| | difficulties in developing, staffing, and simultaneously managing a large number of varying foreign operations as a result of distance, language, and cultural differences; |
22
| | stringent local labor laws and regulations; |
| | longer payment cycles; |
| | credit risk and higher levels of payment fraud; |
| | profit repatriation restrictions and foreign currency exchange restrictions; |
| | political or social unrest, economic instability, repression, or human rights issues; |
| | geopolitical events, including natural disasters, acts of war and terrorism; |
| | import or export regulations; |
| | compliance with U.S. laws such as the Foreign Corrupt Practices Act, and local laws prohibiting bribery and corrupt payments to government officials; |
| | antitrust and competition regulations; |
| | potentially adverse tax developments; |
| | seasonal volatility in business activity and local economic conditions; |
| | economic uncertainties relating to volatility in emerging markets and global economic uncertainty; |
| | laws, regulations, licensing requirements, and business practices that favor local competitors or prohibit foreign ownership or investments; |
| | different, uncertain or more stringent user protection, content, data protection, privacy, intellectual property and other laws; and |
| | risks related to other government regulation, required compliance with local laws or lack of legal precedent. |
We are subject to numerous and sometimes conflicting U.S. and foreign laws and regulations which increase our cost of doing business. Violations of these complex laws and regulations that apply to our international operations could result in damage awards, fines, criminal actions, sanctions, or penalties against us, our officers or our employees, prohibitions on the conduct of our business and our ability to offer products and services, and damage to our reputation. Although we have implemented policies and procedures designed to promote compliance with these laws, there can be no assurance that our employees, contractors, or agents will not violate our policies. These risks inherent in our international operations and expansion increase our costs of doing business internationally and could result in harm to our business, operating results, and financial condition.
We may be subject to legal liability associated with providing online services or content.
We host and provide a wide variety of services and technology products that enable and encourage individuals and businesses to exchange information; upload or otherwise generate photos, videos, text, and other content; advertise products and services; conduct business; and engage in various online activities both domestically and internationally. The law relating to the liability of providers of online services and products for activities of their users is currently unsettled both within the U.S. and internationally. As a publisher and producer of original content, we may be subject to claims such as copyright, libel, defamation or improper use of publicity rights, as well as other infringement claims such as plagiarism. Claims have been threatened and brought against us for defamation, negligence, breaches of contract, plagiarism, copyright and trademark infringement, unfair competition, unlawful activity, tort, including personal injury, fraud, or other theories based on the nature and content of information which we publish or to which we provide links or that may be posted online or generated by us or by third parties, including our users. In addition, we have been and may again in the future be subject to domestic or international actions alleging that certain content we have generated or third-party content that we have made available within our services violates laws in domestic and international jurisdictions. We arrange for the distribution of third-party advertisements to third-party publishers and advertising networks, and we offer third-party products, services, or content, such as stock quotes and trading information, under the Yahoo brand or
23
via distribution on Yahoo Properties. We may be subject to claims concerning these products, services, or content by virtue of our involvement in marketing, branding, broadcasting, or providing access to them, even if we do not ourselves host, operate, provide, or provide access to these products, services, or content. While our agreements with respect to these products, services, and content may provide that we will be indemnified against such liabilities, the ability to receive such indemnification may be disputed, could result in substantial costs to enforce or defend, and depends on the financial resources of the other party to the agreement, and any amounts received might not be adequate to cover our liabilities or the costs associated with defense of such proceedings. Defense of any such actions could be costly and involve significant time and attention of our management and other resources, may result in monetary liabilities or penalties, and may require us to change our business in an adverse manner.
It is also possible that if any information provided directly by us contains errors or is otherwise wrongfully provided to users, third parties could make claims against us. For example, we offer Web-based e-mail services, which expose us to potential risks, such as liabilities or claims, by our users and third parties, resulting from unsolicited e-mail, lost or misdirected messages, illegal or fraudulent use of e-mail, alleged violations of policies, property interests, or privacy protections, including civil or criminal laws, or interruptions or delays in e-mail service. We may also face purported consumer class actions or state actions relating to our online services, including our fee-based services (particularly in connection with any decision to discontinue a fee-based service). In addition, our customers, third parties, or government entities may assert claims or actions against us if our online services or technologies are used to spread or facilitate malicious or harmful code or applications.
Investigating and defending these types of claims are expensive, even if the claims are without merit or do not ultimately result in liability, and could subject us to significant monetary liability or cause a change in business practices that could negatively impact our ability to compete.
If we are unable to recruit, hire, motivate, and retain key personnel, we may not be able to execute our business plan.
Our business is dependent on our ability to recruit, hire, motivate, and retain talented, highly skilled personnel. Achieving this objective may be difficult due to many factors, including the intense competition for such highly skilled personnel in the San Francisco Bay Area and other metropolitan areas where our offices are located; fluctuations in global economic and industry conditions; competitors hiring practices; and the effectiveness of our compensation programs. If we do not succeed in retaining and motivating our existing key employees, and in attracting new key personnel, we may be unable to meet our business plan and as a result, our revenue and profitability may decline.
Certain of our metrics are subject to inherent challenges in measurement, and real or perceived inaccuracies in such metrics may harm our reputation and negatively affect our business.
We present key metrics such as unique users, number of Ads Sold, number of Paid Clicks, Price-per-Click and Price-per-Ad that are calculated using internal company data. We periodically review and refine our methodologies for monitoring, gathering, and calculating these metrics. Based on this process, from time to time we update our methodologies.
While our metrics are based on what we believe to be reasonable measurements and methodologies, there are inherent challenges in deriving our metrics across large online and mobile populations around the world. In addition, our user metrics may differ from estimates published by third parties or from similar metrics of our competitors due to differences in methodology.
If advertisers or publishers do not perceive our metrics to be accurate, or if we discover material inaccuracies in our metrics, it could negatively affect our reputation, business and financial results.
24
Any failure to scale and adapt our existing technology architecture to manage expansion of user-facing services and to respond to rapid technological change could adversely affect our business.
As some of the most visited sites on the Internet, Yahoo Properties deliver a significant number of products, services, page views, and advertising impressions to users around the world. We expect our products and services to continue to expand and change significantly and rapidly in the future to accommodate new technologies, new devices, new Internet advertising solutions, and new means of content delivery.
In addition, widespread adoption of new Internet, networking or telecommunications technologies, or other technological changes, could require substantial expenditures to modify or adapt our services or infrastructure. The technology architectures and platforms utilized for our services are highly complex and may not provide satisfactory security features or support in the future, as usage increases and products and services expand, change, and become more complex. In the future, we may make additional changes to our existing, or move to completely new, architectures, platforms and systems, such as the changes we have made in response to the increased use of tablets and smartphones. Such changes may be technologically challenging to develop and implement, may take time to test and deploy, may cause us to incur substantial costs or data loss, and may cause changes, delays or interruptions in service. These changes, delays, or interruptions in our service may cause our users, Affiliates and other advertising platform participants to become dissatisfied with our service or to move to competing providers or seek remedial actions or compensation. Further, to the extent that demands for our services increase, we will need to expand our infrastructure, including the capacity of our hardware servers and the sophistication of our software. This expansion is likely to be expensive and complex and require additional technical expertise. As we acquire users who rely upon us for a wide variety of services, it becomes more technologically complex and costly to retrieve, store, and integrate data that will enable us to track each users preferences. Any difficulties experienced in adapting our architectures, platforms and infrastructure to accommodate increased traffic, to store user data, and track user preferences, together with the associated costs and potential loss of traffic, could harm our operating results, cash flows from operations, and financial condition.
We rely on third parties to provide the technologies necessary to deliver content, advertising, and services to our users, and any change in the licensing terms, costs, availability, or acceptance of these formats and technologies could adversely affect our business.
We rely on third parties to provide the technologies that we use to deliver content, advertising, and services to our users. There can be no assurance that these providers will continue to license their technologies or intellectual property to us on reasonable terms, or at all. Providers may change the fees they charge users or otherwise change their business model in a manner that slows the widespread acceptance of their technologies. In order for our services to be successful, there must be a large base of users of the technologies necessary to deliver our content, advertising, and services. We have limited or no control over the availability or acceptance of those technologies, and any change in the licensing terms, costs, availability, or user acceptance of these technologies could adversely affect our business.
Our business depends on continued and unimpeded access to the Internet by us and our users. Internet access providers may be able to block, degrade, or charge for access to certain of our products and services, which could lead to additional expenses and the loss of users and advertisers.
Our products and services depend on the ability of our users to access the Internet, and certain of our products require significant bandwidth to work effectively. Currently, this access is provided by companies that have significant market power in the broadband and internet access marketplace, including incumbent telephone companies, cable companies, mobile communications companies, and government-owned service providers. Some of these providers have taken, or have stated that they may take, measures that could degrade, disrupt, or increase the cost of user access to certain of our products by restricting or prohibiting the use of their infrastructure to support or facilitate our offerings, or by charging increased fees to us or our users to provide our offerings. Such interference could result in a loss of existing users and advertisers, and increased costs, and could impair our ability to attract new users and advertisers, thereby harming our revenues and growth.
25
If we are unable to attract, sustain, and renew distribution arrangements on favorable terms, our revenue may decline.
We enter into distribution arrangements with third parties such as operators of third-party Websites, online networks, software companies, electronics companies, computer manufacturers, Internet service providers and others to promote or supply our services to their users. For example:
| | We maintain search and display advertising relationships with Affiliate sites, which integrate our advertising offerings into their Websites. |
| | We enter into distribution alliances with Internet service providers (including providers of cable and broadband Internet access) and software distributors to promote our services to their users. |
| | We enter into agreements with mobile phone, tablet, television, and other device manufacturers, electronics companies and carriers to promote our software and services on their devices. |
In some markets, we depend on a limited number of distribution arrangements for a significant percentage of our user activity. A failure by our distributors to attract or retain their user bases would negatively impact our user activity and, in turn, reduce our revenue. In some cases, device manufacturers may be unwilling to pay fees to Yahoo in order to distribute Yahoo services or may be unwilling to distribute Yahoo services.
In the future, as new methods for accessing the Internet and our services become available, including through alternative devices, we may need to enter into amended distribution agreements with existing access providers, distributors, and manufacturers to cover the new devices and new arrangements. We face a risk that existing and potential new access providers, distributors, and manufacturers may decide not to offer distribution of our services on reasonable terms, or at all.
Distribution agreements often involve revenue sharing. Over time competition to enter into distribution arrangements may cause our traffic acquisition costs to increase. In some cases, we guarantee distributors a minimum level of revenue and, as a result, run a risk that the distributors performance (in terms of ad impressions, toolbar installations, etc.) might not be sufficient to otherwise earn their minimum payments. In other cases, we agree that if the distributor does not realize specified minimum revenue we will adjust the distributors revenue-share percentage or provide make-whole arrangements.
Some of our distribution agreements are not exclusive, have a short term, are terminable at will, or are subject to early termination provisions. The loss of distributors, increased distribution costs, or the renewal of distribution agreements on significantly less favorable terms may cause our revenue to decline.
Technologies, tools, software, and applications could block our advertisements, impair our ability to deliver interest-based advertising, or shift the location in which advertising appears, which could harm our operating results.
Technologies, tools, software, and applications (including new and enhanced Web browsers) have been developed and are likely to continue to be developed that can block or allow users to opt out of display, search, and interest-based advertising and content, delete or block the cookies used to deliver such advertising, or shift the location in which advertising appears on pages so that our advertisements do not show up in the most monetizable places on our pages or are obscured. Most of our revenue is derived from fees paid by advertisers in connection with the display of graphical and non-graphical advertisements or clicks on search advertisements on Web pages. As a result, the adoption of such technologies, tools, software, and applications could reduce the number of display and search advertisements that we are able to deliver and/or our ability to deliver interest-based advertising and this, in turn, could reduce our advertising revenue and operating results.
26
Any failure to manage expansion and changes to our business could adversely affect our operating results.
If we are unable to effectively manage a large and geographically dispersed group of employees or to anticipate our future growth and personnel needs, our business may be adversely affected. As we expand our business, we must also expand and adapt our operational infrastructure. Our business relies on data systems, billing systems, and financial reporting and control systems, among others. All of these systems have become increasingly complex in the recent past due to the growing complexity of our business, acquisitions of new businesses with different systems, and increased regulation over controls and procedures. To manage our business in a cost-effective manner, we will need to continue to upgrade and improve our data systems, billing systems, and other operational and financial systems, procedures, and controls. In some cases, we are outsourcing administrative functions to lower-cost providers. These upgrades, improvements and outsourcing changes will require a dedication of resources and in some cases are likely to be complex. If we are unable to adapt our systems and put adequate controls in place in a timely manner, our business may be adversely affected. In particular, sustained failures of our billing systems to accommodate increasing numbers of transactions, to accurately bill users and advertisers, or to accurately compensate Affiliates could adversely affect the viability of our business model.
Proprietary document formats may limit the effectiveness of our search technology by preventing our technology from accessing the content of documents in such formats, which could limit the effectiveness of our products and services.
A large amount of information on the Internet is provided in proprietary document formats. These proprietary document formats may limit the effectiveness of search technology by preventing the technology from accessing the content of such documents. The providers of the software applications used to create these documents could engineer the document format to prevent or interfere with the process of indexing the document contents with search technology. This would mean that the document contents would not be included in search results even if the contents were directly relevant to a search. The software providers may also seek to require us to pay them royalties in exchange for giving us the ability to search documents in their format. If the search platform technology we employ is unable to index proprietary format Web documents as effectively as our competitors technology, usage of our search services might decline, which could cause our revenue to fall.
We have dedicated resources to provide a variety of premium enhancements to our products and services, which might not prove to be successful in generating significant revenue for us.
We offer fee-based enhancements for many of our free services. The development cycles for these technologies are long and generally require investment by us. We have invested and will continue to invest in premium products and services. Some of these premium products and services might not generate anticipated revenue or might not meet anticipated user adoption rates. We have previously discontinued some non-profitable premium services and may discontinue others. General economic conditions as well as the rapidly evolving competitive landscape may affect users willingness to pay for such premium services. If we cannot generate revenue from our premium services that are greater than the cost of providing such services, our operating results could be harmed.
We may have exposure to additional tax liabilities which could negatively impact our income tax provision, net income, and cash flow.
We are subject to income taxes and other taxes in both the U.S. and the foreign jurisdictions in which we currently operate or have historically operated. The determination of our worldwide provision for income taxes and current and deferred tax assets and liabilities requires judgment and estimation. In the ordinary course of our business, there are many transactions and calculations where the ultimate tax determination is uncertain. As a U.S. multinational corporation, we are subject to changing tax laws both within and outside of the U.S. We cannot predict the form or timing of potential legislative changes, but any newly enacted tax law could have a material adverse impact on our tax expense and cash flow. For example, several jurisdictions have sought to increase revenues by imposing new taxes on internet advertising or increasing general business taxes.
27
We earn a material amount of our operating income from outside the U.S. As of December 31, 2013, we had undistributed foreign earnings of approximately $2.6 billion, principally related to Yahoo Japan. While we do not currently anticipate repatriating these earnings, any repatriation of funds in foreign jurisdictions to the U.S. could result in higher effective tax rates for us and subject us to significant additional U.S. income tax liabilities.
We are subject to regular review and audit by both domestic and foreign tax authorities as well as subject to the prospective and retrospective effects of changing tax regulations and legislation. Although we believe our tax estimates are reasonable, the ultimate tax outcome may materially differ from the tax amounts recorded in our consolidated financial statements and may materially affect our income tax provision, net income, or cash flows in the period or periods for which such determination and settlement is made.
Adverse macroeconomic conditions could cause decreases or delays in spending by our advertisers and could harm our ability to generate revenue and our results of operations.
Advertising expenditures tend to be cyclical, reflecting overall economic conditions and budgeting and buying patterns. Since we derive most of our revenue from advertising, adverse macroeconomic conditions have caused, and future adverse macroeconomic conditions could cause, decreases or delays in advertising spending and negatively impact our advertising revenue and short-term ability to grow our revenue. Further, any decreased collectability of accounts receivable or early termination of agreements, whether resulting from customer bankruptcies or otherwise due to adverse macroeconomic conditions, could negatively impact our results of operations.
Our stock price has been volatile historically and may continue to be volatile regardless of our operating performance.
The trading price of our common stock has been and may continue to be subject to broad fluctuations. During the twelve months ended December 31 2013, the closing sale price of our common stock on the NASDAQ Global Select Market ranged from $18.99 to $40.85 per share and the closing sale price on February 14, 2014 was $38.23 per share. Our stock price may fluctuate in response to a number of events and factors, such as variations in quarterly operating results or announcements of technological innovations, significant transactions, or new features, products or services by us or our competitors; changes in financial estimates and recommendations by securities analysts; the operating and stock price performance of, or other developments involving, other companies that investors may deem comparable to us; trends in our industry; general economic conditions; and the current and anticipated future operating performance and market equity valuation of Alibaba Group (including speculation regarding its potential initial public offering) and Yahoo Japan Corporation in which we have equity investments, including changes in equity valuation due to fluctuations in foreign currency exchange rates.
In addition, the stock market in general, and the market prices for companies in our industry, have experienced volatility that often has been unrelated to operating performance. These broad market and industry fluctuations may adversely affect the price of our stock, regardless of our operating performance. A decrease in the market price of our common stock would likely adversely impact the trading price of the 0.00% Convertible Senior Notes due 2018 that we issued in November 2013 (the Notes). Volatility or a lack of positive performance in our stock price may also adversely affect our ability to retain key employees who have been granted stock options or other stock-based awards. A sustained decline in our stock price and market capitalization could lead to an impairment charge to our long-lived assets.
Delaware statutes and certain provisions in our charter documents could make it more difficult for a third-party to acquire us.
Our Board has the authority to issue up to 10 million shares of preferred stock and to determine the price, rights, preferences, privileges and restrictions, including voting rights, of those shares without any further vote or action
28
by the stockholders. The rights of the holders of our common stock may be subject to, and may be adversely affected by, the rights of the holders of any preferred stock that may be issued in the future. The issuance of preferred stock may have the effect of delaying, deterring or preventing a change in control of Yahoo without further action by the stockholders and may adversely affect the voting and other rights of the holders of our common stock.
Some provisions of our charter documents, including provisions eliminating the ability of stockholders to take action by written consent and limiting the ability of stockholders to raise matters at a meeting of stockholders without giving advance notice, may have the effect of delaying or preventing changes in control or changes in our management, which could have an adverse effect on the market price of our stock and the value of the $1.4375 billion aggregate principal amount of the 0.00% Convertible Senior Notes we issued in November 2013 (Notes). In addition, our charter documents do not permit cumulative voting, which may make it more difficult for a third-party to gain control of our Board. Further, we are subject to the anti-takeover provisions of Section 203 of the Delaware General Corporation Law, which will prohibit us from engaging in a business combination with an interested stockholder for a period of three years after the date of the transaction in which the person became an interested stockholder, even if such combination is favored by a majority of stockholders, unless the business combination is approved in a prescribed manner. The application of Section 203 also could have the effect of delaying or preventing a change in control of us.
Any of these provisions could, under certain circumstances, depress the market price of our common stock and the Notes.
Risks Relating to the Notes
The conditional conversion feature of the Notes, if triggered, may adversely affect our financial condition and operating results.
In the event the conditional conversion feature of the Notes is triggered, holders of Notes will be entitled to convert the Notes at any time during specified periods at their option. If one or more holders elect to convert their Notes, unless we elect to satisfy our conversion obligation by delivering solely shares of our common stock (other than paying cash in lieu of delivering any fractional share), we would be required to settle a portion or all of our conversion obligation through the payment of cash, which could adversely affect our liquidity. In addition, even if holders do not elect to convert their Notes, we could be required under applicable accounting rules to reclassify all or a portion of the outstanding principal of the Notes as a current rather than long-term liability, which would result in a material reduction of our net working capital.
We may not have the ability to raise the funds necessary to settle conversions of the Notes in cash or to repurchase the Notes upon a fundamental change, and our future debt may contain limitations on our ability to pay cash upon conversion or repurchase of the Notes.
Holders of the Notes will have the right to require us to repurchase all or a portion of their Notes upon the occurrence of a fundamental change at a repurchase price equal to 100% of the principal amount of the Notes to be repurchased, plus accrued and unpaid special interest, if any. We may not have enough available cash or be able to obtain financing at the time we are required to make repurchases of Notes surrendered therefore, or pay cash with respect to Notes being converted if we elect not to issue shares, which could harm our reputation and affect the trading price of our common stock.
The note hedge and warrant transactions may affect the value of the Notes and our common stock.
In connection with the pricing of the Notes, we entered into note hedge transactions with the option counterparties. The note hedge transactions are generally expected to reduce the potential dilution upon conversion of the Notes and/or offset any cash payments we are required to make in excess of the principal
29
amount of converted Notes, as the case may be. We also entered into warrant transactions with the option counterparties. However, the warrant transactions could separately have a dilutive effect to the extent that the market price per share of our common stock exceeds the applicable strike price of the warrants.
In connection with establishing their initial hedge of the note hedge and warrant transactions, the option counterparties or their respective affiliates have purchased shares of our common stock and/or entered into various derivative transactions with respect to our common stock concurrently with or shortly after the pricing of the Notes. In addition, the option counterparties or their respective affiliates may modify their hedge positions by entering into or unwinding various derivatives with respect to our common stock and/or purchasing or selling our common stock or other securities of ours in secondary market transactions prior to the maturity of the Notes (and are likely to do so during any observation period related to a conversion of Notes or following any repurchase of Notes by us on any fundamental repurchase date or otherwise). This activity could cause or avoid an increase or a decrease in the market price of our common stock or the Notes.
Any adverse change in the rating of the Notes may cause their trading price to decline.
While we did not seek a rating on the Notes, one rating service has rated the Notes. If that rating service announces its intention to put the Notes on credit watch or lowers its rating on the Notes below any rating initially assigned to the Notes, the trading price of the Notes could decline.
The accounting method for convertible debt securities that may be settled in cash, such as the Notes, could have a material effect on our reported financial results.
In May 2008, the Financial Accounting Standards Board, which we refer to as FASB, issued FASB Staff Position No. APB 14-1, Accounting for Convertible Debt Instruments That May Be Settled in Cash Upon Conversion (Including Partial Cash Settlement), which has subsequently been codified as Accounting Standards Codification 470-20, Debt with Conversion and Other Options, which we refer to as ASC 470-20. Under ASC 470-20, an entity must separately account for the liability and equity components of the convertible debt instruments (such as the Notes) that may be settled entirely or partially in cash upon conversion in a manner that reflects the issuers economic interest cost. The effect of ASC 470-20 on the accounting for the Notes is that the equity component is required to be included in the additional paid-in capital section of stockholders equity on our consolidated balance sheet, and the value of the equity component would be treated as debt discount for purposes of accounting for the debt component of the Notes. As a result, we will be required to record a greater amount of non-cash interest expense in current periods presented as a result of the amortization of the discounted carrying value of the Notes to their face amount over the term of the Notes. We will report lower net income in our financial results because ASC 470-20 will require interest to include the current periods amortization of the debt discount, which could adversely affect our reported or future financial results, the trading price of our common stock and the trading price of the Notes.
In addition, under certain circumstances, convertible debt instruments (such as the Notes) that may be settled entirely or partly in cash are currently accounted for utilizing the treasury stock method, the effect of which is that the shares issuable upon conversion of the Notes are not included in the calculation of diluted earnings per share except to the extent that the conversion value of the Notes exceeds their principal amount. Under the treasury stock method, for diluted earnings per share purposes, the transaction is accounted for as if the number of shares of common stock that would be necessary to settle such excess, if we elected to settle such excess in shares, are issued. We cannot be sure that the accounting standards in the future will continue to permit the use of the treasury stock method. If we are unable to use the treasury stock method in accounting for the shares issuable upon conversion of the Notes, then our diluted earnings per share would be adversely affected.
| Item 1B. | Unresolved Staff Comments |
None.
30
| Item 2. | Properties |
Our headquarters is located in Sunnyvale, California and consists of owned space aggregating approximately one million square feet. We also lease office space in Argentina, Australia, Brazil, Canada, China, France, Germany, Hong Kong, Hungary, India, Indonesia, Ireland, Israel, Italy, Japan, Jordan, Malaysia, Mexico, the Netherlands, New Zealand, Norway, the Philippines, South Korea, Singapore, Spain, Switzerland, Taiwan, the United Arab Emirates, the United Kingdom, and Vietnam. In the United States, we lease offices in various locations, including Atlanta, Boston, Champaign, Chicago, Dallas, Detroit, Hillsboro, the Los Angeles Area, Miami, New York, Omaha, San Diego, San Francisco, and Washington, D.C. Our data centers are operated in locations in the United States, Brazil, Europe, and Asia.
We believe that our existing facilities are adequate to meet current requirements, and that suitable additional or substitute space will be available as needed to accommodate any further physical expansion of operations and for any additional sales offices.
| Item 3. | Legal Proceedings |
For a description of our material legal proceedings, see Legal Contingencies in Note 12Commitments and Contingencies in the Notes to our consolidated financial statements, which is incorporated herein by reference.
| Item 4. | Mine Safety Disclosures |
Not applicable.
31
Part II
| Item 5. | Market for Registrants Common Equity, Related Stockholder Matters and Issuer Purchases of Equity Securities |
Market Information for Common Stock
Yahoo! Inc. common stock is quoted on the NASDAQ Global Select Market under the symbol YAHOO. The following table sets forth the range of high and low per share sales prices as reported for each period indicated:
| 2012 | 2013 | |||||||||||||||
| High | Low | High | Low | |||||||||||||
| First quarter |
$ | 16.39 | $ | 14.35 | $ | 23.88 | $ | 18.89 | ||||||||
| Second quarter |
$ | 16.35 | $ | 14.73 | $ | 27.68 | $ | 22.70 | ||||||||
| Third quarter |
$ | 16.37 | $ | 14.59 | $ | 33.85 | $ | 24.82 | ||||||||
| Fourth quarter |
$ | 19.97 | $ | 15.65 | $ | 41.05 | $ | 31.70 | ||||||||
Stockholders
We had 9,551 stockholders of record as of February 14, 2014.
Dividends
We have not declared or paid any cash dividends on our common stock. We presently do not have plans to pay any cash dividends in the near future.
Issuer Repurchases of Equity Securities
Share repurchase activity during the three months ended December 31, 2013 was as follows:
| Period |
Total Number of Shares Purchased(*) |
Average Price Paid per Share |
Total Number of Shares Purchased as Part of a Publicly Announced Program |
Approximate Dollar Value of Shares that May Yet be Purchased Under the Program (in 000s)(*) |
||||||||||||
| October 1October 31, 2013 |
927,886 | $ | 33.46 | 927,886 | $ | 293,338 | ||||||||||
| November 1November 30, 2013 |
2,969,629 | $ | 35.22 | 2,969,629 | $ | 5,188,754 | ||||||||||
| December 1December 31, 2013 |
2,453,458 | $ | 38.98 | 2,453,458 | $ | 5,093,110 | ||||||||||
|
|
|
|
|
|||||||||||||
| Total |
6,350,973 | $ | 36.42 | 6,350,973 | ||||||||||||
|
|
|
|
|
|||||||||||||
| (*) | The share repurchases in the three months ended December 31, 2013 were made under our stock repurchase program announced in May 2012, which authorizes the repurchase of up to $5 billion of our outstanding shares of common stock from time to time. This program, according to its terms, will expire in June 2015. In November 2013, our Board of Directors authorized an additional stock repurchase program with an authorized level of $5 billion. The November 2013 program, according to its terms, will expire in December 2016. No purchases were made under the November 2013 program during the three months ended December 31, 2013. Repurchases under the programs may take place in the open market or in privately negotiated transactions, including derivative transactions, and may be made under a Rule 10b5-1 plan. |
See Part II, Item 7 Managements Discussion and Analysis of Financial Condition and Results of Operations of this Annual Report on Form 10-K for additional information regarding share repurchases. See also Note 13Stockholders Equity in the Notes to our consolidated financial statements for additional information.
32
Recent Sales of Unregistered Securities
Convertible Senior Notes
On November 26, 2013, we completed an offering of $1.25 billion aggregate principal amount of our 0.00% Convertible Senior Notes due 2018 (the Notes). We sold the Notes under a purchase agreement, dated November 20, 2013, with J.P. Morgan Securities LLC and Goldman, Sachs & Co., as representatives of the several initial purchasers named therein (collectively, the Initial Purchasers). We sold the Notes to the Initial Purchasers in a private placement for resale to qualified institutional buyers pursuant to Rule 144A under the Securities Act of 1933, as amended (the Securities Act). We also granted the Initial Purchasers a 30-day over-allotment option to purchase additional Notes. On December 11, 2013 such option was exercised in full and accordingly, on December 16, 2013, we sold an additional $187.5 million aggregate principal amount of Notes to the Initial Purchasers on the same terms and conditions. All of the Notes were issued under an indenture (the Indenture) dated November 26, 2013 between us and The Bank of New York Mellon Trust Company, N.A., as trustee. We do not intend to file a shelf registration statement for the resale of the Notes or any common stock issuable upon conversion of the Notes.
The net proceeds from our sales of the Notes were approximately $1.4 billion, after deducting the Initial Purchasers discount and the offering expenses payable by us.
Under the Indenture, the Notes are senior unsecured obligations of Yahoo! Inc., the Notes will not bear regular interest, and the principal amount of the Notes will not accrete. The Notes will mature on December 1, 2018, unless previously purchased or converted in accordance with their terms. The Notes are not redeemable prior to maturity, and no sinking fund is provided for the Notes.
The Notes will be convertible into shares of our common stock at an initial conversion rate of 18.7161 shares per $1,000 principal amount of Notes (which is equivalent to an initial conversion price of approximately $53.43 per share), subject to adjustment upon the occurrence of certain events. The initial conversion price represents a premium of approximately 50% to the $35.62 per share closing price of our common stock on November 20, 2013 (the date we entered into the purchase agreement). Upon conversion of the Notes, holders will receive cash, shares of our common stock, or a combination thereof, at our election.
Prior to September 1, 2018, the Notes will be convertible only upon the occurrence of certain events and during certain periods, and thereafter, at any time until the close of business on the second scheduled trading day immediately preceding the maturity date of the Notes. The conversion rate is subject to customary anti-dilution adjustments. Following certain corporate events described in the Indenture that occur prior to the maturity date, the conversion rate will be increased for a holder who elects to convert its Notes in connection with such corporate event in certain circumstances.
Note Hedge and Warrant Transactions
On November 20, 2013 and December 11, 2013, in connection with our issuances of the Notes, we entered into note hedge transactions with the Initial Purchasers (in such capacity, the Option Counterparties) to reduce the potential dilution with respect to our common stock upon conversion of the Notes or to offset any cash payment we are required to make in excess of the principal amount of converted Notes.
In these transactions, we paid $206 million for call options giving us the right to purchase from the Option Counterparties, subject to customary anti-dilution adjustments, approximately 26.9 million shares of Yahoos common stock (which is equal to the number of shares that initially underlie the Notes), with a strike price of approximately $53.43 per share. The Option Counterparties or their respective affiliates may enter into, or unwind, various over-the-counter derivatives and/or purchase or sell our common stock in open market and/or privately negotiated transactions prior to maturity of the Notes, including during any observation period for the settlement of conversions of Notes, or upon any repurchase of Notes by us, which could adversely impact the price of our common stock and of the Notes.
33
Separately, we sold warrants to the Option Counterparties for $125 million giving them the right to purchase from us, subject to customary anti-dilution adjustments, approximately 26.9 million shares of Yahoos common stock, with a strike price of $71.24 per share. We sold the warrants to the Option Counterparties in a private placement under Section 4(a)(2) of the Securities Act. The warrants will have a dilutive effect with respect to our common stock to the extent that the market price per share of our common stock exceeds the strike price of the warrants on or prior to the expiration date of the warrants.
Acquisition of Aviate
On December 23, 2013, we entered into a stock purchase agreement to acquire ThumbsUp Labs, Inc. (Aviate). The acquisition closed on December 24, 2013. As a part of the acquisition, we agreed to issue 277,284 shares of Yahoo common stock (valued at approximately $11 million) to key employees of Aviate in private placements under Section 4(a)(2) of the Securities Act. One-fourth of the shares will be issued on the first anniversary of the closing of the acquisition, and the remaining shares will be issued in 36 equal monthly installments thereafter, subject to each recipients continued employment with Yahoo through the issuance date.
Performance Graph
This performance graph shall not be deemed filed for purposes of Section 18 of the Securities Exchange Act of 1934, as amended (the Exchange Act), or otherwise subject to the liabilities under that section and shall not be deemed to be incorporated by reference into any filing of Yahoo! Inc. under the Securities Act or the Exchange Act.
The following graph compares, for the five-year period ended December 31, 2013, the cumulative total stockholder return for Yahoos common stock, the NASDAQ 100 Index, the Standard & Poors North American Technology-Internet Index (the SPGIINTR), and the Standard & Poors 500 Stock Index (the S&P 500 Index). Measurement points are the last trading day of each of Yahoos fiscal years ended December 31, 2009, December 31, 2010, December 31, 2011, December 31, 2012, and December 31, 2013. The graph assumes that $100 was invested at the market close on December 31, 2008 in the common stock of Yahoo, the NASDAQ 100 Index, the SPGIINTR, and the S&P 500 Index and assumes reinvestment of any dividends. The stock price performance on the following graph is not necessarily indicative of future stock price performance.
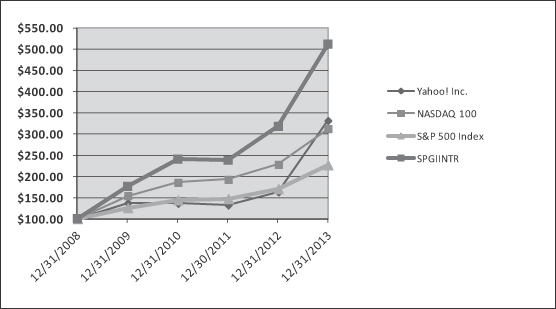
34
| Item 6. | Selected Financial Data |
The following selected consolidated financial data should be read in conjunction with the consolidated financial statements and notes thereto and Managements Discussion and Analysis of Financial Condition and Results of Operations appearing elsewhere in this Annual Report on Form 10-K. The consolidated statements of income data and the consolidated balance sheets data for the years ended, and as of, December 31, 2009, 2010, 2011, 2012, and 2013 are derived from our audited consolidated financial statements.
Consolidated Statements of Income Data:
| Years Ended December 31, | ||||||||||||||||||||
| 2009(3) | 2010(4) | 2011(5) | 2012(6) | 2013(7) | ||||||||||||||||
| (in thousands, except per share amounts) | ||||||||||||||||||||
| Revenue |
$ | 6,460,315 | $ | 6,324,651 | $ | 4,984,199 | $ | 4,986,566 | $ | 4,680,380 | ||||||||||
| Total operating expenses |
$ | 6,073,623 | $ | 5,552,127 | $ | 4,183,858 | $ | 4,420,198 | $ | 4,090,454 | ||||||||||
| Income from operations(1) |
$ | 386,692 | $ | 772,524 | $ | 800,341 | $ | 566,368 | $ | 589,926 | ||||||||||
| Other income, net(2) |
$ | 187,528 | $ | 297,869 | $ | 27,175 | $ | 4,647,839 | $ | 43,357 | ||||||||||
| Provision for income taxes |
$ | (219,321 | ) | $ | (221,523 | ) | $ | (241,767 | ) | $ | (1,940,043 | ) | $ | (153,392 | ) | |||||
| Earnings in equity interests |
$ | 250,390 | $ | 395,758 | $ | 476,920 | $ | 676,438 | $ | 896,675 | ||||||||||
| Net income attributable to Yahoo! Inc. |
$ | 597,992 | $ | 1,231,663 | $ | 1,048,827 | $ | 3,945,479 | $ | 1,366,281 | ||||||||||
|
|
|
|
|
|
|
|
|
|
|
|||||||||||
| Net income attributable to Yahoo! Inc. common stockholders per sharebasic |
$ | 0.43 | $ | 0.91 | $ | 0.82 | $ | 3.31 | $ | 1.30 | ||||||||||
|
|
|
|
|
|
|
|
|
|
|
|||||||||||
| Net income attributable to Yahoo! Inc. common stockholders per sharediluted |
$ | 0.42 | $ | 0.90 | $ | 0.82 | $ | 3.28 | $ | 1.26 | ||||||||||
|
|
|
|
|
|
|
|
|
|
|
|||||||||||
| Shares used in per share calculationbasic |
1,397,652 | 1,354,118 | 1,274,240 | 1,192,775 | 1,052,705 | |||||||||||||||
|
|
|
|
|
|
|
|
|
|
|
|||||||||||
| Shares used in per share calculationdiluted |
1,415,658 | 1,364,612 | 1,282,282 | 1,202,906 | 1,070,811 | |||||||||||||||
|
|
|
|
|
|
|
|
|
|
|
|||||||||||
|
(1) Includes: |
||||||||||||||||||||
| Stock-based compensation expense |
$ | 438,087 | $ | 223,478 | $ | 203,958 | $ | 224,365 | $ | 278,220 | ||||||||||
| Restructuring charges, net |
$ | 126,901 | $ | 57,957 | $ | 24,420 | $ | 236,170 | $ | 3,766 | ||||||||||
|
(2) Includes: |
||||||||||||||||||||
| Gain related to sale of Alibaba Group Shares |
$ | | $ | | $ | | $ | 4,603,322 | $ | | ||||||||||
| (3) | Our net income attributable to Yahoo! Inc. for the year ended December 31, 2009 included a pre-tax gain of $67 million in connection with the sale of our Gmarket shares and a gain on the sale of our direct investment in Alibaba.com of $98 million. In addition, in the year ended December 31, 2009, we recorded net restructuring charges of $127 million related to our cost reduction initiatives. The tax impact on the items referred to above was $20 million, and in the aggregate, these items had a net positive impact of $18 million on net income attributable to Yahoo! Inc., or $0.01 per both basic and diluted share, for the year ended December 31, 2009. |
| (4) | Our revenue declined in 2010 due to the Search Agreement with Microsoft, which beginning during the fourth quarter of 2010 required a change in revenue presentation and a sharing of search revenue with Microsoft in transitioned markets. Our net income attributable to Yahoo! Inc. for the year ended December 31, 2010 included a pre-tax gain of $66 million in connection with the sale of Zimbra, Inc. and a pre-tax gain on the sale of HotJobs of $186 million. In addition, in the year ended December 31, 2010, we recorded net restructuring charges of $58 million related to our cost reduction initiatives. Apart from the Search Agreement, the tax impact on the items referred to above was a $10 million benefit, and in the aggregate, these items had a net positive impact of $204 million on net income attributable to Yahoo! Inc., or $0.15 per both basic and diluted share, for the year ended December 31, 2010. In addition, in the year ended |
35
| December 31, 2010, we recorded $43 million pre-tax for the reimbursement of transition costs incurred in 2009 related to the Search Agreement. See Note 19Search Agreement with Microsoft Corporation in the Notes to our consolidated financial statements for additional information. |
| (5) | Our revenue declined in 2011 due to the Search Agreement with Microsoft, which beginning during the fourth quarter of 2010 required a change in revenue presentation and a sharing of search revenue with Microsoft in transitioned markets. Our net income attributable to Yahoo! Inc. for the year ended December 31, 2011 included a non-cash gain of $25 million, net of tax, related to the dilution of our ownership interest in Alibaba Group and a non-cash loss of $33 million related to impairments of assets held by Yahoo Japan. In addition, in the year ended December 31, 2011, we recorded net restructuring charges of $24 million related to our cost reduction initiatives. Apart from the Search Agreement, the tax impact on the items referred to above was an $8 million benefit, and these items had a net negative impact of $24 million on net income attributable to Yahoo! Inc., or $0.02 per both basic and diluted share, for the year ended December 31, 2011. |
| (6) | Our net income attributable to Yahoo! Inc. for the year ended December 31, 2012 included a pre-tax gain of approximately $4.6 billion and an after-tax gain of $2.8 billion related to our sale to Alibaba Group of 523 million ordinary shares of Alibaba Group (Shares). See Note 8Investments in Equity Interests in the Notes to our consolidated financial statements for additional information. In addition, in the year ended December 31, 2012, we recorded net restructuring charges of $236 million related to our cost reduction initiatives. In the aggregate, these items had a net positive impact of $2.6 billion on net income attributable to Yahoo! Inc., or $2.15 per basic share and $2.13 per diluted share, for the year ended December 31, 2012. |
| (7) | Our net income attributable to Yahoo! Inc. for the year ended December 31, 2013 included pre-tax gains of approximately $80 million related to sales of patents and a goodwill impairment charge of $64 million. In the year ended December 31, 2013, we recorded net restructuring charges of $4 million related to our cost reduction initiatives. The tax impact on the items referred to above was $22 million, and in the aggregate, these items had a net negative impact of $10 million on net income attributable to Yahoo! Inc., or $0.01 per both basic and diluted share, for the year ended December 31, 2013. |
Consolidated Balance Sheets Data:
| December 31, | ||||||||||||||||||||
| 2009 | 2010 | 2011 | 2012(1) | 2013(2) | ||||||||||||||||
| (In thousands) | ||||||||||||||||||||
| Cash and cash equivalents |
$ | 1,275,430 | $ | 1,526,427 | $ | 1,562,390 | $ | 2,667,778 | $ | 2,077,590 | ||||||||||
| Marketable securities |
$ | 3,242,574 | $ | 2,102,255 | $ | 967,527 | $ | 3,354,600 | $ | 2,919,804 | ||||||||||
| Alibaba Group Preference Shares |
$ | | $ | | $ | | $ | 816,261 | $ | | ||||||||||
| Working capital |
$ | 2,877,044 | $ | 2,719,676 | $ | 2,245,175 | $ | 4,362,481 | $ | 3,685,545 | ||||||||||
| Investments in equity interests |
$ | 3,496,288 | $ | 4,011,889 | $ | 4,749,044 | $ | 2,840,157 | $ | 3,426,347 | ||||||||||
| Total assets |
$ | 14,936,030 | $ | 14,928,104 | $ | 14,782,786 | $ | 17,103,253 | $ | 16,804,959 | ||||||||||
| Long-term liabilities |
$ | 699,666 | $ | 705,822 | $ | 994,078 | $ | 1,207,418 | $ | 2,334,050 | ||||||||||
| Total Yahoo! Inc. stockholders equity |
$ | 12,493,320 | $ | 12,558,129 | $ | 12,541,067 | $ | 14,560,200 | $ | 13,074,909 | ||||||||||
| (1) | During the year ended December 31, 2012, we received $13.54 per Share, or approximately $7.1 billion in total consideration, for the 523 million Shares we sold back to Alibaba Group. Approximately $6.3 billion of the consideration was received in cash and $800 million was received in Alibaba Group Preference Shares. We paid cash taxes of $2.3 billion related to the transaction. See Note 8Investments in Equity Interests in the Notes to our consolidated financial statements for additional information. |
| (2) | During the year ended December 31, 2013, we received net proceeds of $1.4 billion from the issuance of the Notes. See Note 11Convertible Notes in the Notes to our consolidated financial statements for additional information. |
36
| Item 7. | Managements Discussion and Analysis of Financial Condition and Results of Operations |
Forward-Looking Statements
In addition to current and historical information, this Annual Report on Form 10-K contains forward-looking statements within the meaning of the Private Securities Litigation Reform Act of 1995. These statements relate to our future operations, prospects, potential products, services, developments, and business strategies. These statements can, in some cases, be identified by the use of terms such as may, will, should, could, would, intend, expect, plan, anticipate, believe, estimate, predict, project, potential, or continue, the negative of such terms, or other comparable terminology. This Annual Report on Form 10-K includes, among others, forward-looking statements regarding our:
| | expectations about revenue, including display, search, and other revenue; |
| | expectations about growth in users; |
| | expectations about changes in our earnings in equity interests; |
| | expectations about changes in operating expenses; |
| | anticipated capital expenditures; |
| | expectations about our share repurchase activity; |
| | expectations about the financial and operational impacts of our Search Agreement with Microsoft; |
| | impact of recent acquisitions on our business and evaluation of, and expectations for, possible acquisitions of, or investments in, businesses, products, intangible assets and technologies; |
| | expectations about the growth of, and the opportunities for monetization in, the mobile industry; |
| | projections and estimates with respect to our restructuring activities and changes to our organizational structure; |
| | expectations about the amount of unrecognized tax benefits, the outcome of tax assessment appeals, the adequacy of our existing tax reserves, future tax expenditures, and tax rates; |
| | expectations about positive cash flow generation and existing cash, cash equivalents, and investments being sufficient to meet normal operating requirements; and |
| | expectations regarding the outcome of legal proceedings in which we are involved, including the outcome of our efforts to sustain the reversal of judgment entered against us and one of our subsidiaries in a proceeding in Mexico. |
These statements involve certain known and unknown risks and uncertainties that could cause our actual results to differ materially from those expressed or implied in our forward-looking statements. You are urged to carefully review the disclosures made concerning risks and uncertainties that may affect our business or operating results, which include, among others, those listed in Part 1, Item 1A Risk Factors of this Annual Report on Form 10-K. We do not intend, and undertake no obligation, to update or revise any of our forward-looking statements after the date of this Annual Report on Form 10-K to reflect new information, actual results or future events or circumstances.
Overview
Yahoo! Inc., together with its consolidated subsidiaries (Yahoo, the Company, we, or us) is a global technology company focused on making the worlds daily habits inspiring and entertaining. Our mission is driven by our commitment to creating highly personalized experiences that reach our users wherever they might beon their mobile phone, tablet or desktop. Our more than 800 million monthly users connect to the things that matter most to them with beautiful, engaging experiences across Search, Communications, Digital Magazines and Videosome of which will be powered by Flickr and Tumblr.
37
We create value for advertisers with a streamlined, simplified advertising technology stack that leverages Yahoos data, reach and analytics to connect advertisers with their target audiences. For advertisers, the opportunity to be a part of users daily habits across products and platforms is a powerful tool to engage audiences and build brand loyalty.
Advertisers can build their businesses through advertising to targeted audiences on our online properties and services (Yahoo Properties) or through a distribution network of third party entities (Affiliates) who integrate our advertising offerings into their Websites or other offerings (Affiliate sites; together with Yahoo Properties, the Yahoo Network). Our revenue is generated principally from display and search advertising.
We continue to manage and measure our business geographically, principally in the Americas, EMEA (Europe, Middle East, and Africa) and Asia Pacific.
In the following Managements Discussion and Analysis, we provide information regarding the following areas:
| | Key Financial Metrics; |
| | Non-GAAP Financial Measures; |
| | Significant Transactions; |
| | Results of Operations; |
| | Liquidity and Capital Resources; |
| | Critical Accounting Policies and Estimates; and |
| | Recent Accounting Pronouncements. |
Key Financial Metrics
The key financial metrics we use are as follows: revenue; revenue less traffic acquisition costs (TAC), or revenue ex-TAC; income from operations; adjusted EBITDA; net income attributable to Yahoo! Inc.; net cash provided by (used in) operating activities; and free cash flow. Revenue ex-TAC, adjusted EBITDA and free cash flow are financial measures that are not defined in accordance with U.S. generally accepted accounting principles (GAAP). We use these non-GAAP financial measures for internal managerial purposes and to facilitate period-to-period comparisons. See Non-GAAP Financial Measures below for a description of, and limitations specific to, each of these non-GAAP financial measures.
| Years Ended December 31, | ||||||||||||
| 2011 | 2012 | 2013 | ||||||||||
| (dollars in thousands) | ||||||||||||
| Revenue |
$ | 4,984,199 | $ | 4,986,566 | $ | 4,680,380 | ||||||
| Revenue ex-TAC |
$ | 4,380,828 | $ | 4,467,660 | $ | 4,425,938 | ||||||
| Income from operations(1) |
$ | 800,341 | $ | 566,368 | $ | 589,926 | ||||||
| Adjusted EBITDA |
$ | 1,654,583 | $ | 1,698,727 | $ | 1,564,245 | ||||||
| Net income attributable to Yahoo! Inc |
$ | 1,048,827 | $ | 3,945,479 | $ | 1,366,281 | ||||||
| Net cash provided by (used in) operating activities |
$ | 1,323,806 | $ | (281,554 | ) | $ | 1,195,247 | |||||
| Free cash flow(2) |
$ | 725,801 | $ | (834,865 | ) | $ | 786,465 | |||||
|
(1) Includes: |
||||||||||||
| Stock-based compensation expense |
$ | 203,958 | $ | 224,365 | $ | 278,220 | ||||||
| Restructuring charges, net |
$ | 24,420 | $ | 236,170 | $ | 3,766 | ||||||
| (2) | Excluding the impact of the cash taxes paid of $2.3 billion related to the Initial Repurchase described under Significant Transactions below, free cash flow for the year ended December 31, 2012 would have been $1.4 billion. |
38
Revenue ex-TAC (a non-GAAP financial measure)
| Years Ended December 31, | 2011-2012 % Change |
2012-2013 % Change |
||||||||||||||||||
| 2011 | 2012 | 2013 | ||||||||||||||||||
| (dollars in thousands) | ||||||||||||||||||||
| Revenue |
$ | 4,984,199 | $ | 4,986,566 | $ | 4,680,380 | | (6 | )% | |||||||||||
| Less: TAC |
603,371 | 518,906 | 254,442 | (14)% | (51 | )% | ||||||||||||||
|
|
|
|
|
|
|
|||||||||||||||
| Revenue ex-TAC |
$ | 4,380,828 | $ | 4,467,660 | $ | 4,425,938 | 2% | (1 | )% | |||||||||||
|
|
|
|
|
|
|
|||||||||||||||
For the year ended December 31, 2013, revenue ex-TAC decreased $42 million, or 1 percent, due to a decrease in display revenue ex-TAC partially offset by an increase in search revenue ex-TAC and other revenue ex-TAC.
For the year ended December 31, 2012, revenue ex-TAC increased $87 million, or 2 percent, due to an increase in search revenue ex-TAC partially offset by a decline in display revenue ex-TAC.
Adjusted EBITDA (a non-GAAP financial measure)
| Years Ended December 31, | 2011-2012 % Change |
2012-2013 % Change |
||||||||||||||||||
| 2011 | 2012 | 2013 | ||||||||||||||||||
| (dollars in thousands) | ||||||||||||||||||||
| Net income attributable to Yahoo! Inc. |
$ | 1,048,827 | $ | 3,945,479 | $ | 1,366,281 | N/M | (65)% | ||||||||||||
| Costs associated with the Korea business and its closure |
| 99,485 | | 100% | (100)% | |||||||||||||||
| Deal-related costs related to the sale of Alibaba Group shares |
| 6,500 | | 100% | (100)% | |||||||||||||||
| Depreciation and amortization |
625,864 | 649,267 | 628,778 |
|
4% |
|
(3)% | |||||||||||||
| Stock-based compensation expense |
203,958 | 224,365 | 278,220 | 10% | 24% | |||||||||||||||
| Goodwill impairment charge |
| | 63,555 | | 100% | |||||||||||||||
| Restructuring charges, net, as adjusted(1) |
24,420 | 152,742 | 3,766 | N/M | (98)% | |||||||||||||||
| Other income, net |
(27,175 | ) | (4,647,839 | ) | (43,357 | ) | N/M | N/M | ||||||||||||
| Provision for income taxes |
241,767 | 1,940,043 | 153,392 | N/M | N/M | |||||||||||||||
| Earnings in equity interests |
(476,920 | ) | (676,438 | ) | (896,675 | ) | 42% | 33% | ||||||||||||
| Net income attributable to noncontrolling interests |
13,842 | 5,123 | 10,285 | (63)% | 101% | |||||||||||||||
|
|
|
|
|
|
|
|||||||||||||||
| Adjusted EBITDA |
$ | 1,654,583 | $ | 1,698,727 | $ | 1,564,245 | 3% | (8)% | ||||||||||||
|
|
|
|
|
|
|
|||||||||||||||
| Percentage of revenue ex-TAC(2)(3) |
38% | 38% | 35% | |||||||||||||||||
|
|
|
|
|
|
|
|||||||||||||||
N/M = Not Meaningful
| (1) | For the year ended December 31, 2012, this amount excludes the restructuring charges of $83 million related to the Korea business and its closure, which charges are included in costs associated with the Korea business and its closure. |
| (2) | Revenue ex-TAC is calculated as GAAP revenue less TAC. |
| (3) | Net income attributable to Yahoo! Inc. as a percentage of GAAP revenue in 2011, 2012, and 2013 was 21 percent, 79 percent, and 29 percent, respectively. |
For the year ended December 31, 2013, adjusted EBITDA decreased $134 million, or 8 percent, compared to 2012, mainly due to a decline in revenue ex-TAC and an increase in global operating costs.
39
For the year ended December 31, 2012, adjusted EBITDA increased $44 million, or 3 percent, compared to 2011. Excluding the impact of the Initial Repurchase described under Significant Transactions below, such increase was primarily attributable to increased revenue in the Americas region and a decline in TAC in the EMEA region.
Free Cash Flow (a non-GAAP financial measure)
| Years Ended December 31, | ||||||||||||
| 2011 | 2012 | 2013 | ||||||||||
| (dollars in thousands) | ||||||||||||
| Net cash provided by (used in) operating activities |
$ | 1,323,806 | $ | (281,554 | ) | $ | 1,195,247 | |||||
| Acquisition of property and equipment, net |
(593,294 | ) | (505,507 | ) | (338,131 | ) | ||||||
| Dividends received from equity investees |
(75,391 | ) | (83,648 | ) | (135,058 | ) | ||||||
| Excess tax benefits from stock-based awards |
70,680 | 35,844 | 64,407 | |||||||||
|
|
|
|
|
|
|
|||||||
| Free cash flow(*) |
$ | 725,801 | $ | (834,865 | ) | $ | 786,465 | |||||
|
|
|
|
|
|
|
|||||||
| (*) | Excluding the impact of the cash taxes paid of $2.3 billion related to the Initial Repurchase described under Significant Transactions below, free cash flow for the year ended December 31, 2012 would have been $1.4 billion. |
For the year ended December 31, 2013, free cash flow increased $1.6 billion, compared to 2012. Excluding the impact of the cash taxes paid in 2012 of $2.3 billion related to the Initial Repurchase described under Significant Transactions below, free cash flow decreased $645 million in 2013, compared to 2012. The decline was primarily due to an upfront payment of $550 million we received in 2012 from Alibaba Group Holding Limited (the Alibaba Group) in satisfaction of certain future royalty payments under the existing technology and intellectual property license agreement with Alibaba Group (the TIPLA), for which there were no similar payments in 2013. This was partially offset by a decrease in capital expenditures.
For the year ended December 31, 2012, free cash flow decreased $1.6 billion, compared to 2011. Excluding the impact of the cash taxes paid of $2.3 billion related to the Initial Repurchase described under Significant Transactions below, free cash flow increased $705 million primarily due to the upfront payment of $550 million from Alibaba Group in 2012 described above.
Non-GAAP Financial Measures
Revenue ex-TAC. Revenue ex-TAC is a non-GAAP financial measure defined as GAAP revenue less traffic acquisition costs (TAC). TAC consists of payments made to Affiliates that have integrated our advertising offerings into their sites and payments made to companies that direct consumer and business traffic to Yahoo Properties. Based on the terms of the Search Agreement with Microsoft described under Significant Transactions below, Microsoft retains a revenue share of 12 percent of the net (after TAC) search revenue generated on Yahoo Properties and Affiliate sites in transitioned markets. We report the net revenue we receive under the Search Agreement as revenue and no longer present the associated TAC. Accordingly, for transitioned markets we report GAAP revenue associated with the Search Agreement on a net (after TAC) basis rather than a gross basis. For markets that had not yet transitioned, revenue continued to be recorded on a gross (before TAC) basis, and TAC is recorded as a part of operating expenses.
We present revenue ex-TAC to provide investors a metric used by us for evaluation and decision-making purposes during the Microsoft transition and to provide investors with comparable revenue numbers when comparing periods preceding, during and following the transition period. A limitation of revenue ex-TAC is that it is a measure which we have defined for internal and investor purposes that may be unique to us, and therefore it may not enhance the comparability of our results to other companies in our industry who have similar business
40
arrangements but address the impact of TAC differently. Management compensates for these limitations by also relying on the comparable GAAP financial measures of revenue and total operating expenses, which include TAC in non-transitioned markets.
Adjusted EBITDA. Adjusted EBITDA is a non-GAAP financial measure defined as net income attributable to Yahoo! Inc. before taxes, depreciation, amortization of intangible assets, stock-based compensation expense, other income, net (which includes interest), earnings in equity interests, net income attributable to noncontrolling interests, and certain gains, losses, and expenses that we do not believe are indicative of our ongoing results.
We present adjusted EBITDA because the exclusion of certain gains, losses, and expenses facilitates comparisons of the operating performance of our Company on a period to period basis. Adjusted EBITDA has limitations as an analytical tool and should not be considered in isolation or as a substitute for results reported under GAAP. These limitations include: adjusted EBITDA does not reflect tax payments and such payments reflect a reduction in cash available to us; adjusted EBITDA does not reflect the periodic costs of certain capitalized tangible and intangible assets used in generating revenues in our businesses; adjusted EBITDA does not include stock-based compensation expense related to our workforce; adjusted EBITDA also excludes other income, net (which includes interest), earnings in equity interests, net income attributable to noncontrolling interests and certain gains, losses, and expenses that we do not believe are indicative of our ongoing results, and these items may represent a reduction or increase in cash available to us. Adjusted EBITDA is a measure that may be unique to us, and therefore it may not enhance the comparability of our results to other companies in our industry. Management compensates for these limitations by also relying on the comparable GAAP financial measure of net income attributable to Yahoo! Inc., which includes taxes, depreciation, amortization, stock-based compensation expense, other income, net (which includes interest), earnings in equity interests, net income attributable to noncontrolling interests and the other gains, losses and expenses that are excluded from adjusted EBITDA.
Free Cash Flow. Free cash flow is a non-GAAP financial measure defined as net cash provided by (used in) operating activities (adjusted to include excess tax benefits from stock-based awards), less (i) acquisition of property and equipment, net and (ii) dividends received from equity investees.
We consider free cash flow to be a liquidity measure which provides useful information to management and investors about the amount of cash generated by the business after the acquisition of property and equipment, which can then be used for strategic opportunities including, among others, investing in our business, making strategic acquisitions, strengthening the balance sheet, and repurchasing stock. A limitation of free cash flow is that it does not represent the total increase or decrease in the cash balance for the period. Management compensates for the limitation of free cash flow by also relying on the net change in cash and cash equivalents as presented in our consolidated statements of cash flows prepared in accordance with GAAP which incorporates all cash movements during the period.
Significant Transactions
Acquisition of Tumblr
On June 19, 2013, we completed the acquisition of Tumblr, Inc. (Tumblr), a blog-hosting Website that allows users to post their own content as well as follow or re-blog posts made by other users. The acquisition of Tumblr brings a community of new users to the Yahoo Network. The total purchase price of approximately $990 million consisted mainly of cash consideration. See Note 4Acquisitions in the Notes to our consolidated financial statements for additional information.
Initial Repurchase of Alibaba Group Holding Limited Ordinary Shares
See Note 8Investments in Equity Interests in the Notes to our consolidated financial statements for information regarding the repurchase by Alibaba Group of 523 million of the 1,047 million ordinary shares of
41
Alibaba Group (the Shares) we owned at the time (the Initial Repurchase) pursuant to the terms of a Share Repurchase and Preference Share Sale Agreement (as amended on September 11, 2012 and October 14, 2013, the Repurchase Agreement).
In September 2012, we received net cash proceeds of approximately $4.3 billion after the payment of taxes and fees from the Initial Repurchase, which included the $550 million TIPLA payment. We returned $3.65 billion of these after-tax proceeds to shareholders.
In connection with the Initial Repurchase, we also received $800 million in Alibaba Group Preference Shares. On May 16, 2013, we received $846 million in cash from Alibaba Group to redeem the Alibaba Group Preference Shares. The cash received represented the redemption value, which included the stated value of $800 million plus accrued dividends of $46 million.
The Company, Yahoo! Hong Kong Holdings Limited (YHK) and Alibaba Group entered into a Second Amendment to the Share Repurchase and Preference Share Sale Agreement, dated as of October 14, 2013. The amendment reduced the maximum number of Shares of Alibaba Group that we are required to sell in connection with an initial public offering of Alibaba Group meeting certain specified criteria (a Qualified IPO) from 261.5 million Shares to 208.0 million Shares.
Convertible Senior Notes
In 2013, we completed the offering of $1.4375 billion aggregate principal amount of our 0.00% Convertible Senior Notes due in 2018 (the Notes). The Notes were sold in a private placement under a purchase agreement, dated November 20, 2013, that we entered into with J.P. Morgan Securities LLC and Goldman, Sachs & Co., as representatives of the several initial purchasers named therein (collectively, the Initial Purchasers), for resale to qualified institutional buyers pursuant to Rule 144A under the Securities Act of 1933, as amended (the Securities Act). In connection with the issuance of the Notes, we entered into note hedge transactions with the Initial Purchasers (in such capacity, the Option Counterparties) to reduce the potential dilution with respect to our common stock upon conversion of the Notes or offset any cash payment we would be required to make in excess of the principal amount of converted Notes. For the year ended December 31, 2013, we used $206 million to pay the cost of the privately negotiated note hedge transactions. Separately, we entered into privately negotiated warrant transactions with the Option Counterparties giving them the right to purchase Yahoo common stock from us. The warrant transactions will have a dilutive effect with respect to our common stock to the extent that the market price per share of our common stock exceeds the $71.24 strike price of the warrants on or prior to the expiration date of the warrants. For the year ended December 31, 2013, we received $125 million from the issuance of warrants.
Concurrent with the offering, we also used approximately $87.5 million of the net proceeds from the sale of the Notes to repurchase approximately 2.5 million shares of our common stock. We expect to use the remainder of the net proceeds from the sale of the Notes for general corporate purposes, including, but not limited to, acquisitions or other strategic transactions, additional repurchases of common stock and working capital. For additional information see Item 5Recent Sales of Unregistered Securities and Note 11Convertible Notes in the Notes to our consolidated financial statements.
Search Agreement with Microsoft Corporation
On December 4, 2009, we entered into a Search and Advertising Services and Sales Agreement, as amended, (the Search Agreement) with Microsoft Corporation (Microsoft), which provides for Microsoft to be the exclusive algorithmic and paid search services provider on Yahoo Properties and non-exclusive provider of such services on Affiliate sites. We also entered into a License Agreement with Microsoft pursuant to which Microsoft acquired an exclusive 10-year license to our core search technology that it will be able to integrate into its
42
existing Web search platforms. The global transition of our algorithmic and paid search platforms to Microsofts platform and the migration of paid search advertisers and publishers to Microsofts platform were to be done on a market by market basis.
During the first five years of the Search Agreement, in transitioned markets we are entitled to receive 88 percent of the revenue generated from Microsofts services on Yahoo Properties. We are also entitled to receive 88 percent of the revenue generated from Microsofts services on Affiliate sites after the Affiliates share of revenue. In the transitioned markets, for search revenue generated from Microsofts services on Yahoo Properties and Affiliate sites, we report as revenue the 88 percent revenue share, as we are not the primary obligor in the arrangement with the advertisers and publishers. The underlying search advertising services are provided by Microsoft. For new Affiliates during the term of the Search Agreement, and for all Affiliates after the first five years of such term, we will receive 88 percent of the revenue generated from Microsofts services on Affiliate sites after the Affiliates share of revenue and certain Microsoft costs are deducted. Under the Search Agreement, Yahoo is the exclusive worldwide relationship sales force for both companies premium search advertisers. On February 23, 2015 (the fifth anniversary of the date that implementation of the Search Agreement commenced), Microsoft will have the option to terminate our sales exclusivity for premium search advertisers. If Microsoft exercises its option, the revenue share rate will increase to 93 percent for the remainder of the term of the Search Agreement, unless we exercise our option to retain our sales exclusivity, in which case the revenue share rate would be reduced to 83 percent for the remainder of the term. If Microsoft does not exercise such option, the revenue share rate will be 90 percent for the remainder of the term of the Search Agreement.
The term of the Search Agreement is 10 years from February 23, 2010, subject to earlier termination as provided in the Search Agreement. Revenue under the Search Agreement represented approximately 20 percent, 25 percent, and 31 percent of our revenue for the years ended December 31, 2011, 2012 and, 2013, respectively.
Under the Search Agreement, for each market, Microsoft generally guarantees Yahoos revenue per search (RPS Guarantee) on Yahoo Properties only for 18 months after the transition of paid search services to Microsofts platform in that market. The RPS Guarantee is based on the difference in revenue per search between the pre-transition and post-transition periods and certain other factors. We record the RPS Guarantee as search revenue in the quarter the amount becomes fixed, which is typically the quarter in which the associated shortfall in revenue per search occurred. In the fourth quarter of 2011, Microsoft agreed to extend the RPS Guarantee in the U.S. and Canada through March 2013, and in the second quarter of 2013, Microsoft extended the RPS Guarantee in the U.S. through March 2014. In June 2013, Microsoft and we agreed upon the RPS Guarantee payment amounts to be paid to us for the quarters ended December 31, 2012, March 31, 2013 and June 30, 2013. We also agreed to fixed quarterly payments in lieu of the RPS Guarantee in the U.S. for the quarters ending September 30, 2013, December 31, 2013 and March 31, 2014. In addition, we agreed to waive our right to receive any future RPS Guarantee payments in all other markets except Taiwan and Hong Kong. We do not expect the remaining quarterly payment from Microsoft and any RPS Guarantee payments for Taiwan and Hong Kong to have a material impact on our expected future revenue.
Under the Search Agreement, Microsoft agreed to reimburse us for certain transition costs up to an aggregate total of $150 million during the first three years of the Search Agreement. During the third quarter of 2011, our cumulative transition costs exceeded Microsofts $150 million reimbursement cap under the Search Agreement. Transition costs we incurred in excess of the $150 million reimbursement cap were not subject to reimbursement. Our results for the year ended December 31, 2011 reflect the final transition cost reimbursements from Microsoft under the Search Agreement of $26 million.
We completed the transition of our algorithmic and paid search platforms to the Microsoft platform in the U.S. and Canada in the fourth quarter of 2010. In 2011, we completed the transition of algorithmic search in all other markets. By the end of 2012, we had completed the transition of paid search in India, most of the EMEA markets, and six markets in Latin America. By the end of 2013, we had substantially completed the transition of paid search, including the transition of paid search in Taiwan and Hong Kong.
43
From February 23, 2010 until the applicable services were fully transitioned to Microsoft in all markets, Microsoft was required under the Search Agreement to reimburse us for the costs of operating algorithmic and paid search services subject to specified exclusions and limitations. Our results reflect search operating cost reimbursements from Microsoft under the Search Agreement of $49 million, $67 million, and $212 million for the years ended December 31, 2013, 2012, and 2011, respectively.
We record receivables for the reimbursements as costs are incurred and apply them against the operating expense categories in which the costs were incurred. Of the total amounts incurred during the years ended December 31, 2012 and 2013, the total reimbursements not yet received from Microsoft of $5 million were classified as part of prepaid expenses and other current assets on our consolidated balance sheets as of December 31, 2012 and 2013.
See Note 19Search Agreement with Microsoft Corporation in the Notes to our consolidated financial statements for additional information.
Results of Operations
| Years Ended December 31, | 2011-2012 % Change |
2012-2013 % Change |
||||||||||||||||||
| 2011 | 2012 | 2013 | ||||||||||||||||||
| (dollars in thousands) | ||||||||||||||||||||
| Revenue for groups of similar services: |
||||||||||||||||||||
| Display |
||||||||||||||||||||
| Yahoo Properties |
$ | 1,998,312 | $ | 1,930,234 | $ | 1,744,130 | (3)% | (10) | % | |||||||||||
| Affiliate sites |
161,997 | 212,584 | 205,700 | 31% | (3) | % | ||||||||||||||
|
|
|
|
|
|
|
|||||||||||||||
| Total Display revenue |
$ | 2,160,309 | $ | 2,142,818 | $ | 1,949,830 | (1)% | (9) | % | |||||||||||
|
|
|
|
|
|
|
|||||||||||||||
| Search |
||||||||||||||||||||
| Yahoo Properties |
$ | 1,056,053 | $ | 1,206,209 | $ | 1,371,134 | 14% | 14 | % | |||||||||||
| Affiliate sites |
797,057 | 679,651 | 370,657 | (15)% | (45) | % | ||||||||||||||
|
|
|
|
|
|
|
|||||||||||||||
| Total Search revenue |
$ | 1,853,110 | $ | 1,885,860 | $ | 1,741,791 | 2% | (8) | % | |||||||||||
|
|
|
|
|
|
|
|||||||||||||||
| Other |
$ | 970,780 | $ | 957,888 | $ | 988,759 | (1)% | 3 | % | |||||||||||
|
|
|
|
|
|
|
|||||||||||||||
| Total revenue |
$ | 4,984,199 | $ | 4,986,566 | $ | 4,680,380 | | (6) | % | |||||||||||
| Cost of revenueTAC |
603,371 | 518,906 | 254,442 | (14)% | (51) | % | ||||||||||||||
| Cost of revenueother |
983,626 | 1,101,660 | 1,094,938 | 12% | (1) | % | ||||||||||||||
| Sales and marketing |
1,122,193 | 1,101,572 | 1,130,820 | (2)% | 3 | % | ||||||||||||||
| Product development |
919,368 | 885,824 | 1,008,487 | (4)% | 14 | % | ||||||||||||||
| General and administrative |
497,288 | 540,247 | 569,555 | 9% | 5 | % | ||||||||||||||
| Amortization of intangibles |
33,592 | 35,819 | 44,841 | 7% | 25 | % | ||||||||||||||
| Gains on sales of patents |
| | (79,950) | | 100 | % | ||||||||||||||
| Goodwill impairment charge |
| | 63,555 | | 100 | % | ||||||||||||||
| Restructuring charges, net |
24,420 | 236,170 | 3,766 | N/M | (98) | % | ||||||||||||||
|
|
|
|
|
|
|
|||||||||||||||
| Total operating expenses |
$ | 4,183,858 | $ | 4,420,198 | $ | 4,090,454 | 6% | (7) | % | |||||||||||
|
|
|
|
|
|
|
|||||||||||||||
| Income from operations |
$ | 800,341 | $ | 566,368 | $ | 589,926 | (29)% | 4 | % | |||||||||||
|
|
|
|
|
|
|
|||||||||||||||
| Includes: |
||||||||||||||||||||
| Stock-based compensation expense |
$ | 203,958 | $ | 224,365 | $ | 278,220 | 10% | 24 | % | |||||||||||
| Costs associated with the Korea business and its closure |
$ | | $ | 99,485 | $ | | 100% | (100) | % | |||||||||||
N/M = Not Meaningful
44
The following table sets forth selected information concerning our results of operations as a percentage of revenue for the period indicated:
| Years Ended December 31, | ||||||||||||
| 2011 | 2012 | 2013 | ||||||||||
| (dollars in thousands) | ||||||||||||
| Revenue for groups of similar services: |
||||||||||||
| Display |
||||||||||||
| Yahoo Properties |
40% | 39% | 37% | |||||||||
| Affiliate sites |
3% | 4% | 5% | |||||||||
|
|
|
|
|
|
|
|||||||
| Total Display revenue |
43% | 43% | 42% | |||||||||
|
|
|
|
|
|
|
|||||||
| Search |
||||||||||||
| Yahoo Properties |
21% | 24% | 29% | |||||||||
| Affiliate sites |
16% | 14% | 8% | |||||||||
|
|
|
|
|
|
|
|||||||
| Total Search revenue |
37% | 38% | 37% | |||||||||
|
|
|
|
|
|
|
|||||||
| Other |
20% | 19% | 21% | |||||||||
|
|
|
|
|
|
|
|||||||
| Total revenue |
100% | 100% | 100% | |||||||||
| Cost of revenueTAC |
12% | 10% | 6% | |||||||||
| Cost of revenueother |
20% | 22% | 23% | |||||||||
| Sales and marketing |
23% | 22% | 24% | |||||||||
| Product development |
18% | 18% | 22% | |||||||||
| General and administrative |
10% | 11% | 12% | |||||||||
| Amortization of intangibles |
1% | 1% | 1% | |||||||||
| Gains on sales of patents |
| | (2)% | |||||||||
| Goodwill impairment charge |
| | 1% | |||||||||
| Restructuring charges, net |
| 5% | | |||||||||
|
|
|
|
|
|
|
|||||||
| Total operating expenses |
84% | 89% | 87% | |||||||||
|
|
|
|
|
|
|
|||||||
| Income from operations |
16% | 11% | 13% | |||||||||
|
|
|
|
|
|
|
|||||||
| Includes: |
||||||||||||
| Stock-based compensation expense |
4% | 4% | 6% | |||||||||
| Costs associated with the Korea business and its closure |
| 2% | | |||||||||
45
Management Reporting
We continue to manage our business geographically. The primary areas of measurement and decision making are currently the Americas, EMEA and Asia Pacific. Management relies on an internal reporting process that provides revenue ex-TAC, direct costs excluding TAC by segment, and consolidated income from operations for making decisions related to the evaluation of the financial performance of, and allocating resources to, our segments.
| Years Ended December 31, | 2011-2012 % Change |
2012-2013 % Change |
||||||||||||||||||
| 2011 | 2012 | 2013 | ||||||||||||||||||
| (dollars in thousands) | ||||||||||||||||||||
| Revenue by segment: |
||||||||||||||||||||
| Americas |
$ | 3,302,989 | $ | 3,461,633 | $ | 3,481,502 | 5% | 1 | % | |||||||||||
| EMEA |
629,383 | 472,061 | 385,186 | (25)% | (18) | % | ||||||||||||||
| Asia Pacific |
1,051,827 | 1,052,872 | 813,692 | | (23) | % | ||||||||||||||
|
|
|
|
|
|
|
|||||||||||||||
| Total revenue |
$ | 4,984,199 | $ | 4,986,566 | $ | 4,680,380 | | (6) | % | |||||||||||
| TAC by segment: |
||||||||||||||||||||
| Americas |
$ | 160,110 | $ | 182,511 | $ | 158,974 | 14% | (13) | % | |||||||||||
| EMEA |
221,916 | 114,230 | 42,915 | (49)% | (62) | % | ||||||||||||||
| Asia Pacific |
221,345 | 222,165 | 52,553 | | (76) | % | ||||||||||||||
|
|
|
|
|
|
|
|||||||||||||||
| Total TAC |
$ | 603,371 | $ | 518,906 | $ | 254,442 | (14)% | (51) | % | |||||||||||
| Revenue ex-TAC by segment: |
||||||||||||||||||||
| Americas |
$ | 3,142,879 | $ | 3,279,122 | $ | 3,322,528 | 4% | 1 | % | |||||||||||
| EMEA |
407,467 | 357,831 | 342,271 | (12)% | (4) | % | ||||||||||||||
| Asia Pacific |
830,482 | 830,707 | 761,139 | | (8) | % | ||||||||||||||
|
|
|
|
|
|
|
|||||||||||||||
| Total revenue ex-TAC |
$ | 4,380,828 | $ | 4,467,660 | $ | 4,425,938 | 2% | (1) | % | |||||||||||
| Direct costs by segment(1): |
||||||||||||||||||||
| Americas |
696,103 | 733,316 | 747,684 | 5% | 2 | % | ||||||||||||||
| EMEA |
165,750 | 161,990 | 165,719 | (2)% | 2 | % | ||||||||||||||
| Asia Pacific |
225,417 | 224,114 | 197,619 | (1)% | (12) | % | ||||||||||||||
| Global operating costs(2)(3) |
1,638,975 | 1,672,070 | 1,830,621 | 2% | 9 | % | ||||||||||||||
| Depreciation and amortization |
625,864 | 649,267 | 628,778 | 4% | (3) | % | ||||||||||||||
| Stock-based compensation expense |
203,958 | 224,365 | 278,220 | 10% | 24 | % | ||||||||||||||
| Gains on sales of patents |
| | (79,950) | | 100 | % | ||||||||||||||
| Goodwill impairment charge |
| | 63,555 | | 100 | % | ||||||||||||||
| Restructuring charges, net |
24,420 | 236,170 | 3,766 | N/M | (98) | % | ||||||||||||||
|
|
|
|
|
|
|
|||||||||||||||
| Income from operations |
$ | 800,341 | $ | 566,368 | $ | 589,926 | (29)% | 4 | % | |||||||||||
|
|
|
|
|
|
|
|||||||||||||||
N/M = Not Meaningful
| (1) | Direct costs for each segment include cost of revenueother, as well as other operating expenses that are directly attributable to the segment such as employee compensation expense (excluding stock-based compensation expense), local sales and marketing expenses, and facilities expenses. Beginning in 2012, marketing and customer experience costs are managed locally and included as direct costs for each segment. Prior period amounts have been revised to conform to the current presentation. |
| (2) | Global operating costs include product development, service engineering and operations, general and administrative, and other corporate expenses that are managed on a global basis and that are not directly attributable to any particular segment. Prior to 2012, marketing and customer experience costs were managed on a global basis and included as global operating costs. Prior period amounts have been revised to conform to the current presentation. |
46
| (3) | The net cost reimbursements from Microsoft pursuant to the Search Agreement are primarily included in global operating costs. Operating costs and expenses consist of cost of revenueTAC; cost of revenueother; sales and marketing, product development; general and administrative; amortization of intangible assets; and restructuring charges, net. Cost of revenueother consists of bandwidth costs and other expenses associated with the production and usage of Yahoo Properties, including amortization of acquired intellectual property rights and developed technology. |
Revenue
We generate revenue principally from display and search advertising on Yahoo Properties and Affiliate sites, with the majority of our revenue coming from advertising on Yahoo Properties. Our margins on revenue from Yahoo Properties advertising are higher than our margins on revenue from display and search advertising on Affiliate sites as we pay TAC to our Affiliates. Additionally, we generate revenue from other sources including listings-based services, facilitating commercial transactions, royalties, and consumer and business fee-based services.
With the significant platform shift to mobile devices, including smartphones and tablets, we have increased our strategic focus on mobile products and mobile ad formats. We have hired engineering and technical talent to help us accelerate our efforts in mobile development, and introduced new mobile apps and refreshed the user experience on mobile across a number of Yahoo Properties, including News, Sports and Finance. We are seeing an increase in the number of our daily and monthly mobile users as a result of these product improvements. The monetization of these mobile products is driven primarily through advertisements and we are committed to continuing to develop and deliver innovative ad formats on mobile. While we see a significant opportunity for monetization on mobile, during 2013 and at present our revenue from mobile is not material.
Display Revenue
Display revenue is generated from the display of graphical and non-graphical advertisements (display advertising). We earn revenue from guaranteed or premium display advertising by delivering advertisements according to advertisers specified criteria, such as number of impressions during a fixed period on a specific placement. Also, we earn revenue from non-guaranteed or non-premium display advertising by delivering advertisements on a preemptible basis.
We recognize revenue from display advertising on Yahoo Properties and Affiliate sites as impressions are delivered. Impressions are delivered when a sold advertisement appears in pages viewed by users. Arrangements for these services generally have terms of up to one year. For display advertising on Affiliate sites, we pay TAC to Affiliates for the revenue generated from the display of these advertisements on the Affiliate sites. The display revenue derived from these arrangements that involve traffic supplied by Affiliates is reported on a gross basis (before deducting the TAC paid to Affiliates) as we are the primary obligor to the advertisers who are the customers of the display advertising service.
Display revenue for the year ended December 31, 2013 decreased by 9 percent, compared to 2012. This decrease was primarily attributable to a decline in number of ads that we sold on a premium basis on Yahoo Properties in the Americas region.
Display revenue for the year ended December 31, 2012 decreased by 1 percent, compared to 2011. This decrease can be attributed to a decline in display revenue on Yahoo Properties in the EMEA region.
Search Revenue
Search revenue is generated from clicks on text-based links to advertisers Websites that appear primarily on search results pages (search advertising). We recognize revenue from search advertising on Yahoo Properties
47
and Affiliate sites. Search revenue is recognized based on Paid Clicks. A Paid Click occurs when an end-user clicks on a sponsored listing on Yahoo Properties or Affiliate sites for which an advertiser pays on a per click basis. Under the Search Agreement with Microsoft, in transitioned markets we report as revenue our 88 percent revenue share as we are not the primary obligor in the arrangement with the advertisers. See Significant TransactionsSearch Agreement with Microsoft Corporation above for a description of our Search Agreement with Microsoft. In non-transitioned markets, we paid Affiliates TAC for the revenue generated from the search advertisements on the Affiliates Websites. The revenue derived from these arrangements was reported on a gross basis (before deducting the TAC paid to Affiliates), as we were the primary obligor to the advertisers in non-transitioned markets and we recorded the related revenue as it was earned. We also generate search revenue from a revenue sharing arrangement with Yahoo Japan for search technology and services.
Search revenue for the year ended December 31, 2013 decreased by 8 percent compared to 2012. Search revenue decreased primarily due to declines in Affiliate revenue in the Asia Pacific region resulting from the closure of our Korea business, and declines in Affiliate revenue in the EMEA region due to the required change in revenue presentation for transitioned markets from a gross (before TAC) to a net (after TAC) basis. This was partially offset by increased search revenue in the Americas region, which resulted from an increase in sponsored searches on Yahoo Properties and higher revenue per search due to improved ad formats.
Search revenue for the year ended December 31, 2012 increased by 2 percent compared to 2011. Search revenue increased due to increased search revenue in the Americas region which resulted from an increase in sponsored searches on Yahoo Properties, as well as higher revenue per search. The increase was partially offset by decreased search revenue in the EMEA region and other markets due to the required change in revenue presentation for transitioned markets from a gross to a net (after TAC) basis.
Other Revenue
Other revenue includes listings-based services revenue, transaction revenue, royalties, and fees revenue. Listings-based services revenue is generated from a variety of consumer and business listings-based services, including classified advertising. We recognize listings-based services revenue when the services are performed. Transaction revenue is generated from facilitating commercial transactions through Yahoo Properties, principally from Yahoo Small Business, Yahoo Travel, and Yahoo Shopping. We recognize transaction revenue when there is evidence that qualifying transactions have occurred. We also receive royalties from joint venture partners that are recognized when earned. Fees revenue consists of revenue generated from a variety of consumer and business fee-based services as well as services for small businesses. We recognize fees revenue when the services are performed.
Other revenue for the year ended December 31, 2013 increased by 3 percent, compared to 2012. The increase was primarily due to increased royalty revenue resulting from the amended TIPLA agreement with Alibaba Group. This was partially offset by a decrease in listings-based revenue in the Americas region.
Other revenue for the year ended December 31, 2012 decreased by 1 percent, compared to 2011. There was a decrease in fees revenue from certain of our broadband access partnerships and a decline in listings revenue in the Americas region. This decrease was partially offset by an increase in the Americas region due to new and amended partner deals, as well as an increase in royalty revenue resulting from the amended TIPLA agreement.
Display and Search Metrics
We present information below regarding the number of Ads Sold and Price-per-Ad for display and the number of Paid Clicks and Price-per-Click for search. This information is derived from internal data.
Ads Sold is defined as display ad impressions for paying advertisers on Yahoo Properties. Price-per-Ad is defined as display revenue from Yahoo Properties divided by our total number of Ads Sold. Our price and
48
volume metrics for display are based on display revenue which we report on a gross basis (before TAC). Our price and volume metrics for display exclude both the number of Ads Sold and the related revenue for certain regions where we did not retain historical information in a manner that would support period-to-period comparison on these metrics. The countries and regions included in our display metrics are: the United States, the United Kingdom, France, Germany, Spain, Italy, Taiwan, Hong Kong, Southeast Asia, and India.
Paid Clicks are defined as clicks by end-users on sponsored search listings on Yahoo Properties and Affiliate sites for which an advertiser pays on a per click basis. Price-per-Click is defined as search revenue divided by our total number of Paid Clicks. Our price and volume metrics for search are based on gross search revenue (before TAC) in all markets in which we operate.
We periodically review, refine and update our methodologies for monitoring, gathering, and counting numbers of Ads Sold and Paid Clicks and for calculating Price-per-Click and Price-per-Ad.
Commencing in the third quarter of 2013, we made three updates to our methodologies. First, we now include the impressions and revenue associated with our new stream ad units, which are display ads that appear in the content streams viewed by users, in our display price and volume metrics (Ads Sold and Price-per-Ad). Second, to provide metrics that are more consistent with our historical revenue trends, the revenue and volume associated with other display advertisements sold on a price-per-click basis have been excluded from our search price and volume metrics (Paid Clicks and Price-per-Click) and they will continue to be excluded from our display price and volume metrics. Finally, the Microsoft RPS Guarantee has been excluded from the calculation of Price-per-Click. Due to the closure of the Korea business in the fourth quarter of 2012, Ads Sold, Paid Clicks, Price-per-Ad, and Price-per-Click, as presented below, exclude the Korea market for all periods presented. Prior period amounts have been updated to conform to the current presentation.
Display Metrics
For the year ended December 31, 2013, number of Ads Sold decreased 1 percent and Price-per-Ad decreased 7 percent, compared to 2012. The decrease in number of Ads Sold year-over-year was attributable to a decline in premium Ads Sold, which was partially offset by growth in non-premium advertising as a result of stream ad units. The decrease in Price-per-Ad year-over-year was due to a shift in the mix of ads sold towards lower monetizing stream ad units.
For the year ended December 31, 2012, number of Ads Sold decreased 10 percent and Price-per-Ad increased 8 percent, compared to 2011. The decrease in number of Ads Sold year-over-year was attributable to a decline in number of Ads Sold on Yahoo Properties in the Americas and Asia Pacific regions. The increase in Price-per-Ad was due to a change in the mix of our ads sold.
Search Metrics
For the year ended December 31, 2013, Paid Clicks increased 19 percent and Price-per-Click decreased 4 percent, compared to 2012. The increase in Paid Clicks was attributable to improved ad formats on Yahoo Search, increased mobile traffic, and increased Affiliate traffic in the Americas region. The increase in Affiliate traffic was driven by incremental traffic in Latin America. The decrease in Price-per-Click was primarily due to a higher mix of traffic in lower monetizing geographic regions and traffic quality improvement initiatives conducted by Yahoo, which lowered Price-per-Click.
For the year ended December 31, 2012, Paid Clicks and Price-per-Click increased 8 percent and 2 percent, respectively, compared to 2011. The increase in Paid Clicks was primarily attributable to the optimization of the user interface. The increase in Price-per-Click was due to a change in the mix of Paid Clicks on our sponsored listings.
49
Revenue ex-TAC by Segment
Americas
Americas revenue ex-TAC for the year ended December 31, 2013 increased $43 million, or 1 percent, compared to 2012. The increase in Americas revenue ex-TAC was primarily attributable to an increase in search revenue ex-TAC of $148 million and fees revenue of $87 million. The increase in search revenue ex-TAC was attributable to an increase in sponsored searches on Yahoo Properties and higher revenue per search due to improved ad formats. The increase in fees revenue was primarily due to increased royalty revenue resulting from the amended TIPLA agreement with Alibaba Group. This was partially offset by a decline in display revenue ex-TAC of $142 million due to declines in the number of Ads Sold on a premium basis on Yahoo Properties, and a decline in listings revenue of $50 million.
Americas revenue ex-TAC for the year ended December 31, 2012 increased $136 million, or 4 percent, compared to 2011. The year-over-year increase in Americas revenue ex-TAC was primarily attributable to increased search revenue ex-TAC from increases in sponsored search on Yahoo Properties, which was partially offset by a decline in display revenue ex-TAC.
Revenue ex-TAC in the Americas accounted for approximately 75 percent of total revenue ex-TAC for the year ended December 31, 2013, compared to 73 percent in 2012 and 72 percent in 2011.
EMEA
EMEA revenue ex-TAC for the year ended December 31, 2013 decreased $16 million, or 4 percent, compared to 2012, due to declines in display revenue ex-TAC on Yahoo Properties driven by a decrease in premium advertising primarily related to Mail.
EMEA revenue ex-TAC for the year ended December 31, 2012 decreased $50 million, or 12 percent, compared to 2011. The year-over-year declines in EMEA revenue ex-TAC were primarily related to decreased search and display revenue ex-TAC. Search revenue ex-TAC declined due to the revenue share with Microsoft associated with the Search Agreement. Display revenue ex-TAC on Yahoo Properties also declined due to a decrease in premium advertising related to a decline in supply which was partially offset by increased pricing.
Revenue ex-TAC in EMEA accounted for approximately 8 percent of total revenue ex-TAC for the year ended December 31, 2013, compared to 8 percent in 2012 and 9 percent in 2011.
Asia Pacific
Asia Pacific revenue ex-TAC for the year ended December 31, 2013 decreased $70 million, or 8 percent compared to 2012. The decline was primarily attributable to a decrease in revenue ex-TAC related to the closure of our Korea business of $63 million and unfavorable foreign exchange rate fluctuations.
Asia Pacific revenue ex-TAC for the year ended December 31, 2012 was flat compared to 2011 due to an increase in display revenue ex-TAC offset by a decline in search revenue ex-TAC.
Revenue ex-TAC in Asia Pacific accounted for approximately 17 percent of total revenue ex-TAC for the year ended December 31, 2013, compared to 19 percent for both 2012 and 2011.
Direct Costs by Segment
Americas
For the year ended December 31, 2013, direct costs attributable to the Americas segment increased $14 million, or 2 percent, compared to 2012. The increase in direct costs was primarily due to increases in marketing expenses
50
of $25 million and content costs of $5 million. The increase in marketing expenses was primarily due to advertising campaigns to generate additional traffic on Yahoo Shopping, Mail, Autos and Screen, as well as our On the Road with Yahoo marketing campaign and our Fantasy Football television advertising campaign. There were no similar campaigns in 2012. The increase in marketing expenses and content costs was partially offset by declines in compensation costs of $9 million and bandwidth and other cost of revenue of $6 million.
For the year ended December 31, 2012, direct costs attributable to the Americas segment increased $37 million, or 5 percent, compared to 2011. The increase in direct costs was primarily due to higher compensation of $44 million and content costs of $35 million partially offset by lower marketing costs of $33 million and bandwidth and other cost of revenue of $7 million.
Direct costs attributable to the Americas segment represented approximately 23 percent of Americas revenue ex-TAC for the year ended December 31, 2013 compared to 22 percent for both 2012 and 2011.
EMEA
For the year ended December 31, 2013, direct costs attributable to the EMEA segment increased $4 million, or 2 percent, compared to 2012. The increase in direct costs was primarily attributable to an increase in content costs and marketing expenses of $6 million partially offset by a $3 million decrease in compensation costs and bandwidth and other cost of revenue.
For the year ended December 31, 2012, direct costs attributable to the EMEA segment decreased $4 million, or 2 percent, compared to 2011. The decline was primarily due to decreased compensation costs of $3 million and marketing expenses of $2 million in the region. This was partially offset by increased content costs of $2 million in the region.
Direct costs attributable to the EMEA segment represented approximately 48 percent of EMEA revenue ex-TAC for the year ended December 31, 2013, compared to 45 percent and 41 percent in 2012 and 2011, respectively.
Asia Pacific
For year ended December 31, 2013, direct costs attributable to the Asia Pacific segment decreased $26 million, or 12 percent, compared to 2012. The decrease was primarily attributable to a $15 million decline in compensation costs which resulted from reduced headcount primarily related to the closure of our Korea business, a $6 million decline in content costs, and a $10 million decline in outsourced service provider expenses and other expenses. This overall decrease was partially offset by an increase of $9 million in bandwidth and other cost of revenue in the region.
For year ended December 31, 2012, direct costs attributable to the Asia Pacific segment decreased $1 million, or 1 percent, compared to 2011. The decrease was primarily due to decreased marketing expenses offset by higher bandwidth and other cost of revenue.
Direct costs attributable to the Asia Pacific segment represented approximately 26 percent of Asia Pacific revenue ex-TAC for the year ended December 31, 2013, compared to 27 percent for both 2012 and 2011.
Operating Costs and Expenses
Traffic Acquisition Costs for Non-transitioned Search Markets and All Display Markets
TAC consists of payments made to third-party entities that have integrated our advertising offerings into their Websites or other offerings and payments made to companies that direct consumer and business traffic to Yahoo Properties. We enter into agreements of varying duration that involve TAC. There are generally two economic
51
structures of the Affiliate agreements: fixed payments based on a guaranteed minimum amount of traffic delivered, which often carry reciprocal performance guarantees from the Affiliate, or variable payments based on a percentage of our revenue or based on a certain metric, such as number of searches or paid clicks. We expense TAC under two different methods. Agreements with fixed payments are expensed ratably over the term the fixed payment covers, and agreements based on a percentage of revenue, number of searches, or other metrics are expensed based on the volume of the underlying activity or revenue multiplied by the agreed-upon price or rate.
TAC for the year ended December 31, 2013 decreased $264 million, or 51 percent, compared to 2012. The decrease for the year ended December 31, 2013, compared to 2012, was primarily attributable to declines in the Asia Pacific, EMEA and Americas regions of $170 million, $71 million and $23 million, respectively. The decline was due to (i) the closure of our Korea business in the Asia Pacific region, (ii) the required change in revenue presentation for additional transitioned markets from a gross (before TAC) to a net (after TAC) basis in the EMEA region, and (iii) a decline in display revenue in the Americas region.
TAC for the year ended December 31, 2012 decreased $84 million, or 14 percent, compared to 2011. The decrease for the year ended December 31, 2012, compared to 2011, was primarily attributable to the required change in the presentation of revenue from a gross (before TAC) to a net (after TAC) basis in EMEA associated with the transition of paid search in the EMEA region to Microsofts search platform. This decline was partially offset by an increase in display TAC in the Americas region resulting from an acquisition we completed in the fourth quarter of 2011.
TAC represented approximately 6 percent of GAAP revenue for the year ended December 31, 2013, compared to 10 percent and 12 percent in 2012 and 2011, respectively. The decrease in TAC as a percentage of GAAP revenue in 2013, as compared to 2012, is due to the closure of our Korea business in the Asia Pacific region and the transition of paid search to Microsoft.
Cost of RevenueOther
Cost of revenueother consists of bandwidth costs, and other expenses associated with the production and usage of Yahoo Properties, including amortization of developed technology and patents. Cost of revenueother also includes costs for Yahoos technology platforms and infrastructure, including depreciation expense and other operating costs, directly related to revenue generating activities.
Cost of revenueother decreased $7 million, or 1 percent, for the year ended December 31, 2013, compared to 2012. The decrease for the year ended December 31, 2013, compared to 2012, was primarily due to a decline in amortization of developed technology and patents of $18 million partially offset by an increase in content costs of $11 million.
Cost of revenueother increased $118 million, or 12 percent, for the year ended December 31, 2012, compared to 2011. The increase for the year ended December 31, 2012, compared to 2011, was primarily attributable to increases of $67 million in bandwidth costs, $38 million in content costs, and $10 million in incremental depreciation of server equipment.
Cost of revenueother represented approximately 23 percent of GAAP revenue for the year ended December 31, 2013, compared to 22 percent and 20 percent in 2012 and 2011, respectively.
Sales and Marketing
Sales and marketing expenses consist primarily of advertising and other marketing-related expenses, compensation-related expenses (including stock-based compensation expense), sales commissions, and travel costs.
52
Sales and marketing expenses for the year ended December 31, 2013 increased $29 million, or 3 percent, as compared to 2012. The year-over-year increase was primarily due to an increase in marketing expenses of $31 million and stock-based compensation expenses of $20 million. This was offset by a decline in other compensation costs of $25 million. The increase in marketing expenses was primarily due to advertising campaigns to generate additional traffic on Yahoo Shopping, Mail, Autos and Screen, as well as our On the Road with Yahoo marketing campaign and our Fantasy Football television advertising campaign, for which there were no similar campaigns in 2012. The increase in stock based compensation in the sales and marketing function was due to an increase in the number of awards granted at a higher fair value, including performance-based awards. The decline in other compensation costs in the sales and marketing function was primarily due to a decline in average headcount year-over-year.
Sales and marketing expenses for the year ended December 31, 2012 decreased $21 million, or 2 percent, as compared to 2011. The year-over-year decrease was primarily due to a decline in marketing and public relations expenses as well as a decline in third-party service provider expenses. This was offset by higher salaries of $29 million and higher stock-based compensation expense of $17 million in the sales and marketing function. The increase in salaries was due to higher sales commissions. The increase in stock-based compensation expense was due primarily to increased award grants and vesting accelerations upon executive terminations.
Sales and marketing expenses represented approximately 24 percent of GAAP revenue for the year ended December 31, 2013, compared to 22 percent and 23 percent in 2012 and 2011, respectively.
Product Development
Product development expenses consist primarily of compensation-related expenses (including stock-based compensation expense) incurred for the development of, enhancements to and maintenance of Yahoo Properties, classification and organization of listings within Yahoo Properties, research and development, and Yahoos technology platforms and infrastructure. Depreciation expense and other operating costs are also included in product development.
Product development expenses for the year ended December 31, 2013 increased $123 million, or 14 percent, as compared to 2012. For the year ended December 31, 2013, the increase was primarily attributable to a decline in capitalizable projects of $65 million, as well as an increase in facilities and equipment expense of $24 million, stock based compensation expense of $9 million, salaries of $11 million due to an increase in headcount in the function, and travel and entertainment expense of $6 million. The increase in stock based compensation in the product development function was due to an increase in the number of awards granted at a higher fair value.
Product development expenses for the year ended December 31, 2012 decreased $34 million, or 4 percent, as compared to 2011. For the year ended December 31, 2012, the decline was primarily attributable to a decline in salaries of $22 million and a decline in stock based compensation expense of $6 million in the product development function as a result of reduced headcount related to the Q212 Restructuring Plan described below.
Product development expenses represented approximately 22 percent of GAAP revenue for the year ended December 31, 2013, compared to 18 percent for both 2012 and 2011.
General and Administrative
General and administrative expenses consist primarily of compensation-related expenses (including stock-based compensation expense) related to other corporate departments and fees for professional services.
General and administrative expenses for the year ended December 31, 2013 increased $29 million, or 5 percent, as compared to 2012. The increase in expenses in the general and administrative function was due to increases in facilities and equipment expense of $20 million due to investments in office space and our global employee
53
experience, salaries of $13 million due to an increase in headcount in the function, and stock-based compensation expense of $20 million due to an increase in the number of awards granted at a higher fair value, including performance-based awards. This was partially offset by a decline of $20 million in legal costs.
General and administrative expenses for the year ended December 31, 2012 increased $43 million, or 9 percent, as compared to 2011. The increase in the general and administrative function was due to increases of $16 million in professional services expense, $19 million in legal costs associated with the closure of our Korea business, and $12 million in stock-based compensation expense primarily due to vesting accelerations upon executive terminations.
General and administrative expenses represented approximately 12 percent of GAAP revenue for the year ended December 31, 2013, compared to 11 percent and 10 percent in 2012 and 2011, respectively.
Amortization of Intangibles
We have purchased, and expect to continue purchasing, assets and/or businesses, which may include the purchase of intangible assets. Intangible assets includes customer, affiliate, and advertiser-related relationships and tradenames, trademarks and domain names. Amortization of developed technology and patents is included in the cost of revenueother, and not in amortization of intangibles.
Amortization of intangibles for the year ended December 31, 2013 increased $9 million, or 25 percent, as compared to 2012. The year-over-year increase in amortization of intangibles from 2012 to 2013 was primarily driven by incremental amortization from acquisitions completed in 2013, partially offset by a decrease in amortization of intangibles driven by fully amortized assets acquired in prior years.
Amortization of intangibles for the year ended December 31, 2012 increased $2 million, or 7 percent, as compared to 2011. The year-over-year increase in amortization of intangibles from 2011 to 2012 was primarily driven by the inclusion of intangibles related to an acquisition in the fourth quarter of 2011. This is offset by a decrease in amortization expense for fully amortized assets acquired in prior years.
Amortization of intangibles represented approximately 1 percent of GAAP revenue for the years ended December 31, 2013, 2012, and 2011.
Gains on Sales of Patents
For the year ended December 31, 2013, we sold certain patents and recorded gains on sales of patents of approximately $80 million. The gains on sales of patents were primarily related to a patent sale agreement with a wholly-owned affiliate of Alibaba Group entered into during the fourth quarter of 2013 for $70 million.
Goodwill Impairment Charge
We conducted our annual goodwill impairment test as of October 31, 2013 and determined that the fair values of our reporting units, with the exception of the Middle East reporting unit, exceeded their carrying values and therefore goodwill in those reporting units was not impaired. We concluded that the carrying value of the Middle East reporting unit exceeded its fair value and recorded a goodwill impairment charge of approximately $64 million. See Note 5Goodwill in the Notes to our consolidated financial statements for additional information.
54
Restructuring Charges, Net
For the years ended December 31, 2011, 2012, and 2013, restructuring charges, net was comprised of the following (dollars in thousands):
| Year Ended December 31, 2011 |
Year Ended December 31, 2012 | |||||||||||||||||||
| Restructuring Plans Prior to 2012 |
Restructuring Plans Prior to 2012 |
Q212 Restructuring Plan |
Q412 Korea Business Closure |
Total | ||||||||||||||||
| Employee severance pay and related costs |
$ | 12,965 | $ | 1,169 | $ | 96,537 | $ | 4,998 | $ | 102,704 | ||||||||||
| Non-cancelable lease, contract terminations, and other charges |
10,251 | 8,462 | 9,541 | 8,996 | 26,999 | |||||||||||||||
| Other non-cash charges, net |
990 | | 40,462 | 69,434 | 109,896 | |||||||||||||||
|
|
|
|
|
|
|
|
|
|
|
|||||||||||
| Sub-total before accelerations (reversals) of stock-based compensation expense |
24,206 | 9,631 | 146,540 | 83,428 | 239,599 | |||||||||||||||
| Accelerations (reversals) of stock-based compensation expense |
214 | | (3,429 | ) | | (3,429 | ) | |||||||||||||
|
|
|
|
|
|
|
|
|
|
|
|||||||||||
| Restructuring charges, net |
$ | 24,420 | $ | 9,631 | $ | 143,111 | $ | 83,428 | $ | 236,170 | ||||||||||
|
|
|
|
|
|
|
|
|
|
|
|||||||||||
| Year Ended December 31, 2013 | ||||||||||||||||||||
| Restructuring Plans Prior to 2012 |
Q212 Restructuring Plan |
Q412 Korea Business Closure |
Q413 Restructuring Plan |
Total | ||||||||||||||||
| Employee severance pay and related costs |
$ | (459 | ) | $ | (15,401 | ) | $ | (103 | ) | $ | 5,144 | $ | (10,819 | ) | ||||||
| Non-cancelable lease, contract terminations, and other charges |
13,894 | 164 | (20 | ) | | 14,038 | ||||||||||||||
| Other non-cash charges |
| | 547 | | 547 | |||||||||||||||
|
|
|
|
|
|
|
|
|
|
|
|||||||||||
| Restructuring charges (reversal), net |
$ | 13,435 | $ | (15,237 | ) | $ | 424 | $ | 5,144 | $ | 3,766 | |||||||||
|
|
|
|
|
|
|
|
|
|
|
|||||||||||
Restructuring Plans Prior to 2012. Prior to 2012, we implemented workforce reductions, a strategic realignment, and consolidation of certain real estate facilities and data centers to reduce our cost structure, align resources with our product strategy and improve efficiency. During the year ended December 31, 2011, we incurred total pre-tax cash charges of $23 million in severance, facility and other related costs, net of reversal for adjustments to original estimates totaling $12 million. In addition to the pre-tax cash charges, we recorded a non-cash charge of $1 million related to asset impairment. Of the $24 million in restructuring charges, net recorded in the year ended December 31, 2011, $22 million related to the Americas segment, $1 million related to the EMEA segment and $1 million related to the Asia Pacific segment. During the year ended December 31, 2012, we recorded total pre-tax cash charges of $10 million in severance, facility and other related costs, net of reversal for adjustments to original estimates totaling $5 million. The majority of the $10 million in restructuring charges, net recorded in the year ended December 31, 2012, related to the Americas segment.
During the year ended December 31, 2013, we incurred total pre-tax cash charges of $13 million in facility and other related costs, net of reversal for adjustments to original estimates totaling $1 million. Of the $13 million recorded for the year ended December 31, 2013, $8 million related to the Americas segment and $5 million related to the EMEA segment.
55
As of December 31, 2013, the aggregate outstanding restructuring liability related to the Restructuring Plans Prior to 2012 was $22 million, most of which relates to non-cancelable lease costs that we expect to pay over the terms of the related obligations, which extend to the second quarter of 2017.
Q212 Restructuring Plan. During the second quarter of 2012, we began implementing the Q212 Restructuring Plan to reduce our worldwide workforce by approximately 2,000 employees and to consolidate certain real estate and data center facilities. During the year ended December 31, 2012, we recorded total pre-tax cash charges of $139 million in severance and facility related costs and $40 million in non-cash facility and other asset impairment charges. The total pre-tax charges were offset by changes to original estimates of $33 million in severance related costs recognized throughout 2012, primarily as a result of redeployments and voluntary resignations of employees prior to their planned severance dates and a $3 million credit related to non-cash stock-based compensation expense reversals for unvested stock awards that were forfeited. Of the $143 million in restructuring charges, net recorded in the year ended December 31, 2012, $93 million related to the Americas segment, $46 million related to the EMEA segment and $4 million related to Asia Pacific segment.
During the year ended December 31, 2013, we recorded total pre-tax cash charges of $7 million in severance, facility and other related costs, which were offset by a credit of $22 million for severance-related reversals due to adjustments to original estimates as a result of redeployments and voluntary resignations of employees prior to their planned severance dates. Of the $15 million credit in restructuring charges, net, recorded in the year ended December 31, 2013, $7 million related to the Americas segment, $7 million related to the EMEA segment, and $1 million related to the Asia Pacific segment.
As of December 31, 2013, the aggregate outstanding restructuring liability related to the Q212 Restructuring Plan was $3 million, most of which relates to non-cancelable lease costs that we expect to pay over the terms of the related obligations, which extend to the fourth quarter of 2021.
Q412 Korea Business Closure. During the fourth quarter of 2012, we decided to close our Korea business to streamline our operations and focus our resources. During the year ended December 31, 2012, we incurred total pre-tax cash charges of $13 million in severance and contract termination costs. In addition to the pre-tax cash charges, we recorded a non-cash charge of $86 million related to goodwill and other asset impairments and a non-cash credit of approximately $16 million related to the reversal of previously recorded cumulative foreign currency translation adjustments. As a result, we recorded a net $83 million in restructuring charges, which all related to the Asia Pacific segment, for the year ended December 31, 2012.
During the year ended December 31, 2013, we recorded net pre-tax charges of less than $1 million in severance, facility and contract termination costs related to the Asia Pacific segment.
As of December 31, 2013, the aggregate outstanding restructuring liability related to the Q412 Korea Business Closure was less than $1 million, most of which relates to contract termination costs that we expect will be substantially paid by the first quarter of 2014.
Q413 Restructuring Plan. During the fourth quarter of 2013, we started the process of closing our Cairo, Egypt and Rolle, Switzerland offices, as part of our continued efforts to streamline our operations and focus our resources. During the year ended December 31, 2013, we recorded total pre-tax cash charges of $5 million in severance and other related costs, which all related to the EMEA segment.
As of December 31, 2013, the aggregate outstanding restructuring liability related to the Q413 Restructuring Plan was $5 million for severance and related costs that we expect to pay by the third quarter of 2014.
See Note 15Restructuring charges, net in the Notes to our consolidated financial statements for additional information.
56
Other Income, Net
Other income, net was as follows (dollars in thousands):
| Years Ended December 31, | 2011-2012 Dollar Change |
2012-2013 Dollar Change |
||||||||||||||||||
| 2011 | 2012 | 2013 | ||||||||||||||||||
| Interest, dividend, and investment income |
$ | 18,920 | $ | 41,673 | $ | 57,544 | $ | 22,753 | $ | 15,871 | ||||||||||
| Gain related to the sale of Alibaba Group Shares |
| 4,603,322 | | 4,603,322 | (4,603,322 | ) | ||||||||||||||
| Interest expense |
(9,473 | ) | (9,297 | ) | (14,319 | ) | 176 | (5,022 | ) | |||||||||||
| Other |
17,728 | 12,141 | 132 | (5,587 | ) | (12,009 | ) | |||||||||||||
|
|
|
|
|
|
|
|
|
|
|
|||||||||||
| Total other income, net |
$ | 27,175 | $ | 4,647,839 | $ | 43,357 | $ | 4,620,664 | $ | (4,604,482 | ) | |||||||||
|
|
|
|
|
|
|
|
|
|
|
|||||||||||
Interest, dividend, and investment income consists of income earned from cash in bank accounts, investments made in marketable securities and money market funds, and dividend income on the Alibaba Group Preference Shares prior to the redemption of such shares in May 2013.
For the year ended December 31, 2012, we recorded a pre-tax gain of approximately $4.6 billion related to the sale to Alibaba Group of the Shares. See Note 8Investments in Equity Interests in the Notes to our consolidated financial statements for additional information.
Interest expense is related to the Notes and capital lease obligations for buildings and data centers.
Other consists of gains and losses from sales or impairments of marketable securities and/or investments in privately-held companies, foreign exchange gains and losses due to re-measurement of monetary assets and liabilities denominated in non-functional currencies, and foreign exchange gains and losses on balance sheet hedges.
Other income, net may fluctuate in future periods due to changes in our average investment balances, changes in interest and foreign exchange rates, changes in the fair value of foreign currency forward contracts, realized gains and losses on investments, and impairments of investments.
Income Taxes
The provision for income taxes for the year ended December 31, 2013 differs from the amount computed by applying the federal statutory income tax rate to income before provision for income taxes and earnings in equity interests as follows (dollars in thousands):
| Years Ended December 31, | ||||||||||||||||||||||||
| 2011 | (*) | 2012 | (*) | 2013 | (*) | |||||||||||||||||||
| Income tax at the U.S. federal statutory rate of 35 percent |
$ | 289,630 | 35% | $ | 1,824,973 | 35% | $ | 221,648 | 35% | |||||||||||||||
| State income taxes, net of federal benefit |
4,627 | 1% | 237,637 | 5% | 23,000 | 4% | ||||||||||||||||||
| Stock-based compensation expense |
20,021 | 2% | 19,946 | | 16,015 | 3% | ||||||||||||||||||
| Research tax credits |
(10,499 | ) | (1)% | | | (18,036 | ) | (3)% | ||||||||||||||||
| Effect of non-U.S. operations |
(49,781 | ) | (6)% | (138,078 | ) | (3)% | (47,968 | ) | (8)% | |||||||||||||||
| Settlement with tax authorities |
(14,685 | ) | (2)% | (4,711 | ) | | (46,943 | ) | (7)% | |||||||||||||||
| Remeasurement of prior year tax positions |
| | | | (24,246 | ) | (4)% | |||||||||||||||||
| Acquisition related non-deductible expenses |
| | 1,894 | | 9,296 | 1% | ||||||||||||||||||
| Goodwill impairment charge |
| | | | 22,244 | 3% | ||||||||||||||||||
| Other |
2,454 | | (1,618 | ) | | (1,618 | ) | | ||||||||||||||||
|
|
|
|
|
|
|
|
|
|
|
|
|
|||||||||||||
| Provision for income taxes |
$ | 241,767 | 29% | $ | 1,940,043 | 37% | $ | 153,392 | 24% | |||||||||||||||
|
|
|
|
|
|
|
|
|
|
|
|
|
|||||||||||||
| (*) | Percent of income before income taxes and earnings in equity interests. |
57
Significant variances year-over-year as shown above are further explained as follows:
| | The federal research and development credit expired on December 31, 2011. On January 2, 2013, the American Taxpayer Relief Act of 2012 was signed into law retroactively extending the credit for amounts paid or incurred after December 31, 2011 and before January 1, 2014. As such, the provision for income taxes for the year ended December 31, 2013 reflects the benefit of both the 2012 and 2013 federal research and development tax credits. |
| | In 2012, in connection with a review of our cash position and anticipated cash needs for investment in our core business, including potential acquisitions, capital expenditures and stock repurchases, we made a one-time distribution of cash from certain of our consolidated foreign subsidiaries resulting in an overall net benefit for the year ended December 31, 2012 of approximately $117 million. The benefit is primarily due to excess foreign tax credits. Of the $117 million, $102 million is included above within effect of non-U.S. operations. In 2013, effect of non-U.S. operations includes an additional benefit of $36 million due to more excess foreign tax credits becoming available as certain tax matters were resolved with various tax authorities during the year. |
| | In 2013, we settled the IRS income tax examination for the 2005 and 2006 returns resulting in a benefit of approximately $54 million. |
The U.S. Department of the Treasury issued final regulations on the deduction and capitalization of expenditures related to tangible property for income tax purposes. These regulations apply to our tax year beginning on January 1, 2014. Based on our assessment as of December 31, 2013, these regulations will not have a material impact on our consolidated financial position, results of operations, or cash flows.
As of December 31, 2013, we do not anticipate repatriation of our remaining undistributed foreign earnings of approximately $2.6 billion. Those earnings are principally related to Yahoo Japan. If these earnings were to be repatriated in the future, we may be subject to additional U.S. income taxes (subject to an adjustment for foreign tax credits). It is not practicable to determine the income tax liability that might be incurred if these earnings were to be repatriated.
As of December 31, 2013, our federal 2009 and 2010 income tax returns are currently under IRS examination. Furthermore, our California 2005 through 2008 tax returns are also under various stages of audit by the California Franchise Tax Board. While the California Franchise Tax Board has not reached any conclusions on the 2007 and 2008 returns, we have protested the proposed California Franchise Tax Boards adjustments to the 2005 and 2006 returns. We are also in various stages of examination and appeal in connection with our taxes in foreign jurisdictions, which generally span tax years 2005 through 2012.
It is difficult to predict when these examinations will be settled or what their final outcomes will be. We believe that we have adequately provided for any reasonably foreseeable adjustment and that any settlement will not have a material adverse effect on our consolidated financial position, results of operations, or cash flows. Our gross amount of unrecognized tax benefits as of December 31, 2013 is $695 million, of which $606 million is recorded on the consolidated balance sheets.
We may have additional tax liabilities in China related to the sale to Alibaba Group of 523 million Alibaba Group Shares that took place during the year ended December 31, 2012. Any taxes assessed and paid in China are expected to be ultimately offset and recovered in the U.S.
During the year ended December 31, 2012, tax authorities from the Brazilian State of Sao Paulo assessed certain indirect taxes against our Brazilian subsidiary, Yahoo! do Brasil Internet Ltda., related to online advertising services. The assessment totaling approximately $85 million is for calendar years 2008 and 2009. We currently believe the assessment is without merit. We believe the risk of loss is remote and have not recorded an accrual for the assessment.
58
Earnings in Equity Interests
Earnings in equity interests for the year ended December 31, 2013 were approximately $897 million, compared to $676 million and $477 million for 2012 and 2011, respectively.
Earnings in equity interests increased during the year ended December 31, 2013 compared to 2012 primarily due to continued improved financial performance for Alibaba Group.
Earnings in equity interests increased during the year ended December 31, 2012 compared to 2011 due to Yahoo Japan and Alibaba Groups continued improved financial performance in the year ended December 31, 2012 despite the reduction of our ownership interest in Alibaba Group to approximately 24 percent in the fourth quarter of 2012.
We record our share of the results of earnings in equity interests, one quarter in arrears, within earnings in equity interests in the consolidated statements of income. See Note 8Investments in Equity Interests in the Notes to our consolidated financial statements for additional information.
Noncontrolling Interests
Noncontrolling interests represent the noncontrolling holders percentage share of income or losses from the subsidiaries in which we hold a majority, but less than 100 percent, ownership interest and the results of which are consolidated in our consolidated financial statements. Noncontrolling interests were approximately $10 million in 2013, compared to $5 million in 2012 and $14 million in 2011. Noncontrolling interests recorded in 2013, 2012, and 2011 were related to the Yahoo!7 venture in Australia.
Liquidity and Capital Resources
As of and for each of the years ended December 31 (dollars in thousands):
| 2012 | 2013 | |||||||
| Cash and cash equivalents |
$ | 2,667,778 | $ | 2,077,590 | ||||
| Short-term marketable securities |
1,516,175 | 1,330,304 | ||||||
| Long-term marketable securities |
1,838,425 | 1,589,500 | ||||||
|
|
|
|
|
|||||
| Total cash, cash equivalents, and marketable securities |
$ | 6,022,378 | $ | 4,997,394 | ||||
|
|
|
|
|
|||||
| Percentage of total assets |
35% | 30% | ||||||
|
|
|
|
|
|||||
| Cash Flow Highlights |
2011 | 2012 | 2013 | |||||||||
| Net cash provided by (used in) operating activities |
$ | 1,323,806 | $ | (281,554 | ) | $ | 1,195,247 | |||||
| Net cash provided by (used in) investing activities |
$ | 202,362 | $ | 3,362,044 | $ | (23,221 | ) | |||||
| Net cash used in financing activities |
$ | (1,455,958 | ) | $ | (1,979,457 | ) | $ | (1,743,884 | ) | |||
Our operating activities for 2011, 2012, and 2013 have generated adequate cash to meet our operating needs.
As of December 31, 2013, we had cash, cash equivalents, and marketable securities totaling $5 billion, compared to $6 billion as of December 31, 2012. During the year ended December 31, 2013, we received net proceeds of $1.4 billion from the issuance of the Notes and net proceeds of $290 million from the settlement of derivative hedge contracts. This was offset by the repurchase of approximately 129 million shares of our outstanding common stock for $3.3 billion during the year ended December 31, 2013.
As of December 31, 2012, we had cash, cash equivalents, and marketable securities totaling $6.0 billion, compared to $2.5 billion as of December 31, 2011. The increase was due to cash proceeds, net of fees, of $6.2 billion received from the sale of Alibaba Group Shares and $550 million from the TIPLA payment. This was
59
partially offset by the repurchase of approximately 126 million shares of our outstanding common stock for $2.2 billion during the year ended December 31, 2012 and cash taxes paid of $2.3 billion in 2012 related to the sale of Alibaba Group Shares. After the payment of taxes and fees, net cash proceeds from the Initial Repurchase and the $550 million TIPLA payment were approximately $4.3 billion.
Our foreign subsidiaries held $593 million of our total $5 billion of cash and cash equivalents and marketable securities as of December 31, 2013. During the year ended December 31, 2012, we recorded the tax effect of a one-time distribution of earnings from certain foreign subsidiaries. We made a one-time repatriation of foreign earnings and return of basis of foreign subsidiaries of $962 million from certain of our consolidated foreign subsidiaries in 2012. The cumulative earnings remaining in our consolidated foreign subsidiaries, if repatriated to the U.S., under current law, would be subject to the U.S. income taxes with an adjustment for foreign tax credits. For the earnings that are considered indefinitely reinvested outside the U.S, we do not anticipate a need to repatriate these earnings for use in our U.S. operations.
On October 19, 2012, we entered into a credit agreement (the Credit Agreement) with Citibank, N.A., as Administrative Agent, and the other lenders party thereto from time to time, which was scheduled to mature on October 18, 2013. On October 10, 2013, we entered into Amendment No. 1 to the Credit Agreement, which extended the termination date of the Credit Agreement from October 18, 2013 to October 9, 2014. During the three months ended September 30, 2013, we borrowed $150 million under the Credit Agreement and subsequently repaid the amount within the same period. As of December 31, 2013, we were in compliance with the financial covenants in the Credit Agreement and no amounts were outstanding. See Note 10Credit Agreement in the Notes to our consolidated financial statements for additional information regarding our Credit Agreement.
We invest excess cash predominantly in marketable securities, money market funds, and time deposits that are liquid, highly rated, and the majority of which have effective maturities of less than one year. Our marketable securities are classified as available-for-sale and are reported at fair value, with unrealized gains and losses, net of tax, recorded in accumulated other comprehensive income. Realized gains or losses and declines in value judged to be other-than-temporary, if any, on available-for-sale securities are reported in other income, net. The fair value for securities is determined based on quoted market prices of the historical underlying security or from readily available pricing sources for the identical underlying securities that may not be actively traded as of the valuation date. As of December 31, 2013, certain of our marketable securities had a fair value below cost due primarily to the changes in market rates of interest and yields on these securities. We evaluate these investments periodically for possible other-than-temporary impairment. We have no current requirement or intent to sell these securities. We expect to recover up to (or beyond) the initial cost of the investment.
We currently hedge a portion of our net investment in Yahoo Japan with forward contracts to reduce the risk that our investment in Yahoo Japan will be adversely affected by foreign currency exchange rate fluctuations. The forward contracts are required to be settled in cash and the amount of cash payment we receive or could be required to pay upon settlement could be material. In 2013, we received $304 million in cash settlement of certain foreign exchange forward contracts designated as net investment hedges reducing the outstanding notional amount to $1.3 billion.
We expect to continue to evaluate possible acquisitions of, or strategic investments in, businesses, products, and technologies that are complementary to our business, which acquisitions and investments may require the use of cash.
We expect to generate positive cash flows from operations in 2014. We use cash generated by operations as our primary source of liquidity, since we believe that internally generated cash flows are sufficient to support our business operations and capital expenditures. We believe that existing cash, cash equivalents, and investments in marketable securities, together with any cash generated from operations, proceeds from the issuance of the Notes, and borrowings under the Credit Agreement, will be sufficient to meet normal operating requirements including capital expenditures for the next twelve months.
60
See Note 2Investments and Fair Value Measurements in the Notes to our consolidated financial statements for additional information.
Cash Flow Changes
Cash provided by operating activities is driven by our net income, adjusted for non-cash items, working capital changes and dividends received from equity investees. Non-cash adjustments include depreciation, amortization of intangible assets, accretion of convertible notes discount, stock-based compensation expense, non-cash restructuring charges, non-cash goodwill impairment charges, tax benefits from stock-based awards, excess tax benefits from stock-based awards, deferred income taxes, and earnings in equity interests. For the year ended December 31, 2013, operating activities provided $1.2 billion in cash. We generated adjusted EBITDA of $1.6 billion and received dividends of $135 million, which were partially offset by changes in working capital: accrued expenses and other liabilities decreased $99 million, accounts payable decreased $8 million, and deferred revenue decreased $150 million, partially offset by a decrease in accounts receivable of $26 million and a decrease in prepaid expenses and other of $27 million. We had a net use of cash in the year ended December 31, 2012 primarily due to a cash tax payment of $2.3 billion related to the sale of Alibaba Group Shares. Offsetting this use, we generated adjusted EBITDA of $1.7 billion, received a payment from Alibaba Group of $550 million in satisfaction of certain future royalty payments, and received dividends from Yahoo Japan of $84 million. For the year end December 31, 2011, operating activities provided $1.3 billion in cash. We generated adjusted EBITDA of $1.7 billion and received dividends of $75 million, which was partially offset by changes in working capital: accrued expenses and other liabilities decreased $290 million, deferred revenue decreased $74 million, partially offset by a decrease in accounts receivable of $38 million and a decrease in prepaid expenses and other of $98 million.
Cash provided by (used in) investing activities is primarily attributable to sales and maturities of marketable securities, sales of other assets, including our strategic investments, acquisitions, purchases of marketable securities, capital expenditures, and purchases of intangible assets. During the year ended December 31, 2013, the $23 million used in investing activities was due to purchases of marketable securities of $3.2 billion, $338 million used for capital expenditures, $1.2 billion used for acquisitions, $3 million used for purchases of intangible assets, and $2 million used for other investing activities, net offset by net proceeds from sales and maturities of marketable securities of $3.6 billion, $800 million received from the redemption of the Alibaba Group Preference Shares, $80 million from sales of patents, and $290 million from the settlement of foreign exchange contracts (including the settlement of certain foreign exchange forward contracts designated as net investment hedges). During the year ended December 31, 2012, the $3.4 billion provided by investing activities was due to cash proceeds, net of fees, of $6.2 billion received from our sale of Alibaba Group Shares and proceeds from the sale of investments and other investing activities of $26 million. This was partially offset by $2.4 billion utilized for net purchases of marketable securities, $506 million used from capital expenditures, $6 million used for acquisitions, and $4 million used for the purchase of intangible assets. During the year ended December 31, 2011, the $202 million provided by investing activities was due to net proceeds from sales, maturities, and purchases of marketable securities of $1.1 billion, and proceeds from sale of investments of $21 million. This was partially offset by $593 million used from capital expenditures, $324 million used for acquisitions, $12 million used for the purchase of intangible assets, and $7 million used for other investing activities.
Cash used in financing activities is driven by stock repurchases offset by employee stock option exercises and employee stock purchases. During the year ended December 31, 2013, the $1.7 billion used in financing activities was due to $3.3 billion used for the repurchase of 129 million shares of common stock at an average price of $25.95 per share, $206 million used to purchase note hedges, and $149 million used for tax withholding payments related to net share settlements of restricted stock units and other financing activities. This use of cash was partially offset by $1.4 billion in cash proceeds from issuance of the Notes, $125 million in cash proceeds from the issuance of warrants, $353 million in cash proceeds received from employee stock option exercises and employee stock purchases made through our employee stock purchase plan, and an excess tax benefit from stock-based awards of $64 million. During the year ended December 31, 2012, the $2 billion used in financing
61
activities was due to $2.2 billion used for the repurchase of 126 million shares of our common stock at an average price of $17.20 per share, $61 million for tax withholding payments related to net share settlements of restricted stock units, and $5 million for other financing activities. This use of cash was partially offset by $218 million in cash proceeds from employee stock option exercises and employee stock purchases made through our employee stock purchase plan, and an excess tax benefit from stock-based awards of $36 million. During the year ended December 31, 2011, the $1.5 billion used in financing activities was due to $1.6 billion used for the repurchase of 110 million shares of our common stock at an average price of $14.75 per share, $45 million for tax withholding payments related to net share settlements of restricted stock units, and $19 million for other financing activities. This use of cash was partially offset by $156 million in cash proceeds from employee stock option exercises and employee stock purchases made through our employee stock purchase plan, and an excess tax benefit from stock-based awards of $71 million.
In 2013, 2012, and 2011, $64 million, $36 million, and $71 million, respectively, of excess tax benefits from stock-based awards for options exercised in current and prior periods were included as a source of cash flows from financing activities. These excess tax benefits represent the reduction in income taxes otherwise payable during the period, attributable to the actual gross tax benefits in excess of the expected tax benefits for options exercised in current and prior periods. We have accumulated excess tax deductions relating to stock options exercised prior to January 1, 2006 available to reduce income taxes otherwise payable. To the extent such deductions reduce income taxes payable in the current year, they are reported as financing activities in the consolidated statements of cash flows. See Note 14Employee Benefits in the Notes to our consolidated financial statements for additional information.
Stock Repurchases
In June 2010, the Board authorized a stock repurchase program allowing us to repurchase up to $3 billion of our outstanding shares of common stock from time to time. That repurchase program, which by its terms would have expired in June 2013, was exhausted during the third quarter of 2012. In May 2012, the Board authorized a stock repurchase program allowing us to repurchase up to an additional $5 billion of our outstanding shares of common stock from time to time (this amount includes the $3.65 billion we committed to return to our shareholders from the Initial Repurchase proceeds). The May 2012 repurchase program, according to its terms, will expire in June 2015. In November 2013, the Board authorized a stock repurchase program allowing us to repurchase up to an additional $5 billion of our outstanding shares of common stock from time to time. The November 2013 repurchase program, according to its terms, will expire in December 2016. Repurchases under the repurchase programs may take place in the open market or in privately negotiated transactions, including derivative transactions, and may be made under a Rule 10b5-1 plan. During the year ended December 31, 2013, we repurchased approximately 129 million shares of our common stock under the May 2012 stock repurchase program at an average price of $25.95 per share for a total of approximately $3.3 billion. These repurchases included the repurchase of 40 million shares of our common stock beneficially owned by Third Point LLC on July 25, 2013. These shares were repurchased pursuant to a Purchase Agreement entered into on July 22, 2013, prior to the market opening for trading in Yahoo stock, at $29.11 per share, which was the closing price of our common stock on July 19, 2013. The total purchase price for these shares was $1.2 billion. The repurchase transaction was funded primarily with cash as well as borrowings of $150 million under our Credit Agreement that have been repaid.
62
Repurchase Capacity under Approved Programs
| June 2010 Program |
May 2012 Program |
November 2013 Program |
Total | |||||||||||||
| (dollars in millions) | ||||||||||||||||
| January 1, 2011 |
$ | 2,224 | $ | | $ | | $ | 2,224 | ||||||||
| Total 2011 Repurchases |
(1,619 | ) | | | (1,619 | ) | ||||||||||
|
|
|
|
|
|
|
|
|
|||||||||
| December 31, 2011 |
$ | 605 | $ | | $ | | $ | 605 | ||||||||
|
|
|
|
|
|
|
|
|
|||||||||
| Authorized Share Repurchase amount under May 2012 Program |
| 5,000 | | 5,000 | ||||||||||||
| Total 2012 Repurchases |
(605 | ) | (1,562 | ) | | (2,167 | ) | |||||||||
|
|
|
|
|
|
|
|
|
|||||||||
| December 31, 2012 |
$ | | $ | 3,438 | $ | | $ | 3,438 | ||||||||
|
|
|
|
|
|
|
|
|
|||||||||
| Authorized Share Repurchase amount under November 2013 Program |
| | 5,000 | 5,000 | ||||||||||||
| Total 2013 Repurchases |
| (3,345 | ) | | (3,345 | ) | ||||||||||
|
|
|
|
|
|
|
|
|
|||||||||
| December 31, 2013 |
$ | | $ | 93 | $ | 5,000 | $ | 5,093 | ||||||||
|
|
|
|
|
|
|
|
|
|||||||||
Capital Expenditures
Capital expenditures are generally comprised of purchases of computer hardware, software, server equipment, furniture and fixtures, real estate, and capitalized software and labor.
Capital expenditures, net were $593 million in 2011, $506 million in 2012, and $338 million in 2013. Capital expenditures declined $168 million in 2013, as compared to 2012, due to a decline in spending and capitalizable projects as well as purchases in late 2012 which fulfilled certain purchasing needs for 2013. This was partially offset by incremental data center construction costs. Capital expenditures declined $87 million in 2012, as compared to 2011, due to a decline in data center construction costs and workplace construction, which was partially offset by incremental hardware spend.
We expect capital expenditures, net to increase in 2014 from the amount recorded in 2013 as a result of increased investment initiatives.
Contractual Obligations and Commitments
The following table presents certain payments due under contractual obligations with minimum firm commitments as of December 31, 2013 (dollars in millions):
| Payments Due by Period | ||||||||||||||||||||
| Total | Due in 2014 |
Due in 2015-2016 |
Due in 2017-2018 |
Thereafter | ||||||||||||||||
| Convertible notes(1) |
$ | 1,438 | $ | | $ | | $ | 1,438 | $ | | ||||||||||
| Operating lease obligations(2)(3) |
532 | 141 | 178 | 91 | 122 | |||||||||||||||
| Capital lease obligation |
58 | 15 | 21 | 18 | 4 | |||||||||||||||
| Affiliate commitments(4) |
24 | 13 | 11 | | | |||||||||||||||
| Non-cancelable obligations(5) |
198 | 101 | 84 | 13 | | |||||||||||||||
| Intellectual property rights(6) |
25 | 5 | 10 | 5 | 5 | |||||||||||||||
| Uncertain tax positions, including interest and penalties(7) |
675 | | | | 675 | |||||||||||||||
|
|
|
|
|
|
|
|
|
|
|
|||||||||||
| Total contractual obligations |
$ | 2,950 | $ | 275 | $ | 304 | $ | 1,565 | $ | 806 | ||||||||||
|
|
|
|
|
|
|
|
|
|
|
|||||||||||
| (1) | During the year end December 31, 2013, we completed an offering of the Notes, which are due in 2018. The amount above represents the principal balance to be repaid. See Note 11Convertible Notes in the Notes to our consolidated financial statements for additional information. |
63
| (2) | We have entered into various non-cancelable operating lease agreements for our offices throughout the Americas, EMEA, and Asia Pacific regions with original lease periods up to 12 years, expiring between 2013 and 2025. See Note 12Commitments and Contingencies in the Notes to our consolidated financial statements for additional information. |
| (3) | In May 2013, we entered into a 12 year operating lease agreement for four floors of the former New York Times building in New York City with a total expected minimum lease commitment of $125 million. We have the option to renew the lease for an additional five years. The lease requires monthly payments of approximately $1 million starting in July 2015 through June 2025; however, rent expense will be recorded over the lease term commensurate with the right to control the space which began in July 2013. |
| (4) | We are obligated to make minimum payments under contracts to provide sponsored search and/or display advertising services to our Affiliates, which represent TAC. |
| (5) | We are obligated to make payments under various arrangements with vendors and other business partners, principally for marketing, bandwidth, and content arrangements. |
| (6) | We are committed to make certain payments under various intellectual property arrangements. |
| (7) | As of December 31, 2013, unrecognized tax benefits and potential interest and penalties resulted in accrued liabilities of $675 million, classified as deferred and other long-term tax liabilities, net on our consolidated balance sheets. As of December 31, 2013, the settlement period for the $675 million income tax liabilities cannot be determined. See Note 16Income Taxes in the Notes to our consolidated financial statements for additional information. |
Other Commitments. In the ordinary course of business, we may provide indemnifications of varying scope and terms to customers, vendors, lessors, joint ventures and business partners, purchasers of assets or subsidiaries and other parties with respect to certain matters, including, but not limited to, losses arising out of our breach of agreements or representations and warranties made by us, services to be provided by us, intellectual property infringement claims made by third parties or, with respect to the sale of assets or a subsidiary, matters related to our conduct of the business and tax matters prior to the sale. In addition, we have entered into indemnification agreements with our directors and certain of our officers that will require us, among other things, to indemnify them against certain liabilities that may arise by reason of their status or service as directors or officers. We have also agreed to indemnify certain former officers, directors, and employees of acquired companies in connection with the acquisition of such companies. We maintain director and officer insurance, which may cover certain liabilities arising from our obligation to indemnify our directors and officers, and former directors and officers of acquired companies, in certain circumstances. It is not possible to determine the aggregate maximum potential loss under these indemnification agreements due to the limited history of prior indemnification claims and the unique facts and circumstances involved in each particular agreement. Such indemnification agreements might not be subject to maximum loss clauses. Historically, we have not incurred material costs as a result of obligations under these agreements and we have not accrued any liabilities related to such indemnification obligations in our consolidated financial statements.
Off Balance Sheet Arrangements
As of December 31, 2013, we did not have any relationships with unconsolidated entities or financial partnerships, such as entities often referred to as structured finance or special purpose entities, which would have been established for the purpose of facilitating off-balance sheet arrangements or other contractually narrow or limited purposes. Accordingly we are not exposed to any financing, liquidity, market, or credit risk that could arise if we had engaged in such relationships. In addition, we identified no variable interests currently held in entities for which we are the primary beneficiary. In addition, as of December 31, 2013, we had no off-balance sheet arrangements that have, or are reasonably likely to have, a current or future material effect on our consolidated financial condition, results of operations, liquidity, capital expenditures or capital resources.
64
Critical Accounting Policies and Estimates
Our discussion and analysis of our financial condition and results of operations is based upon our consolidated financial statements, which have been prepared in accordance with GAAP. The preparation of these consolidated financial statements requires us to make estimates, judgments, and assumptions that affect the reported amounts of assets, liabilities, revenue and expenses, and the related disclosure of contingent assets and liabilities. We base our estimates on historical experience and on various other assumptions that we believe are reasonable under the circumstances, the results of which form the basis for making judgments about, among other things, the carrying values of assets and liabilities that are not readily apparent from other sources. Actual results may differ from these estimates.
An accounting policy is considered to be critical if it requires an accounting estimate to be made based on assumptions about matters that are highly uncertain at the time the estimate is made, and if different estimates that reasonably could have been used, or changes in the accounting estimate that are reasonably likely to occur, could materially impact the consolidated financial statements. We believe that the following critical accounting policies reflect the more significant estimates and assumptions used in the preparation of our consolidated financial statements.
Management has discussed the development and selection of these critical accounting estimates with the Audit and Finance Committee (the Audit Committee) of our Board, and the Audit Committee has reviewed the disclosure below. In addition, there are other items within our financial statements that require estimation, but are not deemed critical as defined above. Changes in estimates used in these and other items could have a material impact on our consolidated financial statements.
Revenue Recognition. Our revenue is generated from display and search advertising, and other sources. Display advertising revenue is generated from the display of graphical and non-graphical advertisements and search advertising revenue is generated from clicks on text-based links to advertisers Websites that appear primarily on search results pages, and from revenue sharing arrangements with partners for search technology and services. Other revenue consists of listings-based services revenue, transaction revenue, and fees revenue. While the majority of our revenue transactions contain standard business terms and conditions, there are certain transactions that contain contract-specific business terms and conditions. In addition, we enter into certain sales transactions that involve multiple elements (arrangements with more than one deliverable). We also enter into arrangements to purchase goods and/or services from certain customers. As a result, significant contract interpretation is sometimes required to determine the appropriate accounting for these transactions including: (1) whether an arrangement exists; (2) whether fees are fixed or determinable; (3) how the arrangement consideration should be allocated among potential multiple elements; (4) establishing selling prices for deliverables considering multiple factors; (5) when to recognize revenue on the deliverables; (6) whether all elements of the arrangement have been delivered; (7) whether the arrangement should be reported gross as a principal versus net as an agent; (8) whether we receive a separately identifiable benefit from the purchase arrangements with certain customers for which we can reasonably estimate fair value; and (9) whether the consideration received from a vendor should be characterized as revenue or a reimbursement of costs incurred. In addition, our revenue recognition policy requires an assessment as to whether collection is reasonably assured, which inherently requires us to evaluate the creditworthiness of our customers. Changes in judgments on these assumptions and estimates could materially impact the timing or amount of revenue recognition.
Income Taxes. Significant judgment is required in evaluating our uncertain tax positions and determining our provision for income taxes. See Note 16Income Taxes in the Notes to our consolidated financial statements for additional information. We establish liabilities for tax-related uncertainties based on estimates of whether, and the extent to which, additional taxes will be due. These liabilities are established when we believe that certain positions might be challenged despite our belief that our tax return positions are in accordance with applicable tax laws. We adjust these liabilities in light of changing facts and circumstances, such as the closing of a tax audit, new tax legislation, developments in case law or interactions with the tax authorities. To the extent
65
that the final tax outcome of these matters is different than the amounts recorded, such differences will affect the provision for income taxes in the period in which such determination is made. The provision for income taxes includes the effect of liability provisions and changes to reserves that are considered appropriate, as well as the related net interest and penalties.
We record a valuation allowance against certain of our deferred income tax assets if it is more likely than not that those assets will not be realized. In evaluating our ability to realize our deferred income tax assets we consider all available positive and negative evidence, including our operating results, ongoing tax planning, and forecasts of future taxable income on a jurisdiction by jurisdiction basis. In the event we were to determine that we would be able to realize these deferred income tax assets in the future, we would make an adjustment to the valuation allowance, which would reduce the provision for income taxes.
Goodwill. Goodwill is not amortized but is evaluated for impairment annually or whenever we identify certain triggering events or circumstances that would more likely than not reduce the estimated fair value of a reporting unit below its carrying amount. Events or circumstances that might indicate an interim evaluation is warranted include, among other things, unexpected adverse business conditions, regulatory changes, loss of key personnel and reporting unit and macro-economic factors. Goodwill is tested for impairment at the reporting unit level, which is one level below our operating segments.
We identified U.S. & Canada, Latin America, and Tumblr as the reporting units below the Americas operating segment; Europe and Middle East as the reporting units below the EMEA operating segment; and Taiwan, Hong Kong, Australia & New Zealand, India & South East Asia as the reporting units below the Asia Pacific operating segment. These operating segments are the same as our reportable segments.
We test for goodwill impairment as of October 31 each year. To test for impairment, we first use a qualitative approach to determine whether it is more likely than not the estimated fair value of a reporting unit is less than its carrying amount. If, after completing the qualitative assessment we determine that it is more likely than not that the estimated fair value is greater than the carrying value, then we conclude that no impairment exists, and the two-step goodwill impairment test is not required. If the two-step quantitative test is required, the first step of the quantitative test involves comparing the estimated fair value of our reporting units to their carrying values, including goodwill. If the carrying value of the reporting unit exceeds its fair value, the second step of the quantitative test is performed by comparing the carrying value of the goodwill in the reporting unit to its implied fair value. An impairment charge is recognized for the excess of the carrying value of goodwill over its implied fair value.
In 2013, for the U.S. & Canada, Latin America, Tumblr, Taiwan, Hong Kong, and Australia & New Zealand reporting units, we performed the qualitative assessment. We took into consideration events and circumstances that would impact the fair value of these reporting units, including reporting unit, industry, and macro-economic factors. Reporting unit factors that were considered included the results of the most recent impairment test, financial performance in the current year, and changes to the reporting units carrying value. For industry factors, we considered growth projections, market share, and transactions within the industry. Macroeconomic factors over the past year did not negatively impact the qualitative assessment for these reporting units. Therefore, based on the qualitative assessment, we concluded the two-step impairment test was unnecessary, and no goodwill impairment charge was required for 2013 for these reporting units.
For 2013, a quantitative assessment was performed for Europe, India & Southeast Asia, and Middle East reporting units. The fair values of these reporting units were estimated using an average of a market approach and an income approach as this combination is deemed to be the most indicative of our estimated fair value in an orderly transaction between market participants and is consistent with the methodology used for the goodwill impairment test in prior years. In addition, we ensure that the fair values estimated under these two approaches are comparable with each other. Under the market approach, we utilize publicly-traded comparable company information to determine revenue and earnings multiples that are used to value our reporting units adjusted for an
66
estimated control premium. Under the income approach, we determine fair value based on estimated future cash flows of each reporting unit discounted by an estimated weighted-average cost of capital, reflecting the overall level of inherent risk of a reporting unit and the rate of return an outside investor would expect to earn. Determining the fair value of a reporting unit is judgmental in nature and requires the use of significant estimates and assumptions, including selection of market comparables, estimated future cash flows, and discount rates.
These components are discussed below:
| | Market comparables |
We select comparable companies in the specific regions in which these reporting units operate based on similarity of type of business, primarily those involved in online advertising, relative size, financial profile, and other characteristics of those companies compared to these reporting units. Trailing and forward revenue and earnings multiples derived from these comparable companies are applied to financial metrics of these reporting units to determine their estimated fair values, adjusted for an estimated control premium.
| | Estimated future cash flows |
We base cash flow projections for each reporting unit using a forecast of cash flows and a terminal value based on the Perpetuity Growth Model. The forecast and related assumptions were derived from the most recent annual financial forecast for which the planning process commenced in our fourth quarter. Key assumptions in estimating future cash flows include, among other items, revenue and operating expense growth rates, terminal value growth rate, and capital expenditure and working capital levels.
| | Discount rates |
We employ a Weighted Average Cost of Capital (WACC) approach to determine the discount rates used in our cash flow projections. The determination of the discount rates for each reporting unit includes factors such as the risk-free rate of return and the return an outside investor would expect to earn based on the overall level of inherent risk. The determination of expected returns includes consideration of the beta (a measure of volatility) of traded securities of comparable companies and risk premiums of reporting units based on international cost of capital methods.
The components above require us to make assumptions about the timing and amount of future cash flows, growth rates and discount rates. Significant management judgment is involved in determining these estimates and assumptions, and actual results may differ from those used in valuations. Changes in these estimates and assumptions could materially affect the determination of fair value for each reporting unit which could trigger future impairment. To facilitate a better understanding of how these valuations are determined, a discussion of our significant assumptions is provided below.
Discount rate assumptions for these reporting units take into account our assessment of the risks inherent in the future cash flows of the respective reporting unit and our weighted-average cost of capital. We also review marketplace data to assess the reasonableness of our computation of our overall weighted average cost of capital and, when available, the discount rates utilized for each of these reporting units.
In determining the fair value of (1) the Europe reporting unit, (2) the India & Southeast Asia reporting unit, and (3) the Middle East reporting unit, we used the following assumptions:
| | Expected cash flows underlying our business plans for the periods 2014 through 2024. |
| | Cash flows beyond 2024 are projected to grow at a perpetual growth rate. |
| | In order to risk adjust the cash flow projections in determining fair value, we utilized discount rates of approximately 11 percent to 15 percent for each of these reporting units. |
67
Based on our quantitative assessment, we determined the estimated fair value exceeded the carrying value for the Europe reporting unit and the India & Southeast Asia reporting unit. Therefore, no goodwill impairment charge was required for 2013.
For the quantitative analysis performed for the Middle East reporting unit, the carrying value exceeded the estimated fair value. The second step of the goodwill impairment test required us to fair value all assets and liabilities of our Middle East reporting unit to determine the implied fair value of this reporting units goodwill. We compared the implied fair value of the reporting units goodwill to its carrying value. This test resulted in a non-cash goodwill impairment charge of $64 million for the year ended December 31, 2013.
See Note 5Goodwill in the Notes to our consolidated financial statements for additional information.
Long-lived Assets. We amortize long-lived assets over their estimated useful lives. Identifiable long-lived assets are reviewed for impairment whenever events or changes in circumstances indicate that the carrying value may not be recoverable. Determination of recoverability is based on the lowest level of identifiable estimated undiscounted future cash flows resulting from use of the asset and its eventual disposition. Measurement of any impairment loss is based on the excess of the carrying value of the asset over its fair value. Fair value is determined based on the lowest level of identifiable estimated future cash flows using discount rates determined by our management to be commensurate with the risk inherent in our business model. Our estimates of future cash flows attributable to our long-lived assets require significant judgment based on our historical and anticipated results and are subject to many factors. Different assumptions and judgments could materially affect estimated future cash flows relating to our long-lived assets which could trigger impairment. No impairments of long-lived assets were identified during any of the periods presented.
Investments in Equity Interests. We account for investments in the common stock of entities in which we have the ability to exercise significant influence but do not own a majority equity interest or otherwise control using the equity method. In accounting for these investments we record our proportionate share of the entities net income or loss, one quarter in arrears.
We review our investments in equity interests for impairment whenever events or changes in business circumstances indicate that the carrying value of the investment may not be fully recoverable. Investments identified as having an indication of impairment are subject to further analysis to determine if the impairment is other-than-temporary and this analysis requires estimating the fair value of the investment. The determination of fair value of the investment involves considering factors such as the stock prices of public companies in which we have an equity investment, current economic and market conditions, the operating performance of the companies, including current earnings trends and forecasted cash flows, and other company and industry specific information. The fair value determination, particularly for investments in privately-held companies, requires significant judgment to determine appropriate estimates and assumptions. Changes in these estimates and assumptions could affect the calculation of the fair value of the investments and the determination of whether any identified impairment is other-than-temporary.
Stock-Based Compensation Expense. We recognize stock-based compensation expense net of an estimated forfeiture rate and therefore only recognize compensation expense for those shares expected to vest over the service period of the award. Calculating stock-based compensation expense requires the input of highly subjective assumptions, including the expected term of the stock-based options, stock price volatility, and the pre-vesting award forfeiture rate. We estimate the expected life of options granted based on historical exercise patterns, which we believe are representative of future behavior. We estimate the volatility of our common stock on the date of grant based on the implied volatility of publicly traded options on our common stock, with a term of one year or greater. We believe that implied volatility calculated based on actively traded options on our common stock is a better indicator of expected volatility and future stock price trends than historical volatility.
68
Therefore, expected volatility for the year ended December 31, 2013 was based on a market-based implied volatility. The assumptions used in calculating the fair value of stock-based awards represent our best estimates, but these estimates involve inherent uncertainties and the application of management judgment. As a result, if factors change and we use different assumptions, our stock-based compensation expense could be materially different in the future. In addition, we are required to estimate the expected pre-vesting award forfeiture rate, as well as the probability that performance conditions that affect the vesting of certain awards will be achieved, and recognize expense only for those shares expected to vest. Performance conditions are estimated and monitored throughout the year. We estimate this forfeiture rate based on historical experience of our stock-based awards that are granted and cancelled before vesting. If our actual forfeiture rate is materially different from our original estimates, the stock-based compensation expense could be significantly different from what we have recorded in the current period. Changes in the estimated forfeiture rate can have a significant effect on reported stock-based compensation expense, as the effect of adjusting the forfeiture rate for all current and previously recognized expense for unvested awards is recognized in the period the forfeiture estimate is changed. If the actual forfeiture rate is higher than the estimated forfeiture rate, then an adjustment will be made to increase the estimated forfeiture rate, which will result in a decrease to the expense recognized in our consolidated financial statements. If the actual forfeiture rate is lower than the estimated forfeiture rate, then an adjustment will be made to lower the estimated forfeiture rate, which will result in an increase to the expense recognized in our consolidated financial statements. See Note 14Employee Benefits in the Notes to our consolidated financial statements for additional information.
Recent Accounting Pronouncements
See Note 1The Company and Summary of Significant Accounting Policies in the Notes to our consolidated financial statements, which is incorporated herein by reference.
| Item 7A. | Quantitative and Qualitative Disclosures About Market Risk |
We are exposed to financial market risks, including changes in currency exchange rates and interest rates and changes in the market values of our investments. We may use derivative financial instruments to mitigate certain risks in accordance with our investment and foreign exchange policies.
We generally enter into master netting arrangements, which are designed to reduce credit risk by permitting net settlement of transactions with the same counterparty. We present our derivative assets and liabilities at their gross fair values on the consolidated balance sheets.
Interest Rate Exposure
Our exposure to market risk for changes in interest rates impacts our costs associated with hedging, and primarily relates to our cash and marketable securities portfolio. We invest excess cash in money market funds, time deposits, and liquid debt instruments of the U.S. and foreign governments and their agencies, U.S. municipalities, and high-credit corporate issuers which are classified as marketable securities and cash equivalents.
In 2013, we issued $1.4375 billion of Notes due 2018. We carry the Notes at face value less unamortized discount on our balance sheet. The fair value of the Notes changes when the market price of our stock fluctuates.
Investments in fixed rate and floating rate interest earning instruments carry a degree of interest rate risk. Fixed rate securities may have their fair market value adversely impacted due to a rise in interest rates, while floating rate securities may produce less income than expected if interest rates fall. Due in part to these factors, our future investment income may fall short of expectations due to changes in interest rates or we may suffer losses in principal if forced to sell securities that have declined in market value due to changes in interest rates. A hypothetical 100 basis point increase in interest rates would result in a $15 million and $33 million decrease in the fair value of our available-for-sale debt securities as of December 31, 2013 and 2012, respectively.
69
Foreign Currency Exposure
The objective of our foreign exchange risk management program is to identify material foreign currency exposures and identify methods to manage these exposures to minimize the potential effects of currency fluctuations on our reported consolidated cash flows and results of operations. Counterparties to our derivative contracts are all major institutions.
We transact business in various foreign currencies and have international revenue, as well as costs denominated in foreign currencies. This exposes us to the risk of fluctuations in foreign currency exchange rates.
We had net realized and unrealized foreign currency transaction losses of $6 million for the year ended December 31, 2013. We had net realized and unrealized foreign currency transaction losses of $1 million and gains of $9 million for the years ended December 31, 2012 and 2011, respectively.
We categorize our foreign currency exposure as follows: (1) net investment, (2) cash flow, (3) balance sheet, (4) forecasted revenue and (5) translation.
Net Investment Exposure. We hedge, on an after-tax basis, a portion of our net investment in Yahoo Japan with forward contracts to reduce the risk that the carrying value of our investment in Yahoo Japan will be adversely affected by foreign currency exchange rate fluctuations. At inception, the forward contracts had maturities ranging from 9 to 15 months. If the Japanese yen appreciates at maturity from the forward contract execution rates, the forward contracts will require us to pay a cash settlement, which may be material. If the Japanese yen depreciates at maturity from the forward contract execution rates, we will receive a cash settlement, which may be material. We apply net investment hedge accounting and expect the hedges to be effective, allowing changes in fair value of the derivative instrument to be recorded in accumulated other comprehensive income on our consolidated balance sheets. The notional amounts of the foreign currency forward contracts related to our net investment hedge were $3 billion and $1.3 billion as of December 31, 2012 and 2013, respectively. The fair values of the foreign currency forward contracts were a $3 million asset and a $209 million asset as of December 31, 2012 and 2013, respectively, and were included in prepaid expenses and other current assets on our consolidated balance sheets. Pre-tax gains of $3 million and $510 million were recorded for the year ended December 31, 2012 and December 31, 2013, respectively, and were included in accumulated other comprehensive income on our consolidated balance sheets. We received $304 million in cash for settlement of certain foreign currency forward contracts during the year ended December 31, 2013. We did not enter into any net investment hedges in the year ended December 31, 2011.
Cash Flow Exposure. We have entered into foreign currency forward contracts designated as cash flow hedges of varying maturities through July 31, 2014. For derivatives designated as cash flow hedges, the effective portion of the unrealized gains or losses on these forward contracts is recorded in accumulated other comprehensive income on our consolidated balance sheets and reclassified into revenue on the consolidated statements of income when the underlying hedged revenue is recognized. If the cash flow hedges were to become ineffective, the ineffective portion would be immediately recorded in other income, net on our consolidated statements of income. The cash flow hedges were considered to be effective as of December 31, 2013. The total notional amount of the foreign currency forward contracts was $56 million as of December 31, 2013. The fair value of the foreign currency forward contracts was a $4 million asset as of December 31, 2013, which was included in prepaid expenses and other current assets on our consolidated balance sheets. A pre-tax net gain of $2 million was recorded as of December 31, 2013, which was included in accumulated other comprehensive income on our consolidated balance sheets. For year ended December 31, 2013, we recorded gains of $2 million, net of tax, for cash flow hedges, which were recorded in revenue in the consolidated statements of income. We received $2 million in cash for settlement of certain foreign currency forward contracts during the year ended December 31, 2013. We did not enter into any cash flow hedges in the years ended December 31, 2012 and 2011.
Balance Sheet Exposure. We hedge certain of our net recognized foreign currency assets and liabilities with foreign exchange forward contracts to reduce the risk that our earnings and cash flows will be adversely affected
70
by changes in foreign currency exchange rates. These derivative instruments hedge assets and liabilities, including intercompany transactions, which are denominated in foreign currencies. We recognize balance sheet derivative instruments as either an asset or a liability on our consolidated balance sheets at fair value. Changes in the fair value of these derivatives are recorded in other income, net on our consolidated statements of income. These derivative instruments do not subject us to material balance sheet risk due to exchange rate movements because gains and losses on these derivatives are intended to offset gains or losses on the assets and liabilities being hedged. The notional amounts of the foreign currency forward contracts were $356 million and $393 million as of December 31, 2012 and 2013, respectively. As of December 31, 2012, the fair value of the foreign currency forward contracts was a $5 million liability, which was included in accrued expenses and other current liabilities on our consolidated balance sheets. As of December 31, 2013, the fair value of the foreign currency forward contracts was a less than $1 million net liability; the contracts fair value was included in accrued expenses and other current liabilities and prepaid expenses and other current assets on our consolidated balance sheets. A loss of $3 million, a gain of $4 million, and a loss of $12 million were recorded for the years ended December 31, 2011, 2012, and 2013, respectively, and were included in other income, net on our consolidated statements of income. We received $7 million and paid $17 million in cash for settlement of certain foreign currency forward contracts during the years ended December 31, 2012 and 2013, respectively.
Forecasted Revenue Exposure. On October 2, 2013, we began hedging a portion of the forecasted revenue of international subsidiaries where the functional currencies are the Euro, Australian dollar and British pound. This program attempts to reduce the risk that our revenue denominated in these currencies will be adversely affected by foreign currency exchange rate fluctuations. These derivatives are economic hedges and as such do not qualify for hedge accounting. We recognize these derivative instruments as either assets or liabilities on our consolidated balance sheets at fair value. Changes in the fair value of these derivatives are recorded as a component of revenue in our consolidated statements of income and were not material for the year ended December 31, 2013. We did not have any derivative contracts related to the forecasted revenue hedge outstanding as of December 31, 2013. We did not enter into any forecasted revenue hedges in the years ended December 31, 2012 and 2011.
Translation Exposure. We are also exposed to foreign exchange rate fluctuations as we convert the financial statements of our foreign subsidiaries and our investments in equity interests into U.S. dollars in consolidation. If there is a change in foreign currency exchange rates, the conversion of the foreign subsidiaries financial statements into U.S. dollars results in a gain or loss which is recorded as a component of accumulated other comprehensive income which is part of stockholders equity.
A Value-at-Risk (VaR) sensitivity analysis was performed on all of our foreign currency derivative positions as of December 31, 2013 and December 31, 2012 to assess the potential impact of fluctuations in exchange rates. The VaR model uses a Monte Carlo simulation to generate thousands of random price paths assuming normal market conditions. The VaR is the maximum expected one day loss in fair value, for a given statistical confidence level, to our foreign currency derivative positions due to adverse movements in rates. The VaR model is used as a risk management tool and is not intended to represent either actual or forecasted losses. Based on the results of the model using a 99 percent confidence interval, we estimate the maximum one-day loss in fair value is $12 million and $28 million on the notional value of the net investment hedges at December 31, 2013 and 2012, respectively. The maximum one-day loss in fair value is less than $1 million on the notional value of our cash flow hedges at December 31, 2013. There were no cash flow hedges outstanding at December 31, 2012. The maximum one-day loss in fair value is $2 million on the notional value of our balance sheet hedges at December 31, 2013 compared to a $3 million loss and a $1 million loss at December 31, 2012 and 2011, respectively.
Actual future gains and losses associated with our derivative positions may differ materially from the sensitivity analysis performed as of December 31, 2013 due to the inherent limitations associated with predicting the timing and amount of changes in foreign currency exchange rates and our actual exposures and positions. In addition, the VaR sensitivity analysis may not reflect the complex market reactions that may arise from the market shifts modeled within this VaR sensitivity analysis.
71
Revenue ex-TAC and related expenses generated from our international subsidiaries are generally denominated in the currencies of the local countries. Primary currencies include Australian dollars, British pounds, Euros, Japanese yen, and Taiwan dollars. The statements of income of our international operations are translated into U.S. dollars at exchange rates indicative of market rates during each applicable period. To the extent the U.S. dollar strengthens against foreign currencies, the translation of these foreign currency-denominated transactions results in reduced consolidated revenue and operating expenses. Conversely, our consolidated revenue and operating expenses will increase if the U.S. dollar weakens against foreign currencies. Using the foreign currency exchange rates from the year ended December 31, 2012, revenue ex-TAC for the Americas segment for the year ended December 31, 2013 would have been higher than we reported by $7 million; revenue ex-TAC for the EMEA segment would have been lower than we reported by $4 million; and revenue ex-TAC for the Asia Pacific segment would have been higher than we reported by $37 million. Using the foreign currency exchange rates from the year ended December 31, 2012, direct costs for the Americas segment for the year ended December 31, 2013 would have been higher than we reported by $3 million; direct costs for the EMEA segment would have been lower than we reported by $2 million; and direct costs for the Asia Pacific segment would have been higher than we reported by $3 million.
Investment Exposure
We are exposed to investment risk as it relates to changes in the market value of our investments. We have investments in marketable securities and equity instruments of public and private companies.
Our cash and marketable securities investment policy and strategy attempts primarily to preserve capital and meet liquidity requirements. A large portion of our cash is managed by external managers within the guidelines of our investment policy. We protect and preserve invested funds by limiting default, market, and reinvestment risk. To achieve this objective, we maintain our portfolio of cash and cash equivalents and short-term and long-term investments in a variety of liquid fixed income securities, including both government and corporate obligations and money market funds. As of December 31, 2012 and 2013, net unrealized gains and losses on these investments were not material.
72
| Item 8. | Financial Statements and Supplementary Data |
| Page | ||||
| Index to Consolidated Financial Statements |
||||
| Consolidated Financial Statements: |
||||
| 74 | ||||
| Consolidated Balance Sheets as of December 31, 2012 and 2013 |
75 | |||
| Consolidated Statements of Income for each of the three years in the period ended December 31, 2013 |
76 | |||
| 77 | ||||
| 78 | ||||
| 80 | ||||
| 82 | ||||
| Financial Statement Schedules: |
||||
| 131 | ||||
| All other schedules are omitted because they are not applicable or the required information is shown in the Consolidated Financial Statements or Notes thereto |
||||
| Supplementary Financial Data: |
||||
| Selected Quarterly Financial Data (unaudited) for the two years ended December 31, 2013 |
132 | |||
73
Report of Independent Registered Public Accounting Firm
To the Board of Directors and Stockholders of Yahoo! Inc.:
In our opinion, the consolidated financial statements listed in the accompanying index present fairly, in all material respects, the financial position of Yahoo! Inc. and its subsidiaries at December 31, 2012 and December 31, 2013, and the results of their operations and their cash flows for each of the three years in the period ended December 31, 2013 in conformity with accounting principles generally accepted in the United States of America. In addition, in our opinion, the financial statement schedule listed in the accompanying index presents fairly, in all material respects, the information set forth therein when read in conjunction with the related consolidated financial statements. Also in our opinion, the Company maintained, in all material respects, effective internal control over financial reporting as of December 31, 2013, based on criteria established in Internal ControlIntegrated Framework (1992) issued by the Committee of Sponsoring Organizations of the Treadway Commission (COSO). The Companys management is responsible for these financial statements and financial statement schedule, for maintaining effective internal control over financial reporting and for its assessment of the effectiveness of internal control over financial reporting, included in Managements Report on Internal Control Over Financial Reporting appearing under Item 9A. Our responsibility is to express opinions on these financial statements, on the financial statement schedule, and on the Companys internal control over financial reporting based on our integrated audits. We conducted our audits in accordance with the standards of the Public Company Accounting Oversight Board (United States). Those standards require that we plan and perform the audits to obtain reasonable assurance about whether the financial statements are free of material misstatement and whether effective internal control over financial reporting was maintained in all material respects. Our audits of the financial statements included examining, on a test basis, evidence supporting the amounts and disclosures in the financial statements, assessing the accounting principles used and significant estimates made by management, and evaluating the overall financial statement presentation. Our audit of internal control over financial reporting included obtaining an understanding of internal control over financial reporting, assessing the risk that a material weakness exists, and testing and evaluating the design and operating effectiveness of internal control based on the assessed risk. Our audits also included performing such other procedures as we considered necessary in the circumstances. We believe that our audits provide a reasonable basis for our opinions.
A companys internal control over financial reporting is a process designed to provide reasonable assurance regarding the reliability of financial reporting and the preparation of financial statements for external purposes in accordance with generally accepted accounting principles. A companys internal control over financial reporting includes those policies and procedures that (i) pertain to the maintenance of records that, in reasonable detail, accurately and fairly reflect the transactions and dispositions of the assets of the company; (ii) provide reasonable assurance that transactions are recorded as necessary to permit preparation of financial statements in accordance with generally accepted accounting principles, and that receipts and expenditures of the company are being made only in accordance with authorizations of management and directors of the company; and (iii) provide reasonable assurance regarding prevention or timely detection of unauthorized acquisition, use, or disposition of the companys assets that could have a material effect on the financial statements.
Because of its inherent limitations, internal control over financial reporting may not prevent or detect misstatements. Also, projections of any evaluation of effectiveness to future periods are subject to the risk that controls may become inadequate because of changes in conditions, or that the degree of compliance with the policies or procedures may deteriorate.
/s/ PricewaterhouseCoopers LLP
San Jose, California
February 28, 2014
74
Yahoo! Inc.
| December 31, | ||||||||
| 2012 | 2013 | |||||||
| (in thousands, except par values) | ||||||||
| ASSETS | ||||||||
| Current assets: |
||||||||
| Cash and cash equivalents |
$ | 2,667,778 | $ | 2,077,590 | ||||
| Short-term marketable securities |
1,516,175 | 1,330,304 | ||||||
| Accounts receivable, net of allowance of $32,635 and $35,549 as of December 31, 2012 and 2013, respectively |
1,008,448 | 979,559 | ||||||
| Prepaid expenses and other current assets |
460,312 | 638,404 | ||||||
|
|
|
|
|
|||||
| Total current assets |
5,652,713 | 5,025,857 | ||||||
| Long-term marketable securities |
1,838,425 | 1,589,500 | ||||||
| Alibaba Group Preference Shares |
816,261 | | ||||||
| Property and equipment, net |
1,685,845 | 1,488,518 | ||||||
| Goodwill |
3,826,749 | 4,679,648 | ||||||
| Intangible assets, net |
153,973 | 417,808 | ||||||
| Other long-term assets |
289,130 | 177,281 | ||||||
| Investments in equity interests |
2,840,157 | 3,426,347 | ||||||
|
|
|
|
|
|||||
| Total assets |
$ | 17,103,253 | $ | 16,804,959 | ||||
|
|
|
|
|
|||||
| LIABILITIES AND EQUITY | ||||||||
| Current liabilities: |
||||||||
| Accounts payable |
$ | 184,831 | $ | 138,031 | ||||
| Accrued expenses and other current liabilities |
808,475 | 907,782 | ||||||
| Deferred revenue |
296,926 | 294,499 | ||||||
|
|
|
|
|
|||||
| Total current liabilities |
1,290,232 | 1,340,312 | ||||||
| Convertible notes |
| 1,110,585 | ||||||
| Long-term deferred revenue |
407,560 | 258,904 | ||||||
| Capital lease and other long-term liabilities |
124,587 | 116,605 | ||||||
| Deferred and other long-term tax liabilities, net |
675,271 | 847,956 | ||||||
|
|
|
|
|
|||||
| Total liabilities |
2,497,650 | 3,674,362 | ||||||
| Commitments and contingencies (Note 12) |
| | ||||||
| Yahoo! Inc. stockholders equity: |
||||||||
| Preferred stock, $0.001 par value; 10,000 shares authorized; none issued or outstanding |
| | ||||||
| Common stock, $0.001 par value; 5,000,000 shares authorized; 1,189,816 shares issued and 1,115,233 shares outstanding as of December 31, 2012, and 1,019,812 shares issued and 1,014,338 shares outstanding as of December 31, 2013 |
1,187 | 1,015 | ||||||
| Additional paid-in capital |
9,563,348 | 8,688,304 | ||||||
| Treasury stock at cost, 74,583 shares as of December 31, 2012, and 5,474 shares as of December 31, 2013 |
(1,368,043 | ) | (200,228 | ) | ||||
| Retained earnings |
5,792,459 | 4,267,429 | ||||||
| Accumulated other comprehensive income |
571,249 | 318,389 | ||||||
|
|
|
|
|
|||||
| Total Yahoo! Inc. stockholders equity |
14,560,200 | 13,074,909 | ||||||
| Noncontrolling interests |
45,403 | 55,688 | ||||||
|
|
|
|
|
|||||
| Total equity |
14,605,603 | 13,130,597 | ||||||
|
|
|
|
|
|||||
| Total liabilities and equity |
$ | 17,103,253 | $ | 16,804,959 | ||||
|
|
|
|
|
|||||
The accompanying notes are an integral part of these consolidated financial statements.
75
Yahoo! Inc.
Consolidated Statements of Income
| Years Ended December 31, | ||||||||||||
| 2011 | 2012 | 2013 | ||||||||||
| (in thousands, except per share amounts) | ||||||||||||
| Revenue |
$ | 4,984,199 | $ | 4,986,566 | $ | 4,680,380 | ||||||
| Operating expenses: |
||||||||||||
| Cost of revenuetraffic acquisition costs |
603,371 | 518,906 | 254,442 | |||||||||
| Cost of revenueother |
983,626 | 1,101,660 | 1,094,938 | |||||||||
| Sales and marketing |
1,122,193 | 1,101,572 | 1,130,820 | |||||||||
| Product development |
919,368 | 885,824 | 1,008,487 | |||||||||
| General and administrative |
497,288 | 540,247 | 569,555 | |||||||||
| Amortization of intangibles |
33,592 | 35,819 | 44,841 | |||||||||
| Gains on sales of patents |
| | (79,950 | ) | ||||||||
| Goodwill impairment charge |
| | 63,555 | |||||||||
| Restructuring charges, net |
24,420 | 236,170 | 3,766 | |||||||||
|
|
|
|
|
|
|
|||||||
| Total operating expenses |
4,183,858 | 4,420,198 | 4,090,454 | |||||||||
|
|
|
|
|
|
|
|||||||
| Income from operations |
800,341 | 566,368 | 589,926 | |||||||||
| Other income, net |
27,175 | 4,647,839 | 43,357 | |||||||||
|
|
|
|
|
|
|
|||||||
| Income before income taxes and earnings in equity interests |
827,516 | 5,214,207 | 633,283 | |||||||||
| Provision for income taxes |
(241,767 | ) | (1,940,043 | ) | (153,392 | ) | ||||||
| Earnings in equity interests |
476,920 | 676,438 | 896,675 | |||||||||
|
|
|
|
|
|
|
|||||||
| Net income |
1,062,669 | 3,950,602 | 1,376,566 | |||||||||
| Less: Net income attributable to noncontrolling interests |
(13,842 | ) | (5,123 | ) | (10,285 | ) | ||||||
|
|
|
|
|
|
|
|||||||
| Net income attributable to Yahoo! Inc. |
$ | 1,048,827 | $ | 3,945,479 | $ | 1,366,281 | ||||||
|
|
|
|
|
|
|
|||||||
| Net income attributable to Yahoo! Inc. common stockholders per sharebasic |
$ | 0.82 | $ | 3.31 | $ | 1.30 | ||||||
|
|
|
|
|
|
|
|||||||
| Net income attributable to Yahoo! Inc. common stockholders per sharediluted |
$ | 0.82 | $ | 3.28 | $ | 1.26 | ||||||
|
|
|
|
|
|
|
|||||||
| Shares used in per share calculationbasic |
1,274,240 | 1,192,775 | 1,052,705 | |||||||||
|
|
|
|
|
|
|
|||||||
| Shares used in per share calculationdiluted |
1,282,282 | 1,202,906 | 1,070,811 | |||||||||
|
|
|
|
|
|
|
|||||||
| Stock-based compensation expense by function: |
||||||||||||
| Cost of revenueother |
$ | 12,017 | $ | 10,078 | $ | 15,545 | ||||||
| Sales and marketing |
65,176 | 82,115 | 101,852 | |||||||||
| Product development |
80,668 | 74,284 | 83,396 | |||||||||
| General and administrative |
46,097 | 57,888 | 77,427 | |||||||||
| Restructuring expense accelerations (reversals), net |
214 | (3,429 | ) | | ||||||||
The accompanying notes are an integral part of these consolidated financial statements.
76
Yahoo! Inc.
Consolidated Statements of Comprehensive Income
| Years Ended December 31, | ||||||||||||
| 2011 | 2012 | 2013 | ||||||||||
| (in thousands) | ||||||||||||
| Comprehensive income |
||||||||||||
| Net income |
$ | 1,062,669 | $ | 3,950,602 | $ | 1,376,566 | ||||||
|
|
|
|
|
|
|
|||||||
| Available-for-sale securities: |
||||||||||||
| Unrealized (losses) gains on available-for-sale securities, net of taxes of $8,518, $(86), and $(1,724) for 2011, 2012, and 2013, respectively |
(17,244 | ) | 7,571 | 6,776 | ||||||||
| Reclassification adjustment for realized losses (gains) on availablefor-sale securities included in net income, net of taxes of $(648), $(5,197), and $479 for 2011, 2012, and 2013, respectively |
972 | 9,088 | (796 | ) | ||||||||
|
|
|
|
|
|
|
|||||||
| Net change in unrealized gains (losses) on available-for-sale securities, net of tax |
(16,272 | ) | 16,659 | 5,980 | ||||||||
|
|
|
|
|
|
|
|||||||
| Foreign currency translation adjustments (CTA): |
||||||||||||
| Foreign CTA gains (losses), net of taxes of $101, $(143), and $496 for 2011, 2012, and 2013, respectively |
209,887 | (9,334 | ) | (577,711 | ) | |||||||
| Net investment hedge CTA gains (losses), net of taxes of $0 for both of 2011 and 2012 and $(193) million for 2013 |
| 3,241 | 317,459 | |||||||||
| Reclassification adjustment for CTA, net of taxes of $0, $68 million, and $0 for 2011, 2012, and 2013 respectively |
| (137,186 | ) | | ||||||||
|
|
|
|
|
|
|
|||||||
| Net foreign CTA gains (losses), net of tax |
209,887 | (143,279 | ) | (260,252 | ) | |||||||
|
|
|
|
|
|
|
|||||||
| Cash flow hedges: |
||||||||||||
| Unrealized gains (losses) on cash flow hedges, net of taxes of $0 for both of 2011 and 2012, and $(1,199) for 2013 |
| | 3,492 | |||||||||
| Reclassification adjustment for realized (gains) losses on cash flow hedges, net of taxes of $0 for both of 2011 and 2012, and $575 for 2013 |
| | (2,080 | ) | ||||||||
|
|
|
|
|
|
|
|||||||
| Net change in unrealized gains (losses) on cash flow hedges, net of tax |
| | 1,412 | |||||||||
|
|
|
|
|
|
|
|||||||
| Other comprehensive income (loss) |
193,615 | (126,620 | ) | (252,860 | ) | |||||||
|
|
|
|
|
|
|
|||||||
| Comprehensive income |
1,256,284 | 3,823,982 | 1,123,706 | |||||||||
| Less: Comprehensive income attributable to noncontrolling interests |
(13,842 | ) | (5,123 | ) | (10,285 | ) | ||||||
|
|
|
|
|
|
|
|||||||
| Comprehensive income attributable to Yahoo! Inc. |
$ | 1,242,442 | $ | 3,818,859 | $ | 1,113,421 | ||||||
|
|
|
|
|
|
|
|||||||
The accompanying notes are an integral part of these consolidated financial statements.
77
Yahoo! Inc.
Consolidated Statements of Stockholders Equity
| Years Ended December 31, | ||||||||||||
| 2011 | 2012 | 2013 | ||||||||||
| (in thousands) | ||||||||||||
| Common stock |
||||||||||||
| Balance, beginning of year |
$ | 1,306 | $ | 1,242 | $ | 1,187 | ||||||
| Common stock issued |
18 | 24 | 26 | |||||||||
| Common stock retired |
(82 | ) | (79 | ) | (198 | ) | ||||||
|
|
|
|
|
|
|
|||||||
| Balance, end of year |
1,242 | 1,187 | 1,015 | |||||||||
|
|
|
|
|
|
|
|||||||
| Additional paid-in capital |
||||||||||||
| Balance, beginning of year |
10,109,913 | 9,825,899 | 9,563,348 | |||||||||
| Common stock and stock-based awards issued |
156,211 | 218,349 | 353,241 | |||||||||
| Stock-based compensation expense |
226,270 | 244,653 | 294,408 | |||||||||
| Tax benefits (detriments) from stock-based awards |
33,497 | (31,440 | ) | 49,061 | ||||||||
| Tax withholdings related to net share settlements of restricted stock awards |
(44,593 | ) | (60,939 | ) | (139,815 | ) | ||||||
| Retirement of treasury stock |
(643,401 | ) | (630,639 | ) | (1,620,704 | ) | ||||||
| Equity component of convertible senior notes, net |
| | 268,084 | |||||||||
| Purchase of note hedges |
| | (205,706 | ) | ||||||||
| Issuance of warrants |
| | 124,775 | |||||||||
| Other |
(11,998 | ) | (2,535 | ) | 1,612 | |||||||
|
|
|
|
|
|
|
|||||||
| Balance, end of year |
9,825,899 | 9,563,348 | 8,688,304 | |||||||||
|
|
|
|
|
|
|
|||||||
| Treasury stock |
||||||||||||
| Balance, beginning of year |
| (416,237 | ) | (1,368,043 | ) | |||||||
| Repurchases of common stock |
(1,618,741 | ) | (2,167,841 | ) | (3,344,396 | ) | ||||||
| Tax withholdings related to net share settlements of restricted stock awards |
(168 | ) | | | ||||||||
| Retirement of treasury stock |
1,202,672 | 1,216,035 | 4,512,211 | |||||||||
|
|
|
|
|
|
|
|||||||
| Balance, end of year |
(416,237 | ) | (1,368,043 | ) | (200,228 | ) | ||||||
|
|
|
|
|
|
|
|||||||
| Retained earnings |
||||||||||||
| Balance, beginning of year |
1,942,656 | 2,432,294 | 5,792,459 | |||||||||
| Net income attributable to Yahoo! Inc. |
1,048,827 | 3,945,479 | 1,366,281 | |||||||||
| Retirement of treasury stock |
(559,189 | ) | (585,314 | ) | (2,891,311 | ) | ||||||
|
|
|
|
|
|
|
|||||||
| Balance, end of year |
2,432,294 | 5,792,459 | 4,267,429 | |||||||||
|
|
|
|
|
|
|
|||||||
| Accumulated other comprehensive income |
||||||||||||
| Balance, beginning of year |
504,254 | 697,869 | 571,249 | |||||||||
| Net change in unrealized gains (losses) on available-for-sale securities, net of tax |
(16,272 | ) | 16,659 | 5,980 | ||||||||
| Net change in unrealized gains on cash flow hedges, net of tax |
| | 1,412 | |||||||||
| Foreign currency translation adjustments, net of tax |
209,887 | (143,279 | ) | (260,252 | ) | |||||||
|
|
|
|
|
|
|
|||||||
| Balance, end of year |
697,869 | 571,249 | 318,389 | |||||||||
|
|
|
|
|
|
|
|||||||
| Total Yahoo! Inc. stockholders equity |
$ | 12,541,067 | $ | 14,560,200 | $ | 13,074,909 | ||||||
|
|
|
|
|
|
|
|||||||
The accompanying notes are an integral part of these consolidated financial statements.
78
Yahoo! Inc.
Consolidated Statements of Stockholders Equity
(Continued)
| Years Ended December 31, | ||||||||||||
| 2011 | 2012 | 2013 | ||||||||||
| Number of Outstanding Shares | ||||||||||||
| (in thousands) | ||||||||||||
| Common stock |
||||||||||||
| Balance, beginning of year |
1,308,836 | 1,217,481 | 1,115,233 | |||||||||
| Common stock and restricted stock issued |
18,371 | 23,773 | 26,401 | |||||||||
| Restricted stock issued under compensation arrangements |
| | 1,567 | |||||||||
| Repurchases of common stock |
(109,716 | ) | (126,021 | ) | (128,863 | ) | ||||||
| Tax withholdings related to net share settlements of restricted stock awards |
(10 | ) | | | ||||||||
|
|
|
|
|
|
|
|||||||
| Balance, end of year |
1,217,481 | 1,115,233 | 1,014,338 | |||||||||
|
|
|
|
|
|
|
|||||||
The accompanying notes are an integral part of these consolidated financial statements.
79
Yahoo! Inc.
Consolidated Statements of Cash Flows
| Years Ended December 31, | ||||||||||||
| 2011 | 2012 | 2013 | ||||||||||
| (in thousands) | ||||||||||||
| CASH FLOWS FROM OPERATING ACTIVITIES: |
||||||||||||
| Net income |
$ | 1,062,669 | $ | 3,950,602 | $ | 1,376,566 | ||||||
| Adjustments to reconcile net income to net cash provided by (used in) operating activities: |
||||||||||||
| Depreciation |
530,516 | 549,235 | 532,485 | |||||||||
| Amortization of intangible assets |
117,723 | 105,366 | 96,518 | |||||||||
| Accretion of convertible notes discount |
| | 4,846 | |||||||||
| Stock-based compensation expense, net |
204,172 | 220,936 | 278,220 | |||||||||
| Gains from sales of patents |
| | (79,950 | ) | ||||||||
| Goodwill impairment charge |
| | 63,555 | |||||||||
| Restructuring charges |
990 | 109,896 | 547 | |||||||||
| Gain from sale of Alibaba Group Shares |
| (4,603,322 | ) | | ||||||||
| Loss (gain) from sales of investments, assets, and other, net |
4,405 | (11,840 | ) | 22,397 | ||||||||
| Earnings in equity interests |
(476,920 | ) | (676,438 | ) | (896,675 | ) | ||||||
| Dividend income related to Alibaba Group Preference Shares |
| (20,000 | ) | (35,726 | ) | |||||||
| Tax benefits (detriments) from stock-based awards |
33,497 | (31,440 | ) | 49,061 | ||||||||
| Excess tax benefits from stock-based awards |
(70,680 | ) | (35,844 | ) | (64,407 | ) | ||||||
| Deferred income taxes |
70,392 | (769,320 | ) | (84,302 | ) | |||||||
| Dividends received from equity investees |
75,391 | 83,648 | 135,058 | |||||||||
| Changes in assets and liabilities, net of effects of acquisitions: |
||||||||||||
| Accounts receivable |
38,100 | 34,752 | 26,199 | |||||||||
| Prepaid expenses and other |
97,849 | 78,529 | 27,401 | |||||||||
| Accounts payable |
(316 | ) | 12,747 | (7,764 | ) | |||||||
| Accrued expenses and other liabilities |
(290,070 | ) | 255,799 | (98,853 | ) | |||||||
| Deferred revenue |
(73,912 | ) | 465,140 | (149,929 | ) | |||||||
|
|
|
|
|
|
|
|||||||
| Net cash provided by (used in) operating activities |
1,323,806 | (281,554 | ) | 1,195,247 | ||||||||
|
|
|
|
|
|
|
|||||||
| CASH FLOWS FROM INVESTING ACTIVITIES: |
||||||||||||
| Acquisition of property and equipment, net |
(593,294 | ) | (505,507 | ) | (338,131 | ) | ||||||
| Purchases of marketable securities |
(1,708,530 | ) | (3,520,327 | ) | (3,223,190 | ) | ||||||
| Proceeds from sales of marketable securities |
1,508,948 | 741,947 | 2,871,834 | |||||||||
| Proceeds from maturities of marketable securities |
1,316,197 | 381,403 | 748,915 | |||||||||
| Proceeds related to sale of Alibaba Group Shares, net |
| 6,247,728 | | |||||||||
| Proceeds related to the redemption of Alibaba Group Preference Shares |
| | 800,000 | |||||||||
| Acquisitions, net of cash acquired |
(323,830 | ) | (5,716 | ) | (1,247,544 | ) | ||||||
| Purchases of intangible assets |
(11,819 | ) | (3,799 | ) | (2,500 | ) | ||||||
| Proceeds from the sale of investments |
21,271 | 26,132 | 181 | |||||||||
| Proceeds from the settlement of derivative hedge contracts |
| 17,898 | 312,266 | |||||||||
| Payments for the settlement of derivative hedge contracts |
| (11,141 | ) | (22,708 | ) | |||||||
| Proceeds from sales of patents |
| | 79,950 | |||||||||
| Other investing activities, net |
(6,581 | ) | (6,574 | ) | (2,294 | ) | ||||||
|
|
|
|
|
|
|
|||||||
| Net cash provided by (used in) investing activities |
202,362 | 3,362,044 | (23,221 | ) | ||||||||
|
|
|
|
|
|
|
|||||||
The accompanying notes are an integral part of these consolidated financial statements.
80
Yahoo! Inc.
Consolidated Statements of Cash Flows
(Continued)
| Years Ended December 31, | ||||||||||||
| 2011 | 2012 | 2013 | ||||||||||
| (in thousands) | ||||||||||||
| CASH FLOWS FROM FINANCING ACTIVITIES: |
||||||||||||
| Proceeds from issuance of common stock |
$ | 156,226 | $ | 218,371 | $ | 353,267 | ||||||
| Repurchases of common stock |
(1,618,741 | ) | (2,167,841 | ) | (3,344,396 | ) | ||||||
| Proceeds from issuance of convertible notes |
| | 1,412,344 | |||||||||
| Payments for note hedges |
| | (205,706 | ) | ||||||||
| Proceeds from issuance of warrants |
| | 124,775 | |||||||||
| Excess tax benefits from stock-based awards |
70,680 | 35,844 | 64,407 | |||||||||
| Tax withholdings related to net share settlements of restricted stock awards and restricted stock units |
(44,761 | ) | (60,939 | ) | (139,815 | ) | ||||||
| Proceeds from credit facility borrowings |
| | 150,000 | |||||||||
| Repayment of credit facility borrowings |
| | (150,000 | ) | ||||||||
| Other financing activities, net |
(19,362 | ) | (4,892 | ) | (8,760 | ) | ||||||
|
|
|
|
|
|
|
|||||||
| Net cash used in financing activities |
(1,455,958 | ) | (1,979,457 | ) | (1,743,884 | ) | ||||||
|
|
|
|
|
|
|
|||||||
| Effect of exchange rate changes on cash and cash equivalents |
(34,247 | ) | 4,355 | (18,330 | ) | |||||||
| Net change in cash and cash equivalents |
35,963 | 1,105,388 | (590,188 | ) | ||||||||
| Cash and cash equivalents at beginning of year |
1,526,427 | 1,562,390 | 2,667,778 | |||||||||
|
|
|
|
|
|
|
|||||||
| Cash and cash equivalents at end of year |
$ | 1,562,390 | $ | 2,667,778 | $ | 2,077,590 | ||||||
|
|
|
|
|
|
|
|||||||
See Note 8Investments in Equity Interests for information about the non-cash proceeds of $800 million in Alibaba Group Preference Shares.
The accompanying notes are an integral part of these consolidated financial statements.
81
Yahoo! Inc.
Notes to Consolidated Financial Statements
Note 1 THE COMPANY AND SUMMARY OF SIGNIFICANT ACCOUNTING POLICIES
The Company. Yahoo! Inc., together with its consolidated subsidiaries (Yahoo or the Company) is a global technology company focused on making the worlds daily habits inspiring and entertaining. The Companys mission is driven by its commitment to creating highly personalized experiences that reach the Companys users wherever they might beon their mobile phone, tablet or desktop. Yahoos more than 800 million monthly users connect to the things that matter most to them with beautiful, engaging experiences across Search, Communications, Digital Magazines and Videosome of which will be powered by Flickr and Tumblr.
The Company creates value for advertisers with a streamlined, simplified advertising technology stack that leverages Yahoos data, reach and analytics to connect advertisers with their target audiences. For advertisers, the opportunity to be a part of users daily habits across products and platforms is a powerful tool to engage audiences and build brand loyalty.
Advertisers can build their businesses through advertising to targeted audiences on the Companys online properties and services (Yahoo Properties), or through a distribution network of third party entities (Affiliates) who integrate the Companys advertising offerings into their Websites or other offerings (Affiliate sites; together with Yahoo Properties, the Yahoo Network). The Company manages and measures its business geographically, principally in the Americas, EMEA (Europe, Middle East, and Africa) and Asia Pacific.
Basis of Presentation. The consolidated financial statements include the accounts of Yahoo! Inc. and its majority-owned or otherwise controlled subsidiaries. All significant intercompany accounts and transactions have been eliminated. Investments in entities in which the Company can exercise significant influence, but does not own a majority equity interest or otherwise control, are accounted for using the equity method and are included as investments in equity interests on the consolidated balance sheets. The Company has included the results of operations of acquired companies from the date of acquisition. Certain prior period amounts have been reclassified to conform to the current period presentation
The preparation of consolidated financial statements in conformity with generally accepted accounting principles (GAAP) in the United States (U.S.) requires management to make estimates, judgments, and assumptions that affect the reported amounts of assets, liabilities, revenue, and expenses and the related disclosure of contingent assets and liabilities. On an ongoing basis, the Company evaluates its estimates, including those related to revenue, the useful lives of long-lived assets including property and equipment and intangible assets, investment fair values, stock-based compensation, goodwill, income taxes, contingencies, and restructuring charges. The Company bases its estimates of the carrying value of certain assets and liabilities on historical experience and on various other assumptions that are believed to be reasonable under the circumstances, when these carrying values are not readily available from other sources. Actual results may differ from these estimates.
Concentration of Risk. Financial instruments that potentially subject the Company to significant concentration of credit risk consist primarily of cash, cash equivalents, marketable securities, accounts receivable, and derivative financial instruments. The primary focus of the Companys investment strategy is to preserve capital and meet liquidity requirements. A large portion of the Companys cash is managed by external managers within the guidelines of the Companys investment policy. The Companys investment policy addresses the level of credit exposure by limiting the concentration in any one corporate issuer or sector and establishing a minimum allowable credit rating. To manage the risk exposure, the Company maintains its portfolio of cash and cash equivalents and short-term and long-term investments in a variety of fixed income securities, including U.S. and foreign government, agency, municipal and highly rated corporate debt obligations and money market funds. The Companys derivative instruments, including the note hedge transactions, expose the Company to credit risk to the extent that its counterparties may be unable to meet the terms of the agreements. The Company seeks to
82
mitigate this risk by limiting its counterparties to major financial institutions and by spreading the risk across several major financial institutions. In addition, the potential risk of loss with any one counterparty resulting from this type of credit risk is monitored on an ongoing basis. See Note 9Derivative Instruments for additional information related to the Companys derivative instruments. Accounts receivable are typically unsecured and are derived from revenue earned from customers. The Company performs ongoing credit evaluations of its customers and maintains allowances for potential credit losses. Historically, such losses have been within managements expectations. As of December 31, 2012 and 2013, no one customer accounted for 10 percent or more of the accounts receivable balance and no one customer accounted for 10 percent or more of the Companys revenue for 2011, 2012, or 2013. See Note 19 Search Agreement with Microsoft Corporation for revenue under the Companys Search and Advertising Services and Sales Agreement (the Search Agreement) with Microsoft Corporation (Microsoft).
Comprehensive Income. Comprehensive income consists of two components, net income and other comprehensive income. Other comprehensive income refers to revenue, expenses, and gains and losses that under GAAP are recorded as an element of shareholders equity but are excluded from net income. The Companys other comprehensive income consists of foreign currency translation adjustments from those subsidiaries or equity method investments where the local currency is the functional currency, unrealized gains and losses on marketable securities classified as available-for-sale, unrealized gains and losses on cash flow hedges, net changes in fair value of derivative instruments related to our net investment hedges, as well as the Companys share of its equity investees other comprehensive income.
Foreign Currency. The functional currency of the Companys international subsidiaries is evaluated on a case-by-case basis and is often the local currency. The financial statements of these subsidiaries are translated into U.S. dollars using period-end rates of exchange for assets and liabilities, historical rates of exchange for equity, and average rates of exchange for the period for revenue and expenses. Translation gains (losses) are recorded in accumulated other comprehensive income (loss) as a component of stockholders equity. In addition, the Company records translation gains (losses) related to its foreign equity method investments in accumulated other comprehensive income (loss). The Company records foreign currency transaction gains and losses, realized and unrealized and measurement of local currencies of foreign subsidiaries where the foreign currency is different from the local currency in other income, net in the consolidated statements of income. The Company recorded $9 million of net gains in 2011, and $1 million and $6 million of net losses in 2012 and 2013, respectively.
Cash and Cash Equivalents, Short- and Long-Term Marketable Securities. The Company invests its excess cash in money market funds, time deposits, and liquid debt instruments of the U.S. and foreign governments and their agencies, U.S. municipalities, and high-credit corporate issuers which are classified as marketable securities and cash equivalents. All investments with an original maturity of three months or less are considered cash equivalents. Investments with maturities of less than 12 months from the balance sheet date are classified as current assets, which are available for use to fund current operations. Investments with maturities greater than 12 months from the balance sheet date are classified as long-term assets.
Operating cash deposits held with banks may exceed the amount of insurance provided on such deposits. Generally, these deposits may be redeemed upon demand and are maintained with financial institutions with reputable credit and therefore bear minimal credit risk. The Company seeks to mitigate its credit risk by spreading such risk across multiple counterparties and monitoring the risk profiles of these counterparties.
The Companys marketable securities are classified as available-for-sale and are reported at fair value, with unrealized gains and losses, net of tax, recorded in accumulated other comprehensive income (loss). Realized gains or losses and declines in value judged to be other-than-temporary, if any, on available-for-sale securities are reported in other income, net. The Company evaluates the investments periodically for possible other-than-temporary impairment. A decline of fair value below amortized costs of debt securities is considered an other-than-temporary impairment if the Company has the intent to sell the security or it is more likely than not that the
83
Company will be required to sell the security before recovery of the entire amortized cost basis. In those instances, an impairment charge equal to the difference between the fair value and the amortized cost basis is recognized in earnings. Regardless of the Companys intent or requirement to sell a debt security, an impairment is considered other-than-temporary if the Company does not expect to recover the entire amortized cost basis; in those instances, a credit loss equal to the difference between the present value of the cash flows expected to be collected based on credit risk and the amortized cost basis of the debt security is recognized in earnings. The Company has no current requirement or intent to sell a material portion of debt securities as of December 31, 2013. The Company expects to recover up to (or beyond) the initial cost of investment for securities held. In computing realized gains and losses on available-for-sale securities, the Company determines cost based on amounts paid, including direct costs such as commissions to acquire the security, using the specific identification method. During the years ended December 31, 2011, 2012 and 2013, gross realized gains and losses on available-for-sale debt and equity securities were not material.
Allowance for Doubtful Accounts. The Company records its allowance for doubtful accounts based upon its assessment of various factors. The Company considers historical experience, the age of the accounts receivable balances, the credit quality of its customers, current economic conditions, and other factors that may affect customers ability to pay to determine the level of allowance required.
Derivative Financial Instruments. The Company uses derivative financial instruments, primarily foreign currency forward contracts, to mitigate certain foreign currency exposures. The Company hedges, on an after-tax basis, a portion of its net investment in Yahoo Japan. The Company has designated these foreign currency forward contracts as net investment hedges, which are accounted for in accordance with ASC 815 Derivatives and Hedging (ASC 815). The effective portion of changes in fair value is recorded in accumulated other comprehensive income on the Companys consolidated balance sheet and any ineffective portion is recorded in other income, net on the Companys consolidated statements of income. The Company expects the net investment hedges to be effective, on an after-tax basis, as described in ASC 815 and effectiveness will be assessed each quarter. Should any portion of the net investment hedge become ineffective, the ineffective portion will be reclassified to other income, net on the Companys consolidated statements of income. The fair values of the net investment hedges are determined using quoted observable inputs. Gains and losses reported in accumulated other comprehensive income will not be reclassified into earnings until a sale of the Companys underlying investment.
For derivatives designated as cash flow hedges, the effective portion of the unrealized gains or losses on these forward contracts is recorded in accumulated other comprehensive income on the Companys consolidated balance sheets and reclassified into revenue on the consolidated statements of income when the underlying hedged revenue is recognized. If the cash flow hedges were to become ineffective, the ineffective portion would be immediately recorded in other income, net on the Companys consolidated statements of income.
The Company hedges certain of its net recognized foreign currency assets and liabilities with foreign exchange forward contracts to reduce the risk that its earnings and cash flows will be adversely affected by changes in foreign currency exchange rates. These balance sheet hedges are used to partially offset the foreign currency exchange gains and losses generated by the re-measurement of certain assets and liabilities denominated in non-functional currency. Changes in the fair value of these derivatives are recorded in other income, net on the Companys consolidated statements of income. The fair values of the balance sheet hedges are determined using quoted observable inputs.
In October 2013, the Company began hedging a portion of the forecasted revenue of certain international subsidiaries whose functional currencies are not the U.S dollar. This program attempts to reduce the risk that the Companys revenue denominated in these currencies will be adversely affected by foreign currency exchange rate fluctuations. These derivatives are economic hedges and as such do not qualify for hedge accounting. Changes in the fair value of these derivatives are recorded as a component of revenue in the Companys consolidated statements of income.
84
The Company recognizes all derivative instruments as other assets or liabilities on the Companys consolidated balance sheets at fair value. See Note 9Derivative Financial Instruments for a full description of the Companys derivative financial instrument activities and related accounting.
Property and Equipment. Buildings are stated at cost and depreciated using the straight-line method over the estimated useful lives of 25 years. Leasehold improvements are amortized over the lesser of their expected useful lives and the remaining lease term. Computers and equipment and furniture and fixtures are stated at cost and depreciated using the straight-line method over the estimated useful lives of the assets, generally three to five years.
Property and equipment to be held and used are reviewed for impairment whenever events or changes in circumstances indicate that the carrying value of the assets may not be recoverable. Determination of recoverability is based on the lowest level of identifiable estimated undiscounted future cash flows resulting from the use of the asset and its eventual disposition. Measurement of any impairment loss for long-lived assets that management expects to hold and use is based on the excess of the carrying value of the asset over its fair value. No impairments of such assets were identified during any of the periods presented.
Capitalized Software and Labor. The Company capitalized certain software and labor costs totaling approximately $192 million, $180 million, and $130 million during 2011, 2012, and 2013, respectively. The estimated useful life of costs capitalized is evaluated for each specific project and ranges from one to three years. During 2011, 2012, and 2013, the amortization of capitalized costs totaled approximately $114 million, $142 million, and $175 million, respectively. Capitalized software and labor costs are included in property and equipment, net. Included in the capitalized amounts above are $22 million, $24 million, and $16 million, respectively, of stock-based compensation expense in the years ended December 31, 2011, 2012, and 2013.
Goodwill. Goodwill represents the excess of the purchase price over the fair value of the net tangible and intangible assets acquired in a business combination. Goodwill is not amortized, but is tested for impairment on an annual basis and more frequently if impairment indicators are present. The Companys reporting units are one level below the operating segments level. If the reporting unit does not pass the qualitative assessment, then the reporting units carrying value is compared to its fair value. The fair values of the reporting units are estimated using an average of a market approach and an income approach as this combination is deemed to be the most indicative of the Companys fair value in an orderly transaction between market participants. Goodwill is considered impaired if the carrying value of the reporting unit exceeds its fair value. The income approach uses expected future operating results and failure to achieve these expected results may cause a future impairment of goodwill at the reporting unit. If the carrying value of the reporting unit exceeds its fair value, the second step of the goodwill impairment test is performed by comparing the carrying value of the goodwill in the reporting unit to its implied fair value. An impairment charge is recognized for the excess of the carrying value of goodwill over its implied fair value. The Company conducted its annual goodwill impairment test as of October 31, 2013 and determined that the fair values of its reporting units, with the exception of the Middle East reporting unit, exceeded their carrying values and therefore goodwill in those reporting units was not impaired. The Company concluded that the carrying value of the Middle East reporting unit exceeded its fair value and recorded a goodwill impairment charge of approximately $64 million in the quarter ended December 31, 2013. See Note 5Goodwill for additional information.
Intangible Assets. Intangible assets are carried at cost and amortized over their estimated useful lives, generally on a straight-line basis over one to eight years as the pattern of use is ratable. The Company reviews identifiable amortizable intangible assets to be held and used for impairment whenever events or changes in circumstances indicate that the carrying value of the assets may not be recoverable. Determination of recoverability is based on the lowest level of identifiable estimated undiscounted cash flows resulting from use of the asset and its eventual disposition. Measurement of any impairment loss is based on the excess of the carrying value of the asset over its fair value.
85
For the year ended December 31, 2013, the Company sold certain patents and recorded gains on sales of patents of approximately $80 million. The gains on sales of patents were primarily related to a patent sale agreement with a wholly-owned affiliate of Alibaba Group entered into during the fourth quarter of 2013 for $70 million.
Investments in Equity Interests. Investments in the common stock of entities in which the Company can exercise significant influence but does not own a majority equity interest or otherwise control are accounted for using the equity method and are included as investments in equity interests on the consolidated balance sheets. The Company records its share of the results of these companies one quarter in arrears within earnings in equity interests on the consolidated statements of income. The Company reviews its investments for other-than-temporary impairment whenever events or changes in business circumstances indicate that the carrying value of the investment may not be fully recoverable. Investments identified as having an indication of impairment are subject to further analysis to determine if the impairment is other-than-temporary and this analysis requires estimating the fair value of the investment. The determination of fair value of the investment involves considering factors such as the stock prices of public companies in which the Company has an equity investment, current economic and market conditions, the operating performance of the companies including current earnings trends and forecasted cash flows, and other company and industry specific information.
Operating and Capital Leases. The Company leases office space and data centers under operating leases and certain data center equipment under a capital lease agreement with original lease periods up to 12 years. Assets acquired under capital leases are amortized over the remaining lease term. Certain of the lease agreements contain rent holidays and rent escalation provisions. For purposes of recognizing these lease incentives on a straight-line basis over the term of the lease, the Company uses the date that the Company has the right to control the asset to begin amortization. Lease renewal periods are considered on a lease-by-lease basis and are generally not included in the period of straight-line recognition. For each of the years ended December 31, 2011, 2012 and 2013, the Company expensed $5 million of interest, which approximates the cash payments made for interest. As of December 31, 2012 and 2013, the Company had net lease obligations included in capital lease and other long-term liabilities in the consolidated balance sheets of $37 million and $44 million, respectively.
Income Taxes. Deferred income taxes are determined based on the differences between the financial reporting and tax bases of assets and liabilities and are measured using the currently enacted tax rates and laws. The Company records a valuation allowance against particular deferred income tax assets if it is more likely than not that those assets will not be realized. The provision for income taxes comprises the Companys current tax liability and change in deferred income tax assets and liabilities.
Significant judgment is required in evaluating the Companys uncertain tax positions and determining its provision for income taxes. The Company establishes liabilities for tax-related uncertainties based on estimates of whether, and the extent to which, additional taxes will be due. These liabilities are established when the Company believes that certain positions might be challenged despite its belief that its tax return positions are in accordance with applicable tax laws. The Company adjusts these liabilities in light of changing facts and circumstances, such as the closing of a tax audit, new tax legislation, developments in case law or interactions with the tax authorities. To the extent that the final tax outcome of these matters is different than the amounts recorded, such differences will affect the provision for income taxes in the period in which such determination is made. The provision for income taxes includes the effect of changes to liabilities for tax-related uncertainties that are considered appropriate, as well as the related net interest and penalties. Income taxes paid, net of refunds received, were $96 million, $2.3 billion, and $208 million in the years ended December 31, 2011, 2012, and 2013, respectively. Interest paid was not material in any of the years presented. See Note 16Income Taxes for additional information.
Revenue Recognition. Revenue is generated from several offerings including the display of graphical and non-graphical advertisements (display advertising), clicks on text-based links to advertisers Websites that appear primarily on search results pages (search advertising), and other sources. For revenue arrangements with multiple deliverables, the consideration is allocated based on the relative selling price for each deliverable. The
86
selling price for each arrangement deliverable can be established based on vendor specific objective evidence (VSOE) or third-party evidence (TPE) if VSOE is not available. An estimate of selling price (ESP) is used if neither VSOE nor TPE is available.
The Company recognizes revenue from display advertising on Yahoo Properties and Affiliate sites as impressions are delivered. Impressions are delivered when a sold advertisement appears in pages viewed by users. Arrangements for these services generally have terms of up to one year and in some cases the terms may be up to three years. For display advertising on Affiliate sites, the Company pays Affiliates for the revenue generated from the display of these advertisements on the Affiliate sites. Traffic acquisition costs (TAC) are payments made to third-party entities that have integrated the Companys advertising offerings into their Websites or other offerings and payments made to companies that direct consumer and business traffic to Yahoo Properties. The display revenue derived from these arrangements that involve traffic supplied by Affiliates is reported gross of the TAC paid to Affiliates as the Company is the primary obligor to the advertisers who are the customers of the display advertising service.
From time-to-time, the Company may offer customized display advertising solutions to advertisers. These customized display advertising solutions combine the Companys standard display advertising with customized content, customer insights, and campaign analysis. Due to the unique nature of these products, the Company may not be able to establish selling prices based on historical stand-alone sales or third-party evidence; therefore, the Company may use its best estimate to establish selling prices. The Company establishes best estimates within a range of selling prices considering multiple factors including, but not limited to, class of advertiser, size of transaction, seasonality, margin objectives, observed pricing trends, available online inventory, industry pricing strategies, and market conditions. The Company believes the use of the best estimates of selling price allows revenue recognition in a manner consistent with the underlying economics of the transaction.
The Company recognizes revenue from search advertising on Yahoo Properties and Affiliate sites. Search revenue is recognized based on Paid Clicks. A Paid Click occurs when an end-user clicks on a sponsored listing on Yahoo Properties and Affiliate sites for which an advertiser pays on a per click basis. The Companys Search Agreement with Microsoft provides for Microsoft to be the exclusive algorithmic and paid search services provider on Yahoo Properties and non-exclusive provider of such services on Affiliate sites. In transitioned markets, the Company reports as revenue the 88 percent share of revenue generated from Microsofts services on Yahoo Properties and Affiliate sites, as the Company is not the primary obligor in the arrangement with the advertisers. See Note 19Search Agreement with Microsoft Corporation for a description of the Search Agreement with Microsoft.
In non-transitioned markets, the Company paid Affiliates TAC for the revenue generated from the search advertisements on the Affiliates Websites. The revenue derived from these arrangements was reported on a gross basis (before deducting the TAC paid to Affiliates), as the Company continued to be the primary obligor to the advertisers. The Company also generates search revenue from a revenue sharing arrangement with Yahoo Japan for search technology and services and records the related revenue as it is earned.
Other revenue includes listings-based services revenue, transaction revenue, royalties, and fees revenue. Listings-based services revenue is generated from a variety of consumer and business listings-based services, including classified advertising such as Yahoo Autos and other services. The Company recognizes listings-based services revenue when the services are performed. Transaction revenue is generated from facilitating commercial transactions through Yahoo Properties, principally from Yahoo Small Business, Yahoo Travel, and Yahoo Shopping. The Company recognizes transaction revenue when there is evidence that qualifying transactions have occurred. We also receive royalties from joint venture partners that are recognized when earned. Fees revenue consists of revenue generated from a variety of consumer and business fee-based services as well as services for small businesses. The Company recognizes fees revenue when the services are performed.
87
In all cases, revenue is recognized only when the price is fixed or determinable, persuasive evidence of an arrangement exists, the service is performed, and collectability of the related fee is reasonably assured. The Companys arrangements generally do not include a provision for cancellation, termination, or refunds that would significantly impact revenue recognition.
The Company accounts for cash consideration given to customers, for which it does not receive a separately identifiable benefit and cannot reasonably estimate fair value, as a reduction of revenue.
Current deferred revenue is comprised of contractual billings in excess of recognized revenue and payments received in advance of revenue recognition. Long-term deferred revenue includes amounts received for which revenue will not be earned within the next 12 months.
TAC. TAC consists of payments made to third-party entities that have integrated the Companys advertising offerings into their Websites or other offerings and payments made to companies that direct consumer and business traffic to Yahoo Properties. The Company enters into agreements of varying duration that involve TAC. There are generally two economic structures of the Affiliate agreements: fixed payments based on a guaranteed minimum amount of traffic delivered, which often carry reciprocal performance guarantees from the Affiliate, or variable payments based on a percentage of the Companys revenue or based on a certain metric, such as the number of searches or paid clicks. The Company expenses, as cost of revenue, TAC under two different methods. Agreements with fixed payments are expensed ratably over the term the fixed payment covers. Agreements based on a percentage of revenue, number of searches, or other metrics are expensed based on the volume of the underlying activity or revenue multiplied by the agreed-upon price or rate.
Product Development. Product development expenses consist primarily of compensation-related expenses (including stock-based compensation expense) incurred for research and development, the development of, enhancements to, and maintenance and operation of Yahoo Properties, advertising products, technology platforms, and infrastructure. Depreciation expense, third-party technology and development expense, and other operating costs are also included in product development.
Advertising Costs. Advertising production costs are recorded as expense the first time an advertisement appears. Costs of advertising are recorded as expense as advertising space or airtime is used. All other advertising costs are expensed as incurred. Advertising expense totaled approximately $148 million, $103 million, and $128 million for 2011, 2012, and 2013, respectively.
Restructuring Charges. The Company has developed and implemented restructuring initiatives to improve efficiencies across the organization, reduce operating expenses, and better align its resources to market conditions. As a result of these plans, the Company has recorded restructuring charges comprised principally of employee severance and associated termination costs related to the reduction of its workforce, office closures, losses on subleases, and contract termination costs. Liabilities for costs associated with an exit or disposal activity are recognized when the liability is incurred, as opposed to when management commits to an exit plan. In addition, (i) liabilities associated with exit and disposal activities are measured at fair value; (ii) one-time termination benefits are expensed at the date the entity notifies the employee, unless the employee must provide future service, in which case the benefits are expensed ratably over the future service period; and (iii) costs to terminate a contract before the end of its term are recognized when the entity terminates the contract in accordance with the contract terms. In addition, a portion of the Companys restructuring costs related to international employees are recognized when the amount of such termination benefits becomes estimable and payment is probable.
These restructuring initiatives require management to make estimates in several areas including: (i) expenses for severance and other employee separation costs; (ii) realizable values of assets made redundant, obsolete, or excessive; and (iii) the ability to generate sublease income and to terminate lease obligations at the estimated amounts.
88
Stock-Based Compensation Expense. The Company recognizes stock-based compensation expense, net of an estimated forfeiture rate and therefore only recognizes compensation costs for those shares expected to vest over the service period of the award. Stock-based awards are valued based on the grant date fair value of these awards; the Company records stock-based compensation expense on a straight-line basis over the requisite service period, generally one to four years.
Calculating stock-based compensation expense related to stock options requires the input of highly subjective assumptions, including the expected term of the stock options, stock price volatility, and the pre-vesting forfeiture rate of stock awards. The Company estimates the expected life of options granted based on historical exercise patterns, which the Company believes are representative of future behavior. The Company estimates the volatility of its common stock on the date of grant based on the implied volatility of publicly traded options on its common stock, with a term of one year or greater. The Company believes that implied volatility calculated based on actively traded options on its common stock is a better indicator of expected volatility and future stock price trends than historical volatility. The assumptions used in calculating the fair value of stock-based awards represent the Companys best estimates, but these estimates involve inherent uncertainties and the application of management judgment. As a result, if factors change and the Company uses different assumptions, the Companys stock-based compensation expense could be materially different in the future. In addition, the Company is required to estimate the expected pre-vesting award forfeiture rate, as well as the probability that performance conditions that affect the vesting of certain awards will be achieved, and only recognizes expense for those shares expected to vest. The Company estimates the forfeiture rate based on historical experience of the Companys stock-based awards that are granted and cancelled before vesting. See Note 14Employee Benefits for additional information.
The Company uses the with and without approach in determining the order in which tax attributes are utilized. As a result, the Company recognizes a tax benefit from stock-based awards in additional paid-in capital only if an incremental tax benefit is realized after all other tax attributes currently available to the Company have been utilized. When tax deductions from stock-based awards are less than the cumulative book compensation expense, the tax effect of the resulting difference (shortfall) is charged first to additional paid-in capital, to the extent of the Companys pool of windfall tax benefits, with any remainder recognized in income tax expense. The Company determined that it had a sufficient windfall pool available through the end of 2013 to absorb any shortfalls. In addition, the Company accounts for the indirect effects of stock-based awards on other tax attributes, such as the research tax credit, through the consolidated statements of income.
Recent Accounting Pronouncements.
In 2013, the Financial Accounting Standards Board (FASB) issued new accounting guidance clarifying the accounting for the release of a cumulative translation adjustment into net income when a parent either sells a part or all of its investment in a foreign entity or no longer holds a controlling financial interest in a subsidiary or group of assets that is a nonprofit activity or a business within a foreign entity. The new standard is effective for fiscal years, and interim periods within those fiscal years, beginning on or after December 15, 2013. The Company does not anticipate that this adoption will have a significant impact on its financial position, results of operations, or cash flows.
In 2013, the FASB issued a new accounting standard that will require the presentation of certain unrecognized tax benefits as reductions to deferred tax assets rather than as liabilities in the Consolidated Balance Sheets when a net operating loss carryforward, a similar tax loss, or a tax credit carryforward exists. The new standard requires adoption on a prospective basis in the first quarter of 2015; however, early adoption is permitted. The Company does not anticipate that this adoption will have a significant impact on its financial position, results of operations, or cash flows.
89
Note 2 INVESTMENTS AND FAIR VALUE MEASUREMENTS
The following tables summarize the investments in available-for-sale securities (in thousands):
| December 31, 2012 | ||||||||||||||||
| Gross Amortized Costs |
Gross Unrealized Gains |
Gross Unrealized Losses |
Estimated Fair Value |
|||||||||||||
| Government and agency securities |
$ | 1,312,876 | $ | 985 | $ | (45 | ) | $ | 1,313,816 | |||||||
| Corporate debt securities, commercial paper, and bank certificates of deposit |
2,039,809 | 1,597 | (622 | ) | 2,040,784 | |||||||||||
| Corporate equity and other marketable securities |
230 | | (33 | ) | 197 | |||||||||||
| Alibaba Group Preference Shares |
816,261 | | | 816,261 | ||||||||||||
|
|
|
|
|
|
|
|
|
|||||||||
| Total investments in available-for-sale securities |
$ | 4,169,176 | $ | 2,582 | $ | (700 | ) | $ | 4,171,058 | |||||||
|
|
|
|
|
|
|
|
|
|||||||||
| December 31, 2013 | ||||||||||||||||
| Gross Amortized Costs |
Gross Unrealized Gains |
Gross Unrealized Losses |
Estimated Fair Value |
|||||||||||||
| Government and agency securities |
$ | 538,397 | $ | 65 | $ | (101 | ) | $ | 538,361 | |||||||
| Corporate debt securities, commercial paper, and bank certificates of deposit |
2,380,134 | 2,525 | (1,216 | ) | 2,381,443 | |||||||||||
| Corporate equity and other marketable securities |
230 | 153 | | 383 | ||||||||||||
|
|
|
|
|
|
|
|
|
|||||||||
| Total investments in available-for-sale securities |
$ | 2,918,761 | $ | 2,743 | $ | (1,317 | ) | $ | 2,920,187 | |||||||
|
|
|
|
|
|
|
|
|
|||||||||
| December 31, | ||||||||
| 2012 | 2013 | |||||||
| Reported as: |
||||||||
| Short-term marketable securities |
$ | 1,516,175 | $ | 1,330,304 | ||||
| Long-term marketable securities |
1,838,425 | 1,589,500 | ||||||
| Alibaba Group Preference Shares |
816,261 | | ||||||
| Other assets |
197 | 383 | ||||||
|
|
|
|
|
|||||
| Total |
$ | 4,171,058 | $ | 2,920,187 | ||||
|
|
|
|
|
|||||
Available-for-sale securities included in cash and cash equivalents on the consolidated balance sheets are not included in the table above as the gross unrealized gains and losses were immaterial for both 2012 and 2013 as the carrying value approximates fair value because of the short maturity of those instruments.
The contractual maturities of available-for-sale marketable securities were as follows (in thousands):
| December 31, | ||||||||
| 2012 | 2013 | |||||||
| Due within one year |
$ | 1,516,175 | $ | 1,330,304 | ||||
| Due after one year through five years |
1,838,425 | 1,589,500 | ||||||
|
|
|
|
|
|||||
| Total available-for-sale marketable securities |
$ | 3,354,600 | $ | 2,919,804 | ||||
|
|
|
|
|
|||||
90
The following tables show all investments in an unrealized loss position for which an other-than-temporary impairment has not been recognized and the related gross unrealized losses and fair value, aggregated by investment category and length of time that individual securities have been in a continuous unrealized loss position (in thousands):
| December 31, 2012 | ||||||||||||||||||||||||
| Less than 12 Months | 12 Months or Greater | Total | ||||||||||||||||||||||
| Fair Value |
Unrealized Loss |
Fair Value |
Unrealized Loss |
Fair Value |
Unrealized Loss |
|||||||||||||||||||
| Government and agency securities |
$ | 165,025 | $ | (45 | ) | $ | | $ | | $ | 165,025 | $ | (45 | ) | ||||||||||
| Corporate debt securities, commercial paper, and bank certificates of deposit |
729,046 | (622 | ) | | | 729,046 | (622 | ) | ||||||||||||||||
| Corporate equity securities |
197 | (33 | ) | | | 197 | (33 | ) | ||||||||||||||||
|
|
|
|
|
|
|
|
|
|
|
|
|
|||||||||||||
| Total investments in available-for-sale securities |
$ | 894,268 | $ | (700 | ) | $ | | $ | | $ | 894,268 | $ | (700 | ) | ||||||||||
|
|
|
|
|
|
|
|
|
|
|
|
|
|||||||||||||
| December 31, 2013 | ||||||||||||||||||||||||
| Less than 12 Months | 12 Months or Greater | Total | ||||||||||||||||||||||
| Fair Value |
Unrealized Loss |
Fair Value |
Unrealized Loss |
Fair Value |
Unrealized Loss |
|||||||||||||||||||
| Government and agency securities |
$ | 263,514 | $ | (101 | ) | $ | | $ | | $ | 263,514 | $ | (101 | ) | ||||||||||
| Corporate debt securities, commercial paper, and bank certificates of deposit |
696,950 | (1,214 | ) | 3,833 | (2 | ) | 700,783 | (1,216 | ) | |||||||||||||||
|
|
|
|
|
|
|
|
|
|
|
|
|
|||||||||||||
| Total investments in available-for-sale securities |
$ | 960,464 | $ | (1,315 | ) | $ | 3,833 | $ | (2 | ) | $ | 964,297 | $ | (1,317 | ) | |||||||||
|
|
|
|
|
|
|
|
|
|
|
|
|
|||||||||||||
The Companys investment portfolio consists of liquid high-quality fixed income government, agency, and corporate debt securities, money market funds, time deposits with financial institutions, and preference shares. Investments in both fixed rate and floating rate interest earning instruments carry a degree of interest rate risk. Fixed rate securities may have their fair market value adversely impacted due to a rise in interest rates, while floating rate securities may produce less income than expected if interest rates fall. Fixed income securities may have their fair market value adversely impacted due to a deterioration of the credit quality of the issuer. The longer the term of the securities, the more susceptible they are to changes in market rates. Investments are reviewed periodically to identify possible other-than-temporary impairment. The Company has no current requirement or intent to sell these securities. The Company expects to recover up to (or beyond) the initial cost of investment for securities held.
The Companys investment in the Alibaba Group Preference Shares was presented as an asset carried at fair value on the Companys consolidated balance sheets as of December 31, 2012. As of December 31, 2012, the total carrying and fair value of the Alibaba Group Preference Shares was $822 million, which included $6 million of accrued dividend income recorded within prepaid expenses and other current assets and $16 million of accrued dividend income recorded as part of the carrying value of the Alibaba Group Preference Shares. For the years ended December 31, 2012 and 2013, the Company recorded approximately $23 million and $36 million, respectively, in dividend income related to the Alibaba Group Preference Shares within other income, net on the consolidated statements of income. On May 16, 2013, Alibaba Group Holding Limited (Alibaba Group) exercised its right to redeem the Alibaba Group Preference Shares for $846 million in cash. The cash received represented the redemption value, which included the stated value of $800 million plus accrued dividends of $46 million.
91
The following table sets forth the financial assets and liabilities, measured at fair value, by level within the fair value hierarchy as of December 31, 2012 (in thousands):
| Fair Value Measurements at Reporting Date Using | ||||||||||||||||
| Assets |
Level 1 | Level 2 | Level 3 | Total | ||||||||||||
| Money market funds(1) |
$ | 685,707 | $ | | $ | | $ | 685,707 | ||||||||
| Available-for-sale securities: |
||||||||||||||||
| Government and agency securities(1) |
| 2,464,227 | | 2,464,227 | ||||||||||||
| Commercial paper and bank certificates of deposit(1) |
| 892,769 | | 892,769 | ||||||||||||
| Corporate debt securities(1) |
| 1,298,123 | | 1,298,123 | ||||||||||||
| Time deposits |
| 84,555 | | 84,555 | ||||||||||||
| Alibaba Group Preference Shares |
| | 816,261 | 816,261 | ||||||||||||
| Corporate equity securities(2) |
197 | | | 197 | ||||||||||||
| Foreign currency derivative contracts(3) |
| 5,007 | | 5,007 | ||||||||||||
|
|
|
|
|
|
|
|
|
|||||||||
| Financial assets at fair value |
$ | 685,904 | $ | 4,744,681 | $ | 816,261 | $ | 6,246,846 | ||||||||
| Liabilities |
||||||||||||||||
| Foreign currency derivative contracts(3) |
| (6,662 | ) | | (6,662 | ) | ||||||||||
|
|
|
|
|
|
|
|
|
|||||||||
| Total financial assets and liabilities at fair value |
$ | 685,904 | $ | 4,738,019 | $ | 816,261 | $ | 6,240,184 | ||||||||
|
|
|
|
|
|
|
|
|
|||||||||
The following table sets forth the financial assets and liabilities, measured at fair value, by level within the fair value hierarchy as of December 31, 2013 (in thousands):
| Fair Value Measurements at Reporting Date Using | ||||||||||||||||
| Assets |
Level 1 | Level 2 | Level 3 | Total | ||||||||||||
| Money market funds(1) |
$ | 936,438 | $ | | $ | | $ | 936,438 | ||||||||
| Available-for-sale securities: |
||||||||||||||||
| Government and agency securities(1) |
| 876,197 | | 876,197 | ||||||||||||
| Commercial paper and bank certificates of deposit(1) |
| 472,080 | | 472,080 | ||||||||||||
| Corporate debt securities(1) |
| 2,059,159 | | 2,059,159 | ||||||||||||
| Time deposits |
| 84,443 | | 84,443 | ||||||||||||
| Corporate equity securities(2) |
370 | | | 370 | ||||||||||||
| Foreign currency derivative contracts(3) |
| 214,041 | | 214,041 | ||||||||||||
|
|
|
|
|
|
|
|
|
|||||||||
| Financial assets at fair value |
$ | 936,808 | $ | 3,705,920 | $ | | $ | 4,642,728 | ||||||||
| Liabilities |
||||||||||||||||
| Foreign currency derivative contracts(3) |
| (1,401 | ) | | (1,401 | ) | ||||||||||
|
|
|
|
|
|
|
|
|
|||||||||
| Total financial assets and liabilities at fair value |
$ | 936,808 | $ | 3,704,519 | $ | | $ | 4,641,327 | ||||||||
|
|
|
|
|
|
|
|
|
|||||||||
| (1) | The money market funds, government and agency securities, commercial paper and bank certificates of deposit, and corporate debt securities are classified as part of either cash and cash equivalents or investments in marketable securities in the consolidated balance sheets. |
| (2) | The corporate equity securities are classified as part of the other long-term assets and other marketable securities are classified as investments in marketable securities in the consolidated balance sheets. |
| (3) | Foreign currency derivative contracts are classified as part of either other current assets or other current liabilities in the consolidated balance sheets. The notional amounts of the foreign currency derivative contracts were $3.4 billion, including contracts designated as net investment hedges of $3 billion, as of December 31, 2012, and $1.8 billion, including contracts designated as net investment hedges of $1.3 billion, as of December 31, 2013. |
92
The amount of cash and cash equivalents as of December 31, 2012 and 2013 includes $597 million and $569 million, respectively, in cash deposits.
The fair values of the Companys Level 1 financial assets and liabilities are based on quoted market prices of the identical underlying security. The fair values of the Companys Level 2 financial assets and liabilities are obtained using quoted prices for similar assets or liabilities in active markets; quoted prices for identical or similar assets in markets that are not active; and inputs other than quoted prices, e.g., interest rates and yield curves. The Company utilizes a pricing service to assist in obtaining fair value pricing for the majority of this investment portfolio. The Company classified its investment in the Alibaba Group Preference Shares within Level 3 because it was valued using significant unobservable inputs. To estimate the fair value as of December 31, 2012, the Company performed benchmarking by comparing the terms and conditions of the Alibaba Group Preference Shares to dividend rates, subordination terms, and credit ratings of those of similar type instruments. The Company conducts reviews on a quarterly basis to verify pricing, assess liquidity, and to determine if significant inputs have changed that would impact the fair value hierarchy disclosure.
Convertible Senior Notes
In 2013, the Company issued $1.4375 billion aggregate principal amount of 0.00% Convertible Senior Notes due 2018 (the Notes). The Notes are carried at their original issuance value, net of unamortized debt discount, and are not marked to market each period. The approximate fair value of the Notes as of December 31, 2013 was $1.1 billion. The fair value of the Notes was estimated on the basis of quoted market prices observable in the market and is considered Level 2 in the fair value hierarchy. See Note 11Convertible Notes for additional information related to the Notes.
Goodwill
The inputs used to measure the estimated fair value of goodwill are classified as a Level 3 fair value measurement due to the significance of unobservable inputs using company-specific information. The valuation methodology used to estimate the fair value of goodwill is discussed in Note 1Goodwill.
Activity between Levels of the Fair Value Hierarchy
During the years ended December 31, 2012 and 2013, the Company did not make any transfers between Level 1, Level 2, or Level 3 assets or liabilities.
Note 3 CONSOLIDATED FINANCIAL STATEMENT DETAILS
Prepaid Expenses and Other Current Assets
As of December 31, prepaid expenses and other current assets consisted of the following (in thousands):
| 2012 | 2013 | |||||||
| Prepaid expenses |
$ | 74,268 | $ | 103,100 | ||||
| Deferred income taxes |
249,936 | 218,486 | ||||||
| Foreign currency forward contract assets |
5,008 | 214,041 | ||||||
| Other receivables non-trade |
36,740 | 37,404 | ||||||
| Other |
94,360 | 65,373 | ||||||
|
|
|
|
|
|||||
| Total prepaid expenses and other current assets |
$ | 460,312 | $ | 638,404 | ||||
|
|
|
|
|
|||||
93
Property and Equipment, Net
As of December 31, property and equipment, net consisted of the following (in thousands):
| 2012 | 2013 | |||||||
| Land |
$ | 213,838 | $ | 213,838 | ||||
| Buildings |
639,658 | 697,874 | ||||||
| Leasehold improvements |
304,440 | 279,052 | ||||||
| Computers and equipment(1) |
2,040,381 | 1,512,860 | ||||||
| Capitalized software and labor |
595,366 | 766,368 | ||||||
| Furniture and fixtures |
75,559 | 61,280 | ||||||
| Assets not yet in use |
81,979 | 80,830 | ||||||
|
|
|
|
|
|||||
| 3,951,221 | 3,612,102 | |||||||
| Less: accumulated depreciation and amortization(2) |
(2,265,376 | ) | (2,123,584 | ) | ||||
|
|
|
|
|
|||||
| Total property and equipment, net |
$ | 1,685,845 | $ | 1,488,518 | ||||
|
|
|
|
|
|||||
| (1) | Includes data center equipment acquired under a capital lease of approximately $37 million and $44 million as of December 31, 2012 and 2013, respectively. |
| (2) | Includes $20 million and $33 million of accumulated depreciation, and $6 million and $12 million of accumulated amortization related to the capital lease as of December 31, 2012 and 2013, respectively. |
Other Long-Term Assets
As of December 31, other long-term assets consisted of the following (in thousands):
| 2012 | 2013 | |||||||
| Deferred income taxes |
$ | 139,183 | $ | 23,222 | ||||
| Investments in privately-held companies |
27,022 | 25,077 | ||||||
| Other |
122,925 | 128,982 | ||||||
|
|
|
|
|
|||||
| Total other long-term assets |
$ | 289,130 | $ | 177,281 | ||||
|
|
|
|
|
|||||
Accrued Expenses and Other Current Liabilities
As of December 31, accrued expenses and other current liabilities consisted of the following (in thousands):
| 2012 | 2013 | |||||||
| Accrued content, connection, traffic acquisition, and other costs |
$ | 116,951 | $ | 119,431 | ||||
| Deferred income taxes |
200 | (10 | ) | |||||
| Accrued compensation and related expenses |
337,727 | 343,392 | ||||||
| Accrued taxes payable |
10,619 | 107,033 | ||||||
| Accrued professional service expenses |
67,736 | 69,869 | ||||||
| Accrued sales and marketing related expenses |
11,988 | 17,744 | ||||||
| Accrued restructuring costs |
58,718 | 21,764 | ||||||
| Current liability for uncertain tax contingencies |
30,484 | | ||||||
| Other |
174,052 | 228,559 | ||||||
|
|
|
|
|
|||||
| Total accrued expenses and other current liabilities |
$ | 808,475 | $ | 907,782 | ||||
|
|
|
|
|
|||||
94
Deferred and Other Long-Term Tax Liabilities, Net
As of December 31, deferred and other long-term tax liabilities, net consisted of the following (in thousands):
| 2012 | 2013 | |||||||
| Deferred income taxes |
$ | 11,310 | $ | 172,491 | ||||
| Long-term liability for uncertain tax contingencies(*) |
663,961 | 675,465 | ||||||
|
|
|
|
|
|||||
| Total deferred and other long-term tax liabilities, net |
$ | 675,271 | $ | 847,956 | ||||
|
|
|
|
|
|||||
| (*) | Includes interest and penalties. |
Accumulated Other Comprehensive Income
As of December 31, the components of accumulated other comprehensive income were as follows (in thousands):
| 2012 | 2013 | |||||||
| Unrealized gains on available-for-sale securities, net of tax |
$ | 9,121 | $ | 15,101 | ||||
| Unrealized gains on cash flow hedges, net of tax |
| 1,412 | ||||||
| Foreign currency translation, net of tax |
562,128 | 301,876 | ||||||
|
|
|
|
|
|||||
| Accumulated other comprehensive income |
$ | 571,249 | $ | 318,389 | ||||
|
|
|
|
|
|||||
Noncontrolling Interests
As of December 31, noncontrolling interests were as follows (in thousands):
| 2012 | 2013 | |||||||
| Beginning noncontrolling interests |
$ | 40,280 | $ | 45,403 | ||||
| Net income attributable to noncontrolling interests |
5,123 | 10,285 | ||||||
|
|
|
|
|
|||||
| Ending noncontrolling interests |
$ | 45,403 | $ | 55,688 | ||||
|
|
|
|
|
|||||
Other Income, Net
Other income, net for 2011, 2012, and 2013 were as follows (in thousands):
| Years Ended December 31, | ||||||||||||
| 2011 | 2012 | 2013 | ||||||||||
| Interest, dividend, and investment income |
$ | 18,920 | $ | 41,673 | $ | 57,544 | ||||||
| Gain related to the sale of Alibaba Group Shares |
| 4,603,322 | | |||||||||
| Interest expense |
(9,473 | ) | (9,297 | ) | (14,319 | ) | ||||||
| Other |
17,728 | 12,141 | 132 | |||||||||
|
|
|
|
|
|
|
|||||||
| Total other income, net |
$ | 27,175 | $ | 4,647,839 | $ | 43,357 | ||||||
|
|
|
|
|
|
|
|||||||
Interest, dividend, and investment income consists of income earned from cash in bank accounts, investments made in marketable securities and money market funds, and dividend income on the Alibaba Group Preference Shares.
In September 2012, the Company recorded a pre-tax gain of approximately $4.6 billion related to the sale to Alibaba Group of Alibaba Group ordinary shares. See Note 8Investments in Equity Interests for additional information.
95
Interest expense is related to the Notes and capital lease obligations for buildings and data centers.
Other consists of gains and losses from sales or impairments of marketable securities and/or investments in privately-held companies, foreign exchange gains and losses due to re-measurement of monetary assets and liabilities denominated in non-functional currencies, and foreign exchange gains and losses on balance sheet hedges.
Reclassifications Out of Accumulated Other Comprehensive Income
Reclassifications out of accumulated other comprehensive income for the period ended December 31, 2012 were as follows (in thousands):
| Amount Reclassified from Accumulated Other Comprehensive Income |
Affected Line Item in the |
|||||
| Realized losses on available-for-sale securities, net of tax |
$ | 9,088 | Yahoo!s share of earnings in equity method investments and Other income, net | |||
|
|
|
|||||
| Foreign currency translation adjustments (CTA): |
||||||
| Korea business closure CTA reclassification |
$ | (16,208 | ) | Restructuring charges net | ||
| Alibaba Group Initial Repurchase related CTA reclassification, net of $68 million in tax |
(120,978 | ) | Other income, net | |||
|
|
|
|||||
| Total foreign currency translation adjustments, net of tax |
$ | (137,186 | ) | |||
|
|
|
|||||
| Total reclassifications for the period |
$ | (128,098 | ) | |||
|
|
|
|||||
Reclassifications out of accumulated other comprehensive income for the period ended December 31, 2013 were as follows (in thousands):
| Amount Reclassified from Accumulated Other Comprehensive Income |
Affected Line Item in the Statement of Income |
|||||
| Realized gains on cash flow hedges, net of tax |
$ | (2,080 | ) | Revenue | ||
| Realized gains on available-for-sale securities, net of tax |
(796 | ) | Other income, net | |||
|
|
|
|||||
| Total reclassifications for the period |
$ | (2,876 | ) | |||
|
|
|
|||||
Note 4 ACQUISITIONS
The following table summarizes acquisitions (including business combinations and asset acquisitions) completed during the three years ended December 31, 2013 (in millions):
| Purchase Price |
Goodwill | Amortizable Intangibles |
||||||||||
| 2011 |
||||||||||||
| interclick |
$ | 259 | $ | 172 | $ | 79 | ||||||
| Other acquisitions |
$ | 72 | $ | 49 | $ | 26 | ||||||
| 2012 |
||||||||||||
| All acquisitions |
$ | 7 | $ | 5 | $ | | ||||||
| 2013 |
||||||||||||
| Tumblr |
$ | 990 | $ | 752 | $ | 263 | ||||||
| Other acquisitions |
$ | 279 | $ | 186 | $ | 76 | ||||||
96
Transactions completed in 2011
interclick. On December 14, 2011, the Company completed the acquisition of interclick, inc. (interclick) through an all cash tender offer for all outstanding shares of common stock of interclick at $9.00 per share. With interclick, the Company acquired innovative data targeting capabilities, optimization technologies and new premium supply, as well as a team experienced in selling audiences across disparate sources of pooled supply. The purchase price exceeded the fair value of the net tangible and identifiable intangible assets acquired and, as a result, the Company recorded goodwill in connection with this transaction. Under the terms of the agreement, the Company acquired all of the equity interests (including all outstanding options) in interclick. interclick stockholders and vested option holders were paid in cash, and outstanding interclick unvested options and restricted stock awards were assumed. Assumed options are exercisable for shares of Yahoo common stock.
The total purchase price of $259 million consisted of cash consideration. In connection with the acquisition, the Company issued stock-based awards valued at $9 million which is being recognized as stock-based compensation expense as the awards vest over a period of up to 4 years.
The allocation of the purchase price of the assets acquired and liabilities assumed based on their fair values was as follows (in thousands):
| Cash acquired |
$ | 4,369 | ||
| Other tangible assets acquired |
71,711 | |||
| Amortizable intangible assets: |
||||
| Customer contracts and related relationships |
42,700 | |||
| Developed technology and patents |
35,600 | |||
| Trade name, trademark, and domain name |
600 | |||
| Goodwill |
171,641 | |||
|
|
|
|||
| Total assets acquired |
326,621 | |||
| Liabilities assumed |
(68,120 | ) | ||
|
|
|
|||
| Total |
$ | 258,501 | ||
|
|
|
The amortizable intangible assets have useful lives not exceeding six years and a weighted average useful life of five years. No amounts have been allocated to in-process research and development and $172 million has been allocated to goodwill. Goodwill represents the excess of the purchase price over the fair value of the net tangible and identifiable intangible assets acquired and is not deductible for tax purposes. The goodwill recorded in connection with this acquisition is included in the Americas segment.
Other AcquisitionsBusiness Combinations. During the year ended December 31, 2011, the Company acquired three other companies, which were accounted for as business combinations. The total purchase price for these acquisitions was $72 million. The total cash consideration of $72 million less cash acquired of $3 million resulted in a net cash outlay of $69 million. Of the total purchase price, $49 million was allocated to goodwill, $26 million to amortizable intangible assets, $3 million to cash acquired, and $6 million to net assumed liabilities. Goodwill represents the excess of the purchase price over the fair value of the net tangible and intangible assets acquired and is not deductible for tax purposes.
Transactions completed in 2012
All AcquisitionsBusiness Combinations. During the year ended December 31, 2012, the Company acquired two companies, which were accounted for as business combinations. The total purchase price for these acquisitions was $7 million. The total cash consideration of $7 million less cash acquired of $1 million resulted in a net cash outlay of $6 million. Of the total purchase price, $5 million was allocated to goodwill, $1 million to tangible assets and $1 million to cash acquired. Goodwill represents the excess of the purchase price over the fair value of the net tangible and intangible assets acquired and is not deductible for tax purposes.
97
Transactions completed in 2013
Tumblr. On June 19, 2013, the Company completed the acquisition of Tumblr, Inc. (Tumblr), a blog-hosting Website that allows users to post their own content as well as follow or re-blog posts made by other users. The acquisition of Tumblr brought a community of new users to the Yahoo Network.
The purchase price exceeded the fair value of the net tangible and identifiable intangible assets acquired and, as a result, the Company recorded goodwill in connection with this transaction. Under the terms of the agreement, the Company acquired all of the equity interests (including all outstanding vested options) in Tumblr. Tumblr stockholders and vested optionholders were paid in cash, outstanding Tumblr unvested options and restricted stock units were assumed and converted into equivalent awards covering Yahoo common stock and a portion of the Tumblr shares held by its founder were exchanged for Yahoo common stock.
The total purchase price of approximately $990 million consisted mainly of cash consideration. The allocation of the purchase price of the assets acquired and liabilities assumed based on their fair values was as follows (in thousands):
| Cash and marketable securities acquired |
$ | 16,587 | ||
| Other tangible assets acquired |
73,780 | |||
| Amortizable intangible assets: |
||||
| Developed technology |
23,700 | |||
| Customer contracts and related relationships |
182,400 | |||
| Trade name |
56,500 | |||
| Goodwill |
751,765 | |||
|
|
|
|||
| Total assets acquired |
1,104,732 | |||
| Liabilities assumed |
(114,521 | ) | ||
|
|
|
|||
| Total |
$ | 990,211 | ||
|
|
|
In connection with the acquisition, the Company is recognizing stock-based compensation expense of $70 million over a period of up to 4 years. This amount is comprised of assumed unvested stock options and restricted stock units (which had an aggregate fair value of $29 million at the acquisition date), and Yahoo common stock issued to Tumblrs founder (which had a fair value of $41 million at the acquisition date). The Yahoo common stock issued to Tumblrs founder is subject to holdback and will be released over 4 years provided he remains an employee of the Company. In addition, the transaction resulted in cash consideration of $40 million to be paid to Tumblrs founder over 4 years, also provided that he remains an employee of the Company. Such cash payments are being recognized as compensation expense over the 4-year service period.
The amortizable intangible assets have useful lives not exceeding 6 years and a weighted average useful life of 6 years. No amounts have been allocated to in-process research and development and $752 million has been allocated to goodwill. Goodwill represents the excess of the purchase price over the fair value of the net tangible and identifiable intangible assets acquired and is not deductible for tax purposes. This acquisition brings a community of users to the Yahoo Network by deploying Yahoos personalization technology and search infrastructure to deliver relevant content to the Tumblr user base.
Other AcquisitionsBusiness Combinations. During the year ended December 31, 2013, the Company acquired 25 other companies, which were accounted for as business combinations. The total aggregate purchase price for these other acquisitions was $279 million. The total cash consideration of $279 million less cash acquired of $2 million resulted in a net cash outlay of $277 million. The allocation of the purchase price of the assets and liabilities assumed based on their estimated fair values was $76 million to amortizable intangible assets, $19 million to in-process research and development, $2 million to cash acquired, $33 million to other tangible assets, $37 million to assumed liabilities, and the remainder of $186 million to goodwill. Goodwill represents the excess of the purchase price over the fair value of the net tangible and intangible assets acquired and is not deductible for tax purposes.
98
The Companys business combinations completed during the years ended December 31, 2011, 2012, and 2013 did not have a material impact on the Companys consolidated financial statements, and therefore pro forma disclosures have not been presented.
Note 5 GOODWILL
The changes in the carrying amount of goodwill for the years ended December 31, 2012 and 2013 were as follows (in thousands):
| Americas(1) | EMEA(2) | Asia Pacific(3) | Total | |||||||||||||
| Net balance as of January 1, 2012 |
$ | 2,866,365 | $ | 581,523 | $ | 452,864 | $ | 3,900,752 | ||||||||
| Acquisitions |
5,616 | | | 5,616 | ||||||||||||
| Korea goodwill write-off |
| | (85,642 | ) | (85,642 | ) | ||||||||||
| Foreign currency translation adjustments |
(1,950 | ) | 12,090 | (4,117 | ) | 6,023 | ||||||||||
|
|
|
|
|
|
|
|
|
|||||||||
| Net balance as of December 31, 2012 |
$ | 2,870,031 | $ | 593,613 | $ | 363,105 | $ | 3,826,749 | ||||||||
| Acquisitions |
934,135 | 1,567 | 1,921 | 937,623 | ||||||||||||
| Goodwill impairment charge |
| (63,555 | ) | | (63,555 | ) | ||||||||||
| Foreign currency translation adjustments |
(1,832 | ) | 15,231 | (34,568 | ) | (21,169 | ) | |||||||||
|
|
|
|
|
|
|
|
|
|||||||||
| Net balance as of December 31, 2013 |
$ | 3,802,334 | $ | 546,856 | $ | 330,458 | $ | 4,679,648 | ||||||||
|
|
|
|
|
|
|
|
|
|||||||||
| (1) | Gross goodwill balances for the Americas segment were $2.9 billion as of January 1, 2012 and $3.8 billion as of December 31, 2013. |
| (2) | Gross goodwill balances for the EMEA segment were $1.1 billion as of both January 1, 2012 and December 31, 2013. The EMEA segment includes accumulated impairment losses of $488 million as of January 1, 2012, and $551 million as of December 31, 2013. |
| (3) | Gross goodwill balances for the Asia Pacific (APAC) segment were $517 million as of January 1, 2012 and $480 million as of December 31, 2013. The APAC segment includes accumulated impairment losses of $64 million as of January 1, 2012 and $150 million as of December 31, 2013. |
As a result of the annual goodwill impairment test, the Company concluded that the carrying value of the Middle East reporting unit, included in the EMEA reportable segment, exceeded its fair value. As required by the second step of the impairment test, the Company performed an allocation of the fair value to all the assets and liabilities of the reporting unit, including identifiable intangible assets, based on their estimated fair values, to determine the implied fair value of goodwill. Accordingly, the Company recorded a goodwill impairment charge of approximately $64 million during the quarter ended December 31, 2013 for the difference between the carrying value of the goodwill in the reporting unit and its implied fair value with goodwill remaining of $77 million. The impairment resulted from reductions in the Companys actual and projected operating results and estimated future cash flows that resulted from a decline in business conditions in the Middle East during the latter half of 2013.
The estimated fair values of the Companys other reporting units exceeded their estimated carrying values and therefore goodwill in those reporting units was not impaired.
Note 6 INTANGIBLE ASSETS, NET
The following table summarizes the Companys carrying amount of intangible assets, net (in thousands):
| December 31, 2012 | ||||||||||||
| Gross Carrying Amount |
Accumulated Amortization(*) |
Net | ||||||||||
| Customer, affiliate, and advertiser related relationships |
$ | 162,389 | $ | (99,996 | ) | $ | 62,393 | |||||
| Developed technology and patents |
270,485 | (198,851 | ) | 71,634 | ||||||||
| Trade names, trademarks, and domain names |
50,382 | (30,436 | ) | 19,946 | ||||||||
|
|
|
|
|
|
|
|||||||
| Total intangible assets, net |
$ | 483,256 | $ | (329,283 | ) | $ | 153,973 | |||||
|
|
|
|
|
|
|
|||||||
99
| December 31, 2013 | ||||||||||||
| Gross Carrying Amount |
Accumulated Amortization(*) |
Net | ||||||||||
| Customer, affiliate, and advertiser related relationships |
$ | 293,612 | $ | (87,794 | ) | $ | 205,818 | |||||
| Developed technology and patents |
261,435 | (120,936 | ) | 140,499 | ||||||||
| Trade names, trademarks, and domain names |
107,381 | (35,890 | ) | 71,491 | ||||||||
|
|
|
|
|
|
|
|||||||
| Total intangible assets, net |
$ | 662,428 | $ | (244,620 | ) | $ | 417,808 | |||||
|
|
|
|
|
|
|
|||||||
| (*) | Cumulative foreign currency translation adjustments, reflecting movement in the currencies of the underlying entities, increased total intangible assets by approximately $19 million as of both December 31, 2012 and 2013. |
The intangible assets have estimated useful lives as follows:
| | Customer, affiliate, and advertiser related relationshipstwo to eight years; |
| | Developed technology and patentsone year to eight years; and |
| | Trade names, trademarks, and domain namesone year to an indefinite life. |
The Company recognized amortization expense of intangible assets of approximately $118 million, $105 million, and $97 million for 2011, 2012, and 2013, respectively, including $84 million, $70 million, and $52 million, respectively, included in cost of revenue-other. Based on the current amount of intangibles subject to amortization, the estimated amortization expense for each of the succeeding years is as follows: 2014: $107 million; 2015: $85 million; 2016: $60 million; 2017: $55 million; 2018: $43 million; and cumulatively thereafter: $51 million.
Note 7 BASIC AND DILUTED NET INCOME ATTRIBUTABLE TO YAHOO! INC. COMMON STOCKHOLDERS PER SHARE
Basic and diluted net income attributable to Yahoo common stockholders per share is computed using the weighted average number of common shares outstanding during the period, excluding net income attributable to participating securities (restricted stock awards granted under the Companys 1995 Stock Plan and restricted stock units granted under the Companys 1996 Directors Stock Plan (the Directors Plan)). Diluted net income per share is computed using the weighted average number of common shares and, if dilutive, potential common shares outstanding during the period. Potential common shares are calculated using the treasury stock method and consist of unvested restricted stock and shares underlying unvested restricted stock units, the incremental common shares issuable upon the exercise of stock options, and shares to be purchased under the Companys 1996 Employee Stock Purchase Plan (the Employee Stock Purchase Plan). The Company calculates potential tax windfalls and shortfalls by including the impact of pro forma deferred tax assets.
The Company takes into account the effect on consolidated net income per share of dilutive securities of entities in which the Company holds equity interests that are accounted for using the equity method.
For 2011, 2012, and 2013, potentially dilutive securities representing approximately 56 million, 39 million, and 10 million shares of common stock, respectively, were excluded from the computation of diluted earnings per share for these periods because their effect would have been anti-dilutive.
The Company has the option to pay cash, issue shares of common stock or any combination thereof for the aggregate amount due upon conversion of the Notes. The Companys intent is to settle the principal amount of the Notes in cash upon conversion. As a result, upon conversion of the Notes, only the amounts payable in excess of the principal amounts of the Notes are considered in diluted earnings per share under the treasury stock method.
100
The following table sets forth the computation of basic and diluted net income per share (in thousands, except per share amounts):
| Years Ended December 31, | ||||||||||||
| 2011 | 2012 | 2013 | ||||||||||
| Basic: |
||||||||||||
| Numerator: |
||||||||||||
| Net income attributable to Yahoo! Inc. |
$ | 1,048,827 | $ | 3,945,479 | $ | 1,366,281 | ||||||
| Less: Net income allocated to participating securities |
(15 | ) | (56 | ) | (28 | ) | ||||||
|
|
|
|
|
|
|
|||||||
| Net income attributable to Yahoo! Inc. common stockholdersbasic |
$ | 1,048,812 | $ | 3,945,423 | $ | 1,366,253 | ||||||
|
|
|
|
|
|
|
|||||||
| Denominator: |
||||||||||||
| Weighted average common shares |
1,274,240 | 1,192,775 | 1,052,705 | |||||||||
|
|
|
|
|
|
|
|||||||
| Net income attributable to Yahoo! Inc. common stockholders per sharebasic |
$ | 0.82 | $ | 3.31 | $ | 1.30 | ||||||
|
|
|
|
|
|
|
|||||||
| Diluted: |
||||||||||||
| Numerator: |
||||||||||||
| Net income attributable to Yahoo! Inc. |
$ | 1,048,827 | $ | 3,945,479 | $ | 1,366,281 | ||||||
| Less: Net income allocated to participating securities |
(14 | ) | (55 | ) | (28 | ) | ||||||
| Less: Effect of dilutive securities issued by equity investees |
(2,698 | ) | (4,920 | ) | (16,656 | ) | ||||||
|
|
|
|
|
|
|
|||||||
| Net income attributable to Yahoo! Inc. common stockholdersdiluted |
$ | 1,046,115 | $ | 3,940,504 | $ | 1,349,597 | ||||||
|
|
|
|
|
|
|
|||||||
| Denominator: |
||||||||||||
| Denominator for basic calculation |
1,274,240 | 1,192,775 | 1,052,705 | |||||||||
| Weighted average effect of Yahoo! Inc. dilutive securities: |
||||||||||||
| Restricted stock and restricted stock units |
5,347 | 8,403 | 14,097 | |||||||||
| Stock options and employee stock purchase plan |
2,695 | 1,728 | 4,009 | |||||||||
|
|
|
|
|
|
|
|||||||
| Denominator for diluted calculation |
1,282,282 | 1,202,906 | 1,070,811 | |||||||||
|
|
|
|
|
|
|
|||||||
| Net income attributable to Yahoo! Inc. common stockholders per sharediluted |
$ | 0.82 | $ | 3.28 | $ | 1.26 | ||||||
|
|
|
|
|
|
|
|||||||
Note 8 INVESTMENTS IN EQUITY INTERESTS
As of December 31, investments in equity interests consisted of the following (dollars in thousands):
| 2012 | 2012 Percent Ownership |
2013 | 2013 Percent Ownership |
|||||||||||||
| Alibaba Group |
$ | 276,389 | 24 | % | $ | 1,018,126 | 24 | % | ||||||||
| Yahoo Japan |
2,555,717 | 35 | % | 2,399,590 | 35 | % | ||||||||||
| Other |
8,051 | 24 | % | 8,631 | 19 | % | ||||||||||
|
|
|
|
|
|||||||||||||
| Total |
$ | 2,840,157 | $ | 3,426,347 | ||||||||||||
|
|
|
|
|
|||||||||||||
Equity Investment in Alibaba Group. On October 23, 2005, the Company acquired approximately 46 percent of the outstanding common stock of the Alibaba Group, which represented approximately 40 percent on a fully diluted basis, in exchange for $1.0 billion in cash, the contribution of the Companys China-based businesses (Yahoo China), and direct transaction costs of $8 million. Another investor in Alibaba Group is Softbank Corp., a Japanese corporation (Softbank). Alibaba Group is a privately-held company.
101
The Companys initial purchase price was based on acquiring a 40 percent equity interest in Alibaba Group on a fully diluted basis; however, the Company acquired a 46 percent interest based on outstanding shares. In allocating the initial excess of the carrying value of the investment in Alibaba Group over its proportionate share of the net assets of Alibaba Group, the Company allocated a portion of the excess to goodwill to account for the estimated reductions in the carrying value of the investment in Alibaba that may occur as the Companys equity interest is diluted to 40 percent based on specific events anticipated at the time. As of both December 31, 2012 and 2013, the Companys ownership interest in Alibaba Group was approximately 24 percent as a result of the Initial Repurchase described below.
The investment in Alibaba Group is being accounted for using the equity method, and the total investment, including net tangible assets, identifiable intangible assets and goodwill, is classified as part of investments in equity interests on the Companys consolidated balance sheets.
The Companys accounting policy is to record its share of the results of Alibaba Group one quarter in arrears, within earnings in equity interests in the consolidated statements of income. As of December 31, 2013, the excess of carrying value of the Companys investment in Alibaba Group and the Companys proportionate share of the net assets of Alibaba Group is largely attributable to goodwill.
The Company entered into a patent sale agreement with a wholly-owned affiliate of Alibaba Group during the fourth quarter of 2013 pursuant to which the Company sold certain patents for aggregate consideration of $70 million. The gain on sale of these patents is recorded as a part of gains on sales of patents in the consolidated statements of income.
Framework Agreement with Alibaba Group regarding Alipay. Alibaba Group restructured the ownership of Alipay.com Co., Ltd. (Alipay) and deconsolidated Alipay in the first quarter of 2011. The impact of the deconsolidation of Alipay was not material to the Companys financial statements. On July 29, 2011, the Company entered into a Framework Agreement (the Framework Agreement) with Alibaba Group, Softbank, Alipay, APN Ltd., a company organized under the laws of the Cayman Islands (IPCo), Zhejiang Alibaba E-Commerce Co., Ltd., a limited liability company organized under the laws of the Peoples Republic of China (HoldCo), Jack Ma Yun, Joseph C. Tsai and certain security holders of Alipay or HoldCo as joinder parties. The Framework Agreement establishes the ongoing financial and other arrangements between Alibaba Group and Alipay. The transactions under the Framework Agreement closed on December 14, 2011.
Pursuant to the terms of the Framework Agreement and related documents: (1) Alibaba Group will receive certain payments (Liquidity Event Payment) upon a liquidity event related to Alipay, such as an initial public offering or sale of Alipay; (2) Alibaba Group received a non-interest bearing promissory note in the principal amount of $500 million with a seven year maturity, subject to earlier prepayment or acceleration (the IPCo Promissory Note); (3) upon payment in full of the Liquidity Event Payment certain assets used in the Alipay business that were retained by Alibaba Group will be transferred to Alipay; (4) Alibaba Group and Alipay entered into a long-term agreement pursuant to which Alibaba Group will receive payment processing services on preferential terms from Alipay and its subsidiaries; and (5) Alibaba Group licensed to Alipay certain intellectual property and technology and performs certain software technology services for Alipay and in return Alipay pays to Alibaba Group a royalty and software technology services fee.
The royalty and software technology services fee and the payment processing services fees discussed above approximate the estimated fair values of such services and are recognized in Alibaba Groups financial statements as income or expense, as applicable, as the services are rendered. The Company will record its share, if any, of the results of these transactions as they are recorded by Alibaba Group within Yahoos earnings in equity interests in the consolidated statements of income. Alibaba Group will recognize the Liquidity Event Payment, the payment of the IPCo Promissory Note, and any impact from the transfer of assets, described above, if and when such payments or transfers occur. The Company will record its share, if any, of the results of these transactions as they are recorded by Alibaba Group within the Companys earnings in equity interests in the consolidated statements of income.
102
Initial Repurchase by Alibaba Group. On September 18, 2012 (the Repurchase Closing Date), Alibaba Group repurchased 523 million of the 1,047 million ordinary shares of Alibaba Group (the Shares) owned by the Company (the Initial Repurchase). The Initial Repurchase was made pursuant to the terms of the Share Repurchase and Preference Share Sale Agreement entered into by Yahoo! Inc., Alibaba Group and Yahoo! Hong Kong Holdings Limited, a Hong Kong corporation and wholly-owned subsidiary of Yahoo! Inc. (YHK), on May 20, 2012 (as amended on September 11, 2012, the Repurchase Agreement). Yahoo received $13.54 per Share, or approximately $7.1 billion in total consideration, for the 523 million Shares sold to Alibaba Group. Approximately $6.3 billion of the consideration was received in cash and $800 million was received in Alibaba Group Preference Shares, which Alibaba redeemed for cash on May 16, 2013. The Initial Repurchase resulted in a pre-tax gain of approximately $4.6 billion during the year ended December 31, 2012.
The Alibaba Group Preference Shares yielded semi-annual dividends at a rate per annum of up to 10 percent, with at least 3 percent payable in cash and the remainder accruing and increasing the liquidation preference. The Alibaba Group Preference Shares were callable by Alibaba Group at the redemption value (including accrued dividends). On May 16, 2013, the Company received $846 million in cash from Alibaba Group to redeem the Alibaba Group Preference Shares. The cash received represented the redemption value, which included the stated value of $800 million plus accrued dividends of $46 million.
The Repurchase Agreement provided that at the time Alibaba Group completes an initial public offering meeting certain specified criteria (a Qualified IPO), Yahoo and YHK would sell, at Alibaba Groups election (either directly to Alibaba Group or in the Qualified IPO), up to 261.5 million of their remaining Shares. This amount was subsequently reduced to 208.0 million by an amendment to the Repurchase Agreement dated as of October 14, 2013. If Shares are sold back to Alibaba Group in the Qualified IPO, the purchase price per Share will be equal to the per share price in the Qualified IPO less specified fees and underwriter discounts.
On the Repurchase Closing Date, the Company and Alibaba Group entered into an amendment of their existing Technology and Intellectual Property License Agreement (the TIPLA) pursuant to which Alibaba Group made an initial payment to the Company of $550 million in satisfaction of certain future royalty payments under the existing TIPLA. The Company will recognize this revenue over the remaining four-year term. For the years ended December 31, 2012 and 2013, the Company recognized approximately $39 million and $137 million in revenue related to the TIPLA. Alibaba Group will continue making royalty payments until the earlier of the fourth anniversary of the effective date of the amendment and a Qualified IPO. Pursuant to the terms of the TIPLA, the Company also recognized revenue of approximately $44 million, $86 million, and $122 million for the years ended December 31, 2011, 2012, and 2013, respectively.
The following table presents Alibaba Groups U.S. GAAP financial information, as derived from the Alibaba Group financial statements (in thousands):
| Twelve Months Ended September 30, | ||||||||||||
| 2011 | 2012 | 2013 | ||||||||||
| Operating data: |
||||||||||||
| Revenue |
$ | 2,344,973 | $ | 4,082,838 | $ | 6,734,978 | ||||||
| Gross profit |
$ | 1,557,392 | $ | 2,764,314 | $ | 4,909,327 | ||||||
| Income from operations |
$ | 325,334 | $ | 687,632 | $ | 3,103,664 | ||||||
| Net income |
$ | 339,552 | $ | 536,050 | $ | 2,847,139 | ||||||
| Net income attributable to Alibaba Group |
$ | 268,004 | $ | 484,511 | $ | 2,809,429 | ||||||
103
| September 30, 2012 |
September 30, 2013 |
|||||||
| Balance sheet data: |
||||||||
| Current assets |
$ | 4,062,823 | $ | 7,994,731 | ||||
| Long-term assets |
$ | 3,204,144 | $ | 5,959,835 | ||||
| Current liabilities |
$ | 2,624,656 | $ | 4,838,510 | ||||
| Long-term liabilities |
$ | 4,705,347 | $ | 5,319,113 | ||||
| Convertible preferred shares |
$ | 1,317,526 | $ | 1,688,889 | ||||
| Noncontrolling interests |
$ | 65,907 | $ | 92,127 | ||||
Since acquiring its interest in Alibaba Group, the Company has recorded, in retained earnings, cumulative earnings in equity interests, net of tax, of $661 million and $1,078 million as of December 31, 2012 and 2013, respectively.
Equity Investment in Yahoo Japan. During April 1996, the Company signed a joint venture agreement with Softbank, which was amended in September 1997, whereby Yahoo Japan Corporation (Yahoo Japan) was formed. Yahoo Japan was formed to establish and manage a local version of Yahoo in Japan.
The investment in Yahoo Japan is being accounted for using the equity method and the total investment, including net tangible assets, identifiable intangible assets, and goodwill, is classified as part of the investments in equity interests balance on the Companys consolidated balance sheets. The Company records its share of the results of Yahoo Japan and any related amortization expense, one quarter in arrears, within earnings in equity interests in the consolidated statements of income.
The Company makes adjustments to its earnings in equity interests line in the consolidated statements of income for any differences between U.S. GAAP and accounting principles generally accepted in Japan (Japanese GAAP), the standard by which Yahoo Japans financial statements are prepared.
During the year ended December 31, 2011, the Company recorded $33 million in U.S. GAAP adjustments to Yahoo Japans net income to reflect the Companys 35 percent share of non-cash losses related to impairments of assets held by Yahoo Japan. The $33 million recorded during the year ended December 31, 2011 primarily includes $7 million related to the Companys share of a non-cash loss in connection with an impairment of assets held by Yahoo Japan in the second quarter of 2011, and a $26 million U.S. GAAP adjustment to Yahoo Japans net income in the first quarter of 2011 to reflect the Companys share of an other-than-temporary impairment of a cost-method investment of Yahoo Japan that resulted primarily from reductions in the projected operating results of the Yahoo Japan investee.
The fair value of the Companys ownership in the common stock of Yahoo Japan, based on the quoted stock price, was approximately $11 billion as of December 31, 2013.
During the years ended December 31, 2011, 2012 and 2013, the Company received cash dividends from Yahoo Japan in the amounts of $75 million, $84 million, and $77 million, net of tax, respectively, which were recorded as reductions in the Companys investment in Yahoo Japan.
The following tables present summarized financial information derived from Yahoo Japans consolidated financial statements, which are prepared on the basis of Japanese GAAP. The Company has made adjustments to the Yahoo Japan financial information to address differences between Japanese GAAP and U.S. GAAP that
104
materially impact the summarized financial information below. Due to these adjustments, the Yahoo Japan summarized financial information presented below is not materially different than such information presented on the basis of U.S. GAAP.
| Twelve Months Ended September 30, | ||||||||||||
| 2011 | 2012 | 2013 | ||||||||||
| Operating data: |
||||||||||||
| Revenue |
$ | 3,988,377 | $ | 4,242,623 | $ | 4,296,522 | ||||||
| Gross profit |
$ | 3,311,357 | $ | 3,594,633 | $ | 3,577,001 | ||||||
| Income from operations |
$ | 1,963,924 | $ | 2,189,323 | $ | 2,150,644 | ||||||
| Net income |
$ | 1,114,637 | $ | 1,313,494 | $ | 1,365,443 | ||||||
| Net income attributable to Yahoo Japan |
$ | 1,108,390 | $ | 1,308,539 | $ | 1,355,457 | ||||||
| September 30, | ||||||||
| 2012 | 2013 | |||||||
| Balance sheet data: |
||||||||
| Current assets |
$ | 5,752,826 | $ | 6,318,156 | ||||
| Long-term assets |
$ | 1,837,829 | $ | 1,728,912 | ||||
| Current liabilities |
$ | 1,167,772 | $ | 1,992,508 | ||||
| Long-term liabilities |
$ | 49,461 | $ | 56,762 | ||||
| Noncontrolling interests |
$ | 31,034 | $ | 74,754 | ||||
Since acquiring its equity interest in Yahoo Japan, the Company has recorded cumulative earnings in equity interests, net of dividends received and related taxes on dividends, of $2.3 billion and $2.8 billion as of December 31, 2012 and 2013, respectively.
Under technology and trademark license and other commercial arrangements with Yahoo Japan, the Company records revenue from Yahoo Japan based on a percentage of advertising revenue earned by Yahoo Japan. The Company recorded revenue from Yahoo Japan of approximately $287 million, $281 million, and $266 million, respectively, for the years ended December 31, 2011, 2012, and 2013. As of December 31, 2012 and 2013, the Company had net receivable balances from Yahoo Japan of approximately $43 million and $42 million, respectively.
Note 9 DERIVATIVE FINANCIAL INSTRUMENTS
The Company uses derivative financial instruments, primarily forward contracts, to mitigate risk associated with adverse movements in foreign currency exchange rates.
The Company generally enters into master netting arrangements, which are designed to reduce credit risk by permitting net settlement of transactions with the same counterparty. The Company presents its derivative assets and liabilities at their gross fair values on the consolidated balance sheets. The Company is not required to pledge, and is not entitled to receive, cash collateral related to these derivative transactions.
Net Investment Hedges. The Company hedges, on an after-tax basis, a portion of its net investment in Yahoo Japan with forward contracts to reduce the risk that its carrying value of its investment in Yahoo Japan will be adversely affected by foreign currency exchange rate fluctuations. At inception, the forward contracts had maturities ranging from 9 to 15 months. The Company applies hedge accounting on its forward contracts for the net investment hedge of Yahoo Japan. The total balance of the after-tax net investment hedge was less than the Yahoo Japan investment balance as of both December 31, 2012 and 2013. As such, the net investment hedge was considered to be effective, and, as a result, the changes in the fair value were recorded within accumulated other comprehensive income on the Companys consolidated balance sheets. The Company recognizes net investment derivative instruments as either an asset or a liability on the Companys consolidated balance sheets at fair value.
105
The notional amounts of the foreign currency forward contracts were $3 billion as of December 31, 2012 and $1.3 billion as of December 31, 2013, respectively. The fair value of the foreign currency forward contract assets were $3 million and $209 million as of December 31, 2012 and 2013, respectively, and were included in prepaid expenses and other current assets on the Companys consolidated balance sheets. Pre-tax gains of $3 million and $510 million were recorded as of December 31, 2012 and December 31, 2013, respectively, and were included in accumulated other comprehensive income on the Companys consolidated balance sheets. The Company did not enter into any net investment hedges in the year ended December 31, 2011. The Company received $304 million in cash for settlement of certain foreign currency forward contracts during year ended December 31, 2013.
Cash Flow Hedges. The Company entered into foreign currency forward contracts designated as cash flow hedges of varying maturities through July 31, 2014. For derivatives designated as cash flow hedges, the effective portion of the unrealized gains or losses on these forward contracts is recorded in accumulated other comprehensive income on the Companys consolidated balance sheets and reclassified into revenue on the consolidated statements of income when the underlying hedged revenue is recognized. If the cash flow hedges were to become ineffective, the ineffective portion would be immediately recorded in other income, net on the Companys consolidated statements of income. The cash flow hedges were considered to be effective as of December 31, 2013. The total notional amount of the foreign currency forward contracts was $56 million as of December 31, 2013. The fair value of the foreign currency forward contract assets was $4 million as of December 31, 2013 which was included in prepaid expenses and other current assets on the Companys consolidated balance sheets. A pre-tax net gain of $2 million was recorded as of December 31, 2013, which was included in accumulated other comprehensive income on the Companys consolidated balance sheets. For year ended December 31, 2013, the Company recorded gains of $2 million, net of tax, for cash flow hedges, which were recorded in revenue in the consolidated statements of income. The Company received $2 million in cash for settlement of certain foreign currency forward contracts during the year ended December 31, 2013. The Company did not enter into any cash flow hedges in the years ended December 31, 2011 and 2012.
Balance Sheet Hedges. The Company hedges certain of its net recognized foreign currency assets and liabilities with foreign exchange forward contracts to reduce the risk that its earnings and cash flows will be adversely affected by changes in foreign currency exchange rates. These derivative instruments hedge assets and liabilities, including intercompany transactions, which are denominated in foreign currencies. The Company recognizes balance sheet derivative instruments as either an asset or a liability on the Companys consolidated balance sheets at fair value. Changes in the fair value of these derivatives are recorded in other income, net on the Companys consolidated statements of income. The notional amounts of these foreign currency forward contracts were $356 million and $393 million as of December 31, 2012 and 2013, respectively. As of December 31, 2012 and 2013, the fair value of the foreign currency forward contract liabilities were $5 million, and less than $1 million, respectively, and were included in accrued expenses and other current liabilities on the Companys consolidated balance sheets. A loss of $3 million, a gain of $4 million, and a loss of $12 million were recorded for the years ended December 31, 2011, 2012, and 2013, respectively, and were included in other income, net on the Companys consolidated statements of income. The Company received $7 million and paid a net $17 million in cash for settlement of certain foreign currency forward contracts during the years ended December 31, 2012 and 2013, respectively.
Forecasted Revenue Hedges. On October 2, 2013, the Company began hedging a portion of the forecasted revenue of certain international subsidiaries whose functional currencies are not the U.S dollar. This program attempts to reduce the risk that its revenue denominated in these currencies will be adversely affected by foreign currency exchange rate fluctuations. These derivatives are economic hedges and as such do not qualify for hedge accounting. The Company recognizes these derivative instruments as either assets or liabilities on the Companys consolidated balance sheets at fair value. Changes in the fair value of these derivatives are recorded as a component of revenue in the Companys consolidated statements of income. The Company did not have any derivative contracts related to the forecasted revenue hedge outstanding as of December 31, 2013. The Company did not enter into any forecasted revenue hedges in the years ended December 31, 2011 and 2012.
106
Foreign currency forward contracts activity for the year ended December 31, 2013 was as follows (in millions):
| Beginning fair value |
Settlement | Gain (loss) recorded in other income, net |
Gain (loss) recorded in other comprehensive income |
Gain (loss) recorded in revenue |
Ending fair value |
|||||||||||||||||||
| Derivatives designated as hedging instruments: |
||||||||||||||||||||||||
| Net investment hedges |
$ | 3 | $ | (304 | ) | $ | | $ | 510 | (1) | $ | | $ | 209 | ||||||||||
| Cash flow hedges |
| (2 | ) | 1 | 2 | (2) | 3 | (3) | 4 | |||||||||||||||
| Derivatives not designated as hedging instruments: |
||||||||||||||||||||||||
| Balance sheet hedges |
(5 | ) | 17 | (12 | ) | | | | ||||||||||||||||
| Forecasted revenue hedges |
| | | | | | ||||||||||||||||||
| (1) | This amount does not reflect the tax impact of $193 million recorded during the twelve months ended December 31, 2013. The $317 million after tax impact of the gain recorded under other comprehensive income was included in accumulated other comprehensive income on the Companys consolidated balance sheets. |
| (2) | This amount does not reflect the tax impact of less than $1 million recorded during the twelve months ended December 31, 2013. The less than $1 million tax impact of the gain was included in accumulated other comprehensive income on the Companys consolidated balance sheets. |
| (3) | This amount does not reflect the tax impact of $1 million recorded during the twelve months ended December 31, 2013. The $2 million after tax impact was included the consolidated statements of income. |
Note 10 CREDIT AGREEMENT
On October 19, 2012, the Company entered into a credit agreement (the Credit Agreement) with Citibank, N.A., as Administrative Agent, and the other lenders party thereto from time to time. On October 10, 2013, the Company entered into Amendment No. 1 to the Credit Agreement. Amendment No. 1 extended the termination date of the Credit Agreement from October 18, 2013 to October 9, 2014. The Credit Agreement, as amended, continues to provide for a $750 million unsecured revolving credit facility, subject to increase of up to $250 million in accordance with its terms.
Borrowings under the Credit Agreement, as amended, will continue to bear interest at a rate equal to, at the option of the Company, either (a) a customary London interbank offered rate (a Eurodollar Rate), or (b) a customary base rate (a Base Rate), in each case plus an applicable margin. The applicable margins for borrowings under the Credit Agreement, as amended, will be based upon the leverage ratio of the Company and range from 1.00 percent to 1.25 percent with respect to Eurodollar Rate borrowings and 0 percent to 0.25 percent with respect to Base Rate borrowings.
As of December 31, 2013, the Company was in compliance with the financial covenants in the Credit Agreement and no amounts were outstanding.
Note 11 CONVERTIBLE NOTES
0.00% Convertible Senior Notes
In 2013, the Company issued the Notes. The Notes were sold under a purchase agreement, dated November 20, 2013, with J.P. Morgan Securities LLC and Goldman, Sachs & Co., as representatives of the several initial purchasers named therein (collectively, the Initial Purchasers). The Notes were sold to the Initial Purchasers for resale to qualified institutional buyers pursuant to Rule 144A under the Securities Act of 1933, as amended.
107
In connection with the issuance of the Notes, the Company entered into an indenture (the Indenture) with respect to the Notes with The Bank of New York Mellon Trust Company, N.A., as trustee. Under the Indenture, the Notes are senior unsecured obligations of Yahoo! Inc., the Notes will not bear regular interest, and the principal amount of the Notes will not accrete. The Notes will mature on December 1, 2018, unless previously purchased or converted in accordance with their terms prior to such date. The Company may not redeem Notes prior to maturity. However, holders of the Notes may convert them at certain times and upon the occurrence of certain events in the future, as outlined in the Indenture. Holders of the Notes who convert in connection with a make-whole fundamental change, as defined in the Indenture, may require Yahoo to purchase for cash all or any portion of their Notes at a purchase price equal to 100 percent of the principal amount, plus accrued and unpaid special interest as defined in the Indenture, if any. The Notes will be convertible into shares of Yahoos common stock at an initial conversion rate of 18.7161 shares per $1,000 principal amount of Notes (which is equivalent to an initial conversion price of approximately $53.43 per share), subject to adjustment upon the occurrence of certain events. Certain corporate events described in the Indenture may increase the conversion rate for holders who elect to convert their Notes in connection with such corporate event should they occur. Upon conversion of the Notes, holders will receive cash, shares of Yahoos common stock or a combination thereof, at Yahoos election. The Companys intent is to settle the principal amount of the Notes in cash upon conversion. If the conversion value exceeds the principal amount, the Company would deliver shares of its common stock in respect to the remainder of its conversion obligation in excess of the aggregate principal amount (conversion spread). The conversion spread would be included in the denominator for the computation of diluted net income per common share, using the treasury stock method. As of December 31, 2013, none of the conditions allowing holders of the Notes to convert had been met.
In accounting for the issuance of the Notes, the Company separated the Notes into liability and equity components. The carrying amount of the liability component was calculated by measuring the estimated fair value of a similar liability that does not have an associated convertible feature. The carrying amount of the equity component representing the conversion option was determined by deducting the fair value of the liability component from the face value of the Notes as a whole. The excess of the principal amount of the liability component over its carrying amount (debt discount) is amortized to interest expense over the term of the Notes using the effective interest method with an effective interest rate of 5.26 percent per annum. The equity component is not remeasured as long as it continues to meet the conditions for equity classification.
In accounting for the transaction costs related to the Note issuance, the Company allocated the total amount incurred to the liability and equity components based on their relative values. Issuance costs attributable to the $1.1 billion liability component are being amortized to expense over the term of the Notes, and issuance costs attributable to the $306 million equity component were included with the equity component in stockholders equity. Additionally, the Company recorded a deferred tax liability of $37 million on a portion of the equity component transaction costs which are deductible for tax purposes.
The Notes consist of the following (in thousands):
|
Year
Ended December 31, 2013 |
||||
| Liability component: |
||||
| Principal |
$ | 1,437,500 | ||
| Less: note discount |
(326,915 | ) | ||
|
|
|
|||
| Net carrying amount |
$ | 1,110,585 | ||
|
|
|
|||
| Equity component(*) |
$ | 305,569 | ||
|
|
|
|||
| (*) | Recorded in the consolidated balance sheet within additional paid-in capital. |
108
The following table sets forth total interest expense recognized related to the Notes (in thousands):
|
Year
Ended December 31, 2013 |
||||
| Accretion of convertible note discount |
$ | 4,846 | ||
|
|
|
|||
As of December 31, the fair value of the Notes, which was determined based on inputs that are observable in the market (Level 2) and carrying value of debt instruments (carrying value excludes the equity component of the Companys Notes classified in equity) was as follows:
| 2013 | ||||||||
| Fair Value | Carrying Value | |||||||
| Convertible senior notes |
$ | 1,111,473 | $ | 1,110,585 | ||||
Note Hedge Transactions and Warrant Transactions
The Company entered into note hedge transactions with certain option counterparties (the Option Counterparties) to reduce the potential dilution with respect to Yahoos common stock upon conversion of the Notes or offset any cash payment the Company is required to make in excess of the principal amount of converted Notes. For the year ended December 31, 2013, the Company paid $206 million for the note hedge transactions. Separately, the Company also entered into privately negotiated warrant transactions with the Option Counterparties giving them the right to purchase common stock from the Company. The warrant transactions will have a dilutive effect with respect to Yahoos common stock to the extent that the market price per share of its common stock exceeds the strike price of $71.24 per share of the warrants on or prior to the expiration date of the warrants. The warrants begin to expire in March 2019. For the year ended December 31, 2013, the Company received $125 million in proceeds from the issuance of warrants. The note hedges and warrants are not marked to market. The value of the note hedges and warrants were initially recorded in stockholders equity and continue to be classified as stockholders equity.
Note 12 COMMITMENTS AND CONTINGENCIES
Lease Commitments. The Company leases office space and data centers under operating and capital lease agreements with original lease periods up to 12 years which expire between 2013 and 2025.
In May 2013, the Company entered into a 12-year operating lease agreement for four floors of the former New York Times building in New York City with a total expected minimum lease commitment of $125 million. The Company has the option to renew the lease for an additional five years. The lease requires monthly payments of approximately $1 million starting in July 2015 through June 2025. However, rent expense will be recorded over the lease term commensurate with the right to control the space which began in July 2013.
Rent expense for all operating leases was approximately $84 million, $76 million, and $77 million for 2011, 2012, and 2013, respectively.
Many of the Companys leases contain one or more of the following options which the Company can exercise at the end of the initial lease term: (i) renewal of the lease for a defined number of years at the then fair market rental rate or at a slight discount to the fair market rental rate; (ii) purchase of the property at the then fair market value; or (iii) right of first offer to lease additional space that becomes available.
109
Gross and net lease commitments as of December 31, 2013 can be summarized as follows (in millions):
| Gross Operating Lease Commitments |
Sublease Income |
Net Operating Lease Commitments |
||||||||||
| Years ending December 31, |
||||||||||||
| 2014 |
$ | 141 | $ | (12 | ) | $ | 129 | |||||
| 2015 |
109 | (9 | ) | 100 | ||||||||
| 2016 |
69 | (2 | ) | 67 | ||||||||
| 2017 |
55 | | 55 | |||||||||
| 2018 |
36 | | 36 | |||||||||
| Due after 5 years |
122 | | 122 | |||||||||
|
|
|
|
|
|
|
|||||||
| Total gross and net lease commitments |
$ | 532 | $ | (23 | ) | $ | 509 | |||||
|
|
|
|
|
|
|
|||||||
| Capital Lease Commitment |
||||
| Years ending December 31, |
||||
| 2014 |
$ | 15 | ||
| 2015 |
12 | |||
| 2016 |
9 | |||
| 2017 |
9 | |||
| 2018 |
9 | |||
| Due after 5 years |
4 | |||
|
|
|
|||
| Gross lease commitment |
$ | 58 | ||
|
|
|
|||
| Less: interest |
(14 | ) | ||
|
|
|
|||
| Net lease commitment included in capital lease and other long-term liabilities |
$ | 44 | ||
|
|
|
|||
Affiliate Commitments. In connection with contracts to provide advertising services to Affiliates, the Company is obligated to make payments, which represent TAC, to its Affiliates. As of December 31, 2013, these commitments totaled $24 million, of which $13 million will be payable in 2014, $10 million will be payable in 2015, and $1 million will be payable in 2016.
Non-cancelable Obligations. The Company is obligated to make payments under various non-cancelable arrangements with vendors and other business partners, principally for marketing, bandwidth, co-location, and content arrangements. As of December 31, 2013, these commitments totaled $198 million, of which $101 million will be payable in 2014, $48 million will be payable in 2015, $36 million will be payable in 2016, $8 million will be payable in 2017, and $5 million will be payable in 2018.
Intellectual Property Rights. The Company is committed to make certain payments under various intellectual property arrangements of up to $25 million through 2023.
Other Commitments. In the ordinary course of business, the Company may provide indemnifications of varying scope and terms to customers, vendors, lessors, joint ventures and business partners, purchasers of assets or subsidiaries and other parties with respect to certain matters, including, but not limited to, losses arising out of the Companys breach of agreements or representations and warranties made by the Company, services to be provided by the Company, intellectual property infringement claims made by third parties or, with respect to the sale of assets or a subsidiary, matters related to the Companys conduct of the business and tax matters prior to the sale. In addition, the Company has entered into indemnification agreements with its directors and certain of its officers that will require the Company, among other things, to indemnify them against certain liabilities that may arise by reason of their status or service as directors or officers. The Company has also agreed to indemnify certain former officers, directors, and employees of acquired companies in connection with the acquisition of
110
such companies. The Company maintains director and officer insurance, which may cover certain liabilities arising from its obligation to indemnify its directors and officers, and former directors and officers of acquired companies, in certain circumstances. It is not possible to determine the aggregate maximum potential loss under these indemnification agreements due to the limited history of prior indemnification claims and the unique facts and circumstances involved in each particular agreement. Such indemnification agreements might not be subject to maximum loss clauses. Historically, the Company has not incurred material costs as a result of obligations under these agreements and it has not accrued any liabilities related to such indemnification obligations in the Companys consolidated financial statements.
As of December 31, 2013, the Company did not have any relationships with unconsolidated entities or financial partnerships, such as entities often referred to as structured finance or special purpose entities, which would have been established for the purpose of facilitating off-balance sheet arrangements or other contractually narrow or limited purposes. Accordingly, the Company is not exposed to any financing, liquidity, market, or credit risk that could arise if the Company had engaged in such relationships. In addition, the Company identified no variable interests currently held in entities for which it is the primary beneficiary.
See Note 19Search Agreement with Microsoft Corporation for a description of the Companys Search Agreement and License Agreement with Microsoft.
Legal Contingencies
Intellectual Property and General Matters. From time to time, third parties assert patent infringement claims against the Company. Currently, the Company is engaged in lawsuits regarding patent issues and has been notified of other potential patent disputes. In addition, from time to time, the Company is subject to other legal proceedings and claims in the ordinary course of business, including claims of alleged infringement of trademarks, copyrights, trade secrets, and other intellectual property rights, claims related to employment matters, and a variety of other claims, including claims alleging defamation, invasion of privacy, or similar claims arising in connection with the Companys e-mail, message boards, photo and video sites, auction sites, shopping services, and other communications and community features.
Stockholder and Securities Matters. On June 14, 2007, a stockholder derivative action was filed in the United States District Court for the Central District of California by Jill Watkins against members of the board of directors (Board) and selected officers. The complaint filed by the plaintiff alleged breaches of fiduciary duties and corporate waste, similar to the allegations in a former class action relating to stock price declines during the period April 2004 to July 2006, and alleged violation of Section 10(b) of the Securities Exchange Act of 1934, as amended (the Exchange Act). On July 16, 2009, the plaintiff Watkins voluntarily dismissed the action against all defendants without prejudice. On July 17, 2009, plaintiff Miguel Leyte-Vidal, who had substituted in as plaintiff prior to the dismissal of the federal Watkins action, re-filed a stockholder derivative action in Santa Clara County Superior Court against members of the Board and selected officers. The Santa Clara County Superior Court derivative action purports to assert causes of action on behalf of the Company for violation of specified provisions of the California Corporations Code, for breaches of fiduciary duty regarding financial accounting and insider selling and for unjust enrichment. On October 23, 2013, the California Court of Appeal affirmed the Superior Courts judgment in favor of all defendants following dismissal of plaintiffs third amended complaint without leave to amend. The plaintiff did not pursue any further appeals and the judgment in Yahoos favor is final.
Since May 31, 2011, several related stockholder derivative suits were filed in the Santa Clara County Superior Court (California Derivative Litigation) and the United States District Court for the Northern District of California (Federal Derivative Litigation) purportedly on behalf of the Company against certain officers and directors of the Company and third parties. The California Derivative Litigation was filed by plaintiffs Cinotto, Lassoff, Zucker, and Koo, and consolidated under the caption In re Yahoo! Inc. Derivative Shareholder Litigation on June 24, 2011 and September 12, 2011. The Federal Derivative Litigation was filed by plaintiffs
111
Salzman, Tawila, and Iron Workers Mid-South Pension Fund and consolidated under the caption In re Yahoo! Inc. Shareholder Derivative Litigation on October 3, 2011. The plaintiffs allege breaches of fiduciary duties, corporate waste, mismanagement, abuse of control, unjust enrichment, misappropriation of corporate assets, or contribution and seek damages, equitable relief, disgorgement and corporate governance changes in connection with Alibaba Groups restructuring of its subsidiary Alipay and related disclosures. On June 7, 2012, the courts approved stipulations staying the California Derivative Litigation pending resolution of the Federal Derivative Litigation, and deferring the Federal Derivative Litigation pending a ruling on the motion to dismiss filed by the defendants in the related stockholder class actions, which are discussed below. On December 16, 2013, United States District Court for the Northern District of California granted the Companys motion to stay the Federal Derivative Litigation pending resolution of the appeal filed by the plaintiffs in the related stockholder class actions.
Since June 6, 2011, two purported stockholder class actions were filed in the United States District Court for the Northern District of California against the Company and certain officers and directors of the Company by plaintiffs Bonato and the Twin Cities Pipe Trades Pension Trust. In October 2011, the District Court consolidated the two actions under the caption In re Yahoo! Inc. Securities Litigation and appointed the Pension Trust Fund for Operating Engineers as lead plaintiff. In a consolidated amended complaint filed December 15, 2011, the lead plaintiff purports to represent a class of investors who purchased the Companys common stock between April 19, 2011 and July 29, 2011, and alleges that during that class period, defendants issued statements that were materially false or misleading because they did not disclose information relating to Alibaba Groups restructuring of Alipay. The complaint purports to assert claims for relief for violation of Section 10(b) and 20(a) of the Exchange Act and for violation of Rule 10b-5 thereunder, and seeks unspecified damages, injunctive and equitable relief, fees, and costs. On August 10, 2012, the court granted defendants motion to dismiss the consolidated amended complaint. Plaintiffs have appealed.
On July 30, 2013, a stockholder derivative action captioned Zucker v. Loeb, et al. was filed in the Supreme Court of New York for the County of New York against current and former members of the Board, Third Point LLC, and entities related to Third Point LLC. The complaint filed by the plaintiff asserts claims for alleged breach of fiduciary duty, waste, and unjust enrichment in connection with the Companys repurchase of 40 million shares of Company common stock beneficially owned by Third Point LLC. The complaint seeks a judgment declaring that the defendants breached their fiduciary duties, an award of restitution, and corporate governance changes. The Company has filed a motion to dismiss the action.
Mexico Matter. On November 16, 2011, plaintiffs Worldwide Directories, S.A. de C.V. (WWD), and Ideas Interactivas, S.A. de C.V. (Ideas) filed an action in the 49th Civil Court of Mexico against the Company, Yahoo! de Mexico, S.A. de C.V. (Yahoo! Mexico), Yahoo International Subsidiary Holdings, Inc., and Yahoo Hispanic Americas LLC. The complaint alleged claims of breach of contract, breach of promise, and lost profits in connection with various commercial contracts entered into among the parties between 2002 and 2004, relating to a business listings service, and alleged total damages of approximately $2.75 billion. On December 7, 2011, Yahoo! Mexico filed a counterclaim against WWD for payments of approximately $2.6 million owed to Yahoo! Mexico for services rendered. On April 10, 2012, plaintiffs withdrew their claim filed against Yahoo International Subsidiary Holdings, Inc. and Yahoo Hispanic Americas LLC.
On November 28, 2012, the 49th Civil Court of Mexico entered a non-final judgment against the Company and Yahoo! Mexico in the amount of USD $2.75 billion and a non-final judgment in favor of Yahoo! Mexico on its counterclaim against WWD in the amount of $2.6 million. The judgment against the Company and Yahoo! Mexico purported to leave open for determination in future proceedings certain other alleged damages that were not quantified in the judgment. The judgment was issued by a law clerk to the trial court judge who presided over the entire case during the trial court proceedings but stepped down from his position shortly before the judgment was entered.
112
On December 12, 2012 and December 13, 2012, respectively, Yahoo! Mexico and the Company appealed the judgment to a three-magistrate panel of the Superior Court of Justice for the Federal District (the Superior Court). On May 15, 2013, the Superior Court reversed the judgment, overturned all monetary awards against the Company and reduced the monetary award against Yahoo! Mexico to $172,500. The Superior Court affirmed the award of $2.6 million in favor of Yahoo! Mexico on its counterclaim.
Plaintiffs have appealed the Superior Courts decision to the Mexican Federal Civil Collegiate Court for the First Circuit (Collegiate Court). The Company has appealed the Superior Courts decision not to award it statutory costs in the underlying proceeding. Yahoo! Mexico has appealed the Superior Courts award of $172,500, the Superior Courts decision not to award it additional moneys beyond the $2.6 million award on its counterclaims, and the Superior Courts decision not to award it statutory costs. In the pending appeals, review is limited to whether the Superior Courts decision is unconstitutional, unlawful, or both.
The Company believes the plaintiffs claims are without legal or factual merit. First, the plaintiffs claims are based on agreements that were either terminated by agreement with releases or had expired or terminated in accordance with their terms, a non-binding letter of intent pursuant to which no definitive agreements were ever entered into by the parties, and correspondence that did not constitute agreements. Second, the loss of profits of the type claimed by plaintiffs are not awardable under Mexico law because they were not a direct and immediate consequence of a breach of contract. Of the $2.75 billion in total damages alleged by plaintiffs, more than $2.4 billion were for loss of profits. Third, the plaintiffs alleged damages and loss of profits were further precluded by the agreements at issue through, among other things, contractual and legal limitations of liability. Fourth, the plaintiffs pleadings in the complaint, as well as documentary evidence filed by the plaintiffs in support of their allegations, were generally deficient to support or establish plaintiffs claims. Fifth, the decision failed to consider substantially all of the defenses asserted by the Company and Yahoo! Mexico. Finally, the Company believes that the law clerk who entered the judgment lacked the requisite authority to issue the judgment.
The Company has not recorded an accrual for the judgment, which was reversed, as explained above. The Company cannot assure the ultimate outcome of the pending or further appeals.
The Company has determined, based on current knowledge, that the amount or range of reasonably possible losses, including reasonably possible losses in excess of amounts already accrued, is not reasonably estimable with respect to certain matters described above. The Company has also determined, based on current knowledge, that the aggregate amount or range of losses that are estimable with respect to the Companys legal proceedings, including the matters described above other than the Mexico matter, would not have a material adverse effect on the Companys consolidated financial position, results of operations or cash flows. Amounts accrued as of December 31, 2013 were not material. The ultimate outcome of legal proceedings involves judgments, estimates and inherent uncertainties, and cannot be predicted with certainty. In the event of a determination adverse to Yahoo, its subsidiaries, directors, or officers in these matters, the Company may incur substantial monetary liability, and be required to change its business practices. Either of these events could have a material adverse effect on the Companys financial position, results of operations, or cash flows. The Company may also incur substantial legal fees, which are expensed as incurred, in defending against these claims.
Note 13 STOCKHOLDERS EQUITY
The Board has the authority to issue up to 10 million shares of preferred stock and to determine the price, rights, preferences, privileges, and restrictions, including voting rights, of those shares without any further vote or action by the stockholders.
Stock Repurchases. The Company repurchases its common stock from time to time in part to reduce the dilutive effects of its stock options, awards, and employee stock purchase plan.
113
In June 2010, the Board authorized a stock repurchase program allowing the Company to repurchase up to $3 billion of its outstanding shares of common stock from time to time. That repurchase program, which by its terms, would have expired in June 2013, was exhausted during the third quarter of 2012. In May 2012, the Board authorized a stock repurchase program allowing the Company to repurchase up to an additional $5 billion of its outstanding shares of common stock from time to time. The May 2012 repurchase program, according to its terms, will expire in June 2015. In November 2013, the Board authorized an additional stock repurchase program with an authorized level of $5 billion. The November 2013 program, according to its terms, will expire in December 2016. Repurchases under the repurchase programs may take place in the open market or in privately negotiated transactions, including derivative transactions, and may be made under a Rule 10b5-1 plan.
During the year ended December 31, 2012, the Company repurchased approximately 126 million shares of its common stock under the June 2010 and May 2012 stock repurchase programs at an average price of $17.20 per share for a total of $2.2 billion. The June 2010 program was exhausted during 2012. During the year ended December 31, 2013, the Company repurchased approximately 129 million shares of its common stock under the May 2012 stock repurchase programs at an average price of $25.95 per share for a total of $3.3 billion. These repurchases included the Companys repurchase of 40 million shares of its common stock beneficially owned by Third Point LLC on July 25, 2013. These shares were repurchased pursuant to a purchase agreement entered into on July 22, 2013, prior to the market opening for trading in Yahoo stock, and at $29.11 per share, which was the closing price of the Companys common stock on July 19, 2013. The total purchase price for these shares was $1.2 billion. The repurchase transaction was funded primarily with cash as well as borrowings of $150 million under the Companys unsecured revolving credit facility that have been repaid. As of December 31, 2013, the May 2012 program had remaining authorized purchase capacity of $93 million and the November 2013 program had remaining authorized purchase capacity of $5 billion.
During the year ended December 31, 2012, the Company retired 79 million shares, resulting in reductions of $79,000 in common stock, $631 million in additional paid-in capital, and $585 million in retained earnings. During the year ended December 31, 2013, the Company retired 198 million shares, resulting in reductions of $198,000 in common stock, $1.6 billion in additional paid-in capital, and $2.9 billion in retained earnings. Treasury stock is accounted for under the cost method.
Note 14 EMPLOYEE BENEFITS
Benefit Plans. The Company maintains the Yahoo! Inc. 401(k) Plan (the 401(k) Plan) for its full-time employees in the U.S. The 401(k) Plan allows employees of the Company to contribute up to the Internal Revenue Code prescribed maximum amount. Employees may elect to contribute from 1 to 50 percent of their annual compensation to the 401(k) Plan. The Company matches employee contributions at a rate of 25 percent, up to the IRS prescribed amount. Both employee and employer contributions vest immediately upon contribution. During 2011, 2012, and 2013, the Companys contributions to the 401(k) Plan amounted to approximately $20 million, $19 million, and $18 million, respectively. The Company also contributed approximately $24 million, $22 million, and $17 million to its other defined contribution retirement benefit plans outside of the U.S. for 2011, 2012, and 2013, respectively.
Stock Plans. The 1995 Stock Plan provides for the issuance of stock-based awards to employees, including executive officers, and consultants. The 1995 Stock Plan permits the granting of incentive stock options, non-statutory stock options, restricted stock, restricted stock units, stock appreciation rights, and dividend equivalents.
Options granted under the 1995 Stock Plan before May 19, 2005 generally expire 10 years after the grant date, and options granted after May 19, 2005 generally expire seven years after the grant date. Options generally become exercisable over a four-year period based on continued employment and vest either monthly, quarterly, semi-annually, or annually.
114
The 1995 Stock Plan permits the granting of restricted stock and restricted stock units (collectively referred to as restricted stock awards). The restricted stock award vesting criteria are generally the passing of time, meeting certain performance-based objectives, or a combination of both, and continued employment through the vesting period (which varies but generally does not exceed four years). Restricted stock award grants are generally measured at fair value on the date of grant based on the number of shares granted and the quoted price of the Companys common stock. Such value is recognized as an expense over the corresponding service period.
The 1995 Stock Plan provides for the issuance of a maximum of 754 million shares of which 65 million shares were still available for award grant purposes as of December 31, 2013. Each share of the Companys common stock issued in settlement of full-value awards (which include all awards other than options and stock appreciation rights) granted on or after June 25, 2009 under the 1995 Stock Plan is counted as 1.75 shares against the 1995 Stock Plans share limit.
The Directors Plan provides for the grant of nonqualified stock options and restricted stock units to non-employee directors of the Company. The Directors Plan provides for the issuance of up to 9 million shares of the Companys common stock, of which approximately 5 million were still available for award grant purposes as of December 31, 2013. Each share of the Companys common stock issued in settlement of restricted stock units granted after the Companys 2006 annual meeting of shareholders under the Directors Plan is counted as 1.75 shares against the Directors Plans share limit.
Options granted under the Directors Plan before May 25, 2006 generally become exercisable, based on continued service as a director, for initial grants to new directors, in equal monthly installments over four years, and for annual grants, with 25 percent of such options vesting on the one year anniversary of the date of grant and the remaining options vesting in equal monthly installments over the remaining 36-month period thereafter. Such options generally expire seven to 10 years after the grant date. Options granted on or after May 25, 2006 become exercisable, based on continued service as a director, in equal quarterly installments over one year. Such options generally expire seven years after the grant date.
Restricted stock units granted under the Directors Plan generally vest in equal quarterly installments over a one-year period following the date of grant and, once vested, are generally payable in an equal number of shares of the Companys common stock on the earlier of the end of the one-year vesting period or the date the director ceases to be a member of the Board (subject to any deferral election that may be made by the director).
Non-employee directors are also permitted to elect an award of restricted stock units or a stock option under the Directors Plan in lieu of a cash payment of their quarterly Board retainer and any cash fees for serving on committees of the Board. Such stock options or restricted stock unit awards granted in lieu of cash fees are fully vested on the grant date.
From time to time the Company also assumes stock-based awards in connection with corporate mergers and acquisitions, which awards become payable in shares of the Companys common stock.
Employee Stock Purchase Plan. The Employee Stock Purchase Plan allows employees to purchase shares of the Companys common stock through payroll deductions of up to 15 percent of their compensation subject to certain Internal Revenue Code limitations. Prior to November 2012, the price of common stock purchased under the plan was equal to 85 percent of the lower of the fair market value of the common stock on the commencement date of each 24-month offering period or the specified purchase date. Beginning in November 2012, the Employee Stock Purchase Plan was modified to consist of three-month offering periods. The price of the common stock purchased under the plan after November 2012 will be equal to 90 percent of the lower of the fair market value of the common stock on the commencement date of each three-month offering period or the specified purchase date.
115
The Employee Stock Purchase Plan provides for the issuance of a maximum of 75 million shares of common stock of which 15 million shares were available as of December 31, 2013. For the years ended December 31, 2011, 2012, and 2013, stock-based compensation expense related to the activity under the plan was $46 million, $31 million, and $16 million, respectively. As of December 31, 2013, there was $3 million of unamortized stock-based compensation cost related to the Employee Stock Purchase Plan which will be recognized over a weighted average period of 0.4 years.
The Companys 1995 Stock Plan, the Directors Plan, other stock-based awards assumed through acquisitions, and the Tumblr equity holdback are collectively referred to as the Plans. Stock option activity under the Plans for the year ended December 31, 2013 is summarized as follows (in thousands, except years and per share amounts):
| Shares | Weighted Average Exercise Price per Share |
Weighted Average Remaining Contractual Life (in years) |
Aggregate Intrinsic Value |
|||||||||||||
| Outstanding at December 31, 2012 |
38,092 | $ | 21.42 | 4.19 | $ | 78,387 | ||||||||||
| Options granted |
51 | $ | 29.32 | |||||||||||||
| Options assumed in acquisitions |
1,121 | $ | 7.39 | |||||||||||||
| Options exercised(1) |
(13,707 | ) | $ | 20.32 | ||||||||||||
| Options cancelled/forfeited |
(1,198 | ) | $ | 15.13 | ||||||||||||
| Options expired |
(3,391 | ) | $ | 29.73 | ||||||||||||
|
|
|
|
|
|||||||||||||
| Outstanding at December 31, 2013 |
20,968 | $ | 20.43 | 4.20 | $ | 428,414 | ||||||||||
|
|
|
|
|
|
|
|
|
|||||||||
| Vested and expected to vest at December 31, 2013(2) |
19,701 | $ | 20.13 | 4.09 | $ | 400,054 | ||||||||||
|
|
|
|
|
|
|
|
|
|||||||||
| Exercisable at December 31, 2013 |
10,696 | $ | 22.24 | 2.64 | $ | 194,676 | ||||||||||
|
|
|
|
|
|
|
|
|
|||||||||
| (1) | The Company issued new shares to satisfy stock option exercises. |
| (2) | The expected to vest options are the result of applying the pre-vesting forfeiture rate assumptions to total outstanding options. |
The weighted average grant date fair values of all options granted and assumed in the years ended December 31, 2011, 2012, and 2013 were $5.04, $4.36, and $18.72 per share, respectively.
The aggregate intrinsic value in the table above represents the total pre-tax intrinsic value (the aggregate difference between the closing stock price of the Companys common stock on December 31, 2013 and the exercise price for in-the-money options) that would have been received by the option holders if all in-the-money options had been exercised on December 31, 2013.
The total intrinsic values of options exercised in the years ended December 31, 2011, 2012, and 2013 were $46 million, $45 million, and $122 million, respectively.
As of December 31, 2013, there was $16 million of unamortized stock-based compensation expense related to unvested stock options, which is expected to be recognized over a weighted average period of 1.5 years.
Cash received from option exercises and purchases of shares under the Employee Stock Purchase Plan for the year ended December 31, 2013 was $353 million.
The total net tax benefit attributable to stock options exercised in the year ended December 31, 2013 was $16 million.
116
The fair value of option grants is determined using the Black-Scholes option pricing model with the following weighted average assumptions:
| Stock Options | Purchase Plan(5) | |||||||||||||||||||||||
| Years Ended December 31, | Years Ended December 31, | |||||||||||||||||||||||
| 2011 | 2012 | 2013 | 2011 | 2012 | 2013 | |||||||||||||||||||
| Expected dividend yield(1) |
0.0 | % | 0.0 | % | 0 | % | 0.0 | % | 0.0 | % | 0 | % | ||||||||||||
| Risk-free interest rate(2) |
1.3 | % | 0.6 | % | 0.7 | % | 0.4 | % | 0.4 | % | 0.1 | % | ||||||||||||
| Expected volatility(3) |
36.9 | % | 31.9 | % | 33.3 | % | 35.6 | % | 33.7 | % | 31.7 | % | ||||||||||||
| Expected life (in years)(4) |
4.03 | 4.02 | 3.60 | 1.04 | 1.21 | 0.25 | ||||||||||||||||||
| (1) | The Company currently has no history or expectation of paying cash dividends on its common stock in the near future. |
| (2) | The risk-free interest rate is based on the U.S. Treasury yield for a term consistent with the expected term of the awards in effect at the time of grant. |
| (3) | The Company estimates the volatility of its common stock at the date of grant based on the implied volatility of publicly traded options on its common stock, with a term of one year or greater. |
| (4) | The expected life of stock options granted under the Plans is based on historical exercise patterns, which the Company believes are representative of future behavior. New grants issued by the Company had an expected life of 4.25 years in 2011, 4.00 years in 2012, and 2.58 years in 2013. Options assumed in acquisitions had expected lives of less than 4 years. |
| (5) | Assumptions for the Employee Stock Purchase Plan relate to the annual average of the enrollment periods. During the year ended December 31, 2012, enrollment was permitted in May and November of each year. Beginning in 2013, enrollment was permitted in February, May, August, and November of each year. |
Restricted stock awards activity under the Plans for the year ended December 31, 2013 is summarized as follows (in thousands, except per share amounts):
| Shares |
Weighted Average Grant Date Fair Value Per Share |
|||||||
| Awarded and unvested at December 31, 2012 |
33,801 | $ | 17.63 | |||||
| Granted(*) |
34,835 | $ | 25.55 | |||||
| Assumed in acquisitions |
2,364 | $ | 26.24 | |||||
| Vested |
(14,187 | ) | $ | 15.49 | ||||
| Forfeited |
(7,229 | ) | $ | 17.74 | ||||
|
|
|
|
|
|||||
| Awarded and unvested at December 31, 2013 |
49,584 | $ | 24.20 | |||||
|
|
|
|
|
|||||
| (*) | Includes the maximum number of shares issuable under the Companys performance-based restricted stock unit awards |
As of December 31, 2013, there was $615 million of unamortized stock-based compensation cost related to unvested restricted stock awards, which is expected to be recognized over a weighted average period of 2.8 years. The total fair value of restricted stock awards vested during the years ended December 31, 2011, 2012, and 2013 was $136 million, $171 million, and $220 million, respectively.
During the year ended December 31, 2013, 14.2 million shares subject to previously granted restricted stock awards vested. A majority of these vested restricted stock awards were net share settled. The Company withheld 5.3 million shares based upon the Companys closing stock price on the vesting date to settle the employees minimum statutory obligation for the applicable income and other employment taxes. The Company then remitted cash to the appropriate taxing authorities.
117
Total payments for the employees tax obligations to the relevant taxing authorities were $140 million for the year ended December 31, 2013 and are reflected as a financing activity within the consolidated statements of cash flows. The payments were used for tax withholdings related to the net share settlements of restricted stock units. The payments had the effect of share repurchases by the Company as they reduced the number of shares that would have otherwise been issued on the vesting date and were recorded as a reduction of additional paid-in capital.
In 2011, 2012, and 2013, $71 million, $36 million, and $64 million, respectively, of excess tax benefits from stock-based awards for options exercised and restricted stock awards that vested in current and prior periods were included as a source of cash flows from financing activities. These excess tax benefits represent the reduction in income taxes otherwise payable during the period, attributable to the actual gross tax benefits in excess of the expected tax benefits for options exercised and restricted stock awards that vested in current and prior periods. The Company has accumulated excess tax deductions relating to stock options exercised and restricted stock awards that vested prior to January 1, 2006 available to reduce income taxes otherwise payable. To the extent such deductions reduce income taxes payable in the current year, they are reported as financing activities in the consolidated statements of cash flows.
CEO 2012 Annual Equity Awards. Marissa A. Mayer, the Companys Chief Executive Officer, received an equity award for 2012 that will vest over three years. A total of $6 million of the grant date fair value of this equity award was granted as restricted stock units on July 26, 2012 and will vest over three years. The remaining portion of this equity award (valued at $6 million per the offer letter) was granted in November 2012 as a performance-based stock option that will vest over the two and a half years after July 26, 2012, subject to satisfaction of performance criteria. See below for additional discussion of the performance-based stock options.
After 2012, Ms. Mayer will be eligible to receive annual equity grants when such grants are made to senior executives. Subject to the discretion of the Compensation and Leadership Development Committee of the Board of Directors (the Compensation Committee), the Company contemplates that the target value of such awards will not be less than the target value of her 2012 annual grant.
CEO One-Time Retention Award. Ms. Mayer received a one-time retention equity award that will vest over five years. A total of $15 million of the grant date fair value of this equity award was granted as restricted stock units on July 26, 2012 and will vest over five years. The remaining portion of this equity award (valued at $15 million per the offer letter) was granted in November 2012 as a performance-based stock option that will vest over the four and a half years after July 26, 2012, subject to satisfaction of performance criteria. The number of performance options granted in November 2012 was determined based on the grant date fair value as of July 26, 2012. See below for additional discussion of the performance-based stock options.
CEO Make-Whole Restricted Stock Units. To partially compensate Ms. Mayer for forfeiture of compensation from her previous employer, on July 26, 2012 she was granted restricted stock units with a grant-date fair value of $14 million (the Make-Whole RSUs). Based on grant date fair values, $4 million of the Make-Whole RSUs vested in 2012, $7 million vested in 2013, and $3 million is scheduled to vest in 2014.
Performance-Based Executive Incentive Equity Awards. The financial performance stock options awarded by the Company in November 2012 include multiple performance periods. In January 2013, the Compensation and Leadership Development Committee of the Board (the Compensation Committee) established performance goals under these stock options for the first performance period (the six months ended June 30, 2013) and the second performance period (the full year ended December 31, 2013). These options were held by Ms. Mayer, Mr. de Castro, the Companys former Chief Operating Officer, and Mr. Goldman, the Companys Chief Financial Officer, (the first performance period for Mr. Goldman is the full year ending December 31, 2013). The number of stock options that ultimately vest for each performance period will range from 0 percent to 100 percent of the target amount for such period stated in each executives award agreement based on the Companys performance. The financial performance metrics (and their weightings) under the performance options are
118
revenue ex-TAC (50 percent), operating income (30 percent) and free cash flow (20 percent). The financial performance goals for each metric are established at the beginning of each performance period and, accordingly, the portion (or tranche) of the award related to each performance period is treated as a separate grant for accounting purposes. The grant date fair values of the first and second tranches of the November 2012 financial performance stock options were $12 million and $14 million, respectively, and are being recognized over six and twelve month service periods, respectively. The Company began recording stock-based compensation expense for these tranches in January 2013, at the grant date, when the financial performance goals were established and approved.
In February 2013, the Compensation Committee approved additional long-term performance-based incentive equity awards to Ms. Mayer and other senior officers. These restricted stock units generally will be eligible to vest in equal annual tranches over four years (three years for Ms. Mayer) based on the Companys attainment of annual financial performance goals as well as the executives continued employment through the vesting date. The number of restricted stock units that ultimately vest each year will range from 0 percent to 200 percent of the annual target amount stated in each executives award agreement based on the Companys performance. The annual financial performance metrics and goals are established at the beginning of each fiscal year and, accordingly, the tranche of the award related to each annual performance period goal is treated as a separate annual grant for accounting purposes. In February 2013, financial performance metrics and goals were established for the first performance period (the fiscal year ending December 31, 2013). The financial performance metrics (and their weightings) for fiscal year 2013 are revenue ex-TAC (60 percent), operating income (20 percent) and free cash flow (20 percent). The grant date fair value of the first tranche of the February 2013 annual financial performance restricted stock unit grants was $9 million and is being recognized over a one-year service period.
Note 15 RESTRUCTURING CHARGES, NET
Restructuring charges, net consists of costs associated with the Restructuring Plans Prior to 2012, the Q212 Restructuring Plan, the Q412 Korea Business Closure and the Q413 Restructuring Plan. These charges include employee severance pay and related costs, accelerations and reversals of stock-based compensation expense, facility restructuring costs, contract termination and other non-cash charges associated with the exit of facilities, as well as reversals of restructuring charges arising from changes in estimates.
For the years ended December 31, 2011, 2012, and 2013, restructuring charges, net was comprised of the following (in thousands):
| Year Ended December 31, 2011 |
Year Ended December 31, 2012 | |||||||||||||||||||
| Restructuring Plans Prior to 2012 |
Restructuring Plans Prior to 2012 |
Q212 Restructuring Plan |
Q412 Korea Business Closure |
Total | ||||||||||||||||
| Employee severance pay and related costs |
$ | 12,965 | $ | 1,169 | $ | 96,537 | $ | 4,998 | $ | 102,704 | ||||||||||
| Non-cancelable lease, contract terminations, and other charges |
10,251 | 8,462 | 9,541 | 8,996 | 26,999 | |||||||||||||||
| Other non-cash charges, net |
990 | | 40,462 | 69,434 | 109,896 | |||||||||||||||
|
|
|
|
|
|
|
|
|
|
|
|||||||||||
| Sub-total before accelerations (reversals) of stock-based compensation expense |
24,206 | 9,631 | 146,540 | 83,428 | 239,599 | |||||||||||||||
| Accelerations (reversals) of stock-based compensation expense |
214 | | (3,429 | ) | | (3,429 | ) | |||||||||||||
|
|
|
|
|
|
|
|
|
|
|
|||||||||||
| Restructuring charges, net |
$ | 24,420 | $ | 9,631 | $ | 143,111 | $ | 83,428 | $ | 236,170 | ||||||||||
|
|
|
|
|
|
|
|
|
|
|
|||||||||||
119
| Year Ended December 31, 2013 | ||||||||||||||||||||
| Restructuring Plans Prior to 2012 |
Q212 Restructuring Plan |
Q412 Korea Business Closure |
Q413 Restructuring Plan |
Total | ||||||||||||||||
| Employee severance pay and related costs (reversals) |
$ | (459 | ) | $ | (15,401 | ) | $ | (103 | ) | $ | 5,144 | $ | (10,819 | ) | ||||||
| Non-cancelable lease, contract terminations, and other charges |
13,894 | 164 | (20 | ) | | 14,038 | ||||||||||||||
| Other non-cash charges |
| | 547 | | 547 | |||||||||||||||
|
|
|
|
|
|
|
|
|
|
|
|||||||||||
| Restructuring charges (reversal), net |
$ | 13,435 | $ | (15,237 | ) | $ | 424 | $ | 5,144 | $ | 3,766 | |||||||||
|
|
|
|
|
|
|
|
|
|
|
|||||||||||
Although the Company does not allocate restructuring charges to its segments, the amounts of the restructuring charges relating to each segment are presented below. For the years ended December 31, 2011, 2012, and 2013, restructuring charges, net consists of the following (in thousands):
| Year Ended December 31, 2011 |
||||
| Restructuring Plans Prior to 2012 |
||||
| Americas |
$ | 22,244 | ||
| EMEA |
952 | |||
| Asia Pacific |
1,224 | |||
|
|
|
|||
| Restructuring charges, net |
$ | 24,420 | ||
|
|
|
|||
| Year Ended December 31, 2012 | ||||||||||||||||
| Restructuring Plans Prior to 2012 |
Q212 Restructuring Plan |
Q412 Korea Business Closure |
Total | |||||||||||||
| Americas |
$ | 9,834 | $ | 92,789 | $ | | $ | 102,623 | ||||||||
| EMEA |
(617 | ) | 45,977 | | 45,360 | |||||||||||
| Asia Pacific |
414 | 4,345 | 83,428 | 88,187 | ||||||||||||
|
|
|
|
|
|
|
|
|
|||||||||
| Restructuring charges, net |
$ | 9,631 | $ | 143,111 | $ | 83,428 | $ | 236,170 | ||||||||
|
|
|
|
|
|
|
|
|
|||||||||
| Year Ended December 31, 2013 | ||||||||||||||||||||
| Restructuring Plans Prior to 2012 |
Q212 Restructuring Plan |
Q412 Korea Business Closure |
Q413 Restructuring Plan |
Total | ||||||||||||||||
| Americas |
$ | 8,212 | $ | (7,641 | ) | $ | | $ | | $ | 571 | |||||||||
| EMEA |
4,716 | (6,998 | ) | | 5,144 | 2,862 | ||||||||||||||
| Asia Pacific |
507 | (598 | ) | 424 | | 333 | ||||||||||||||
|
|
|
|
|
|
|
|
|
|
|
|||||||||||
| Restructuring charges, net |
$ | 13,435 | $ | (15,237 | ) | $ | 424 | $ | 5,144 | $ | 3,766 | |||||||||
|
|
|
|
|
|
|
|
|
|
|
|||||||||||
Restructuring Plans Prior to 2012. Prior to 2012, the Company implemented workforce reductions, a strategic realignment, and consolidation of certain real estate facilities and data centers to reduce its cost structure, align resources with its product strategy, and improve efficiency. During the year ended December 31, 2011, the Company incurred total pre-tax cash charges of $23 million in severance, facility and other related costs, net of reversal for adjustments to original estimates totaling $12 million. In addition to the pre-tax cash charges, the Company recorded a non-cash charge of $1 million related to asset impairment. Of the $24 million in restructuring charges, net recorded in the year ended December 31, 2011, $22 million related to the Americas segment, $1 million related to the EMEA segment, and $1 million related to the Asia Pacific segment. During the
120
year ended December 31, 2012, the Company recorded total pre-tax cash charges of $10 million in severance, facility and other related costs, net of reversal for adjustments to original estimates totaling $5 million. The majority of the $10 million in restructuring charges, net recorded in the year ended December 31, 2012, related to the Americas segment. During the year ended December 31, 2013, the Company incurred total pre-tax cash charges of $13 million in facility and other related costs, net of reversal for adjustments to original estimates totaling $1 million. Of the $13 million recorded for the year ended December 31, 2013, $8 million related to the Americas segment and $5 million related to the EMEA segment.
Q212 Restructuring Plan. During the second quarter of 2012, the Company began implementing the Q212 Restructuring Plan to reduce its worldwide workforce by approximately 2,000 employees and to consolidate certain real estate and data center facilities. During the year ended December 31 2012, the Company recorded total pre-tax cash charges of $139 million in severance and facility related costs and $40 million in non-cash facility and other asset impairment charges. The total pre-tax charges were offset by changes to original estimates of $33 million in severance related costs recognized throughout 2012, primarily as a result of redeployments and voluntary resignations of employees prior to their planned severance dates and a $3 million credit related to non-cash stock-based compensation expense reversals for unvested stock awards that were forfeited. Of the $143 million in restructuring charges, net recorded in the year ended December 31, 2012, $93 million related to the Americas segment, $46 million related to the EMEA segment, and $4 million related to the Asia Pacific segment. During the year ended December 31, 2013, the Company recorded total pre-tax cash charges of $7 million in severance, facility and other related costs, which were offset by a credit of $22 million for severance related reversals due to adjustments to original estimates as a result of redeployments and voluntary resignations of employees prior to their planned severance dates. Of the $15 million credit in restructuring charges, net recorded in the year ended December 31, 2013, $7 million related to the Americas segment, $7 million related to the EMEA segment, and $1 million related to the Asia Pacific segment.
Q412 Korea Business Closure. During the fourth quarter of 2012, the Company decided to close its Korea business by the end of 2012 to streamline its operations and focus its resources. During the year ended December 31, 2012, the Company incurred total pre-tax cash charges of $13 million in severance and contract termination costs. In addition to the pre-tax cash charges, the Company recorded a non-cash charge of $86 million related to goodwill and other asset impairment and a non-cash credit approximately of $16 million related to the reversal of previously recorded cumulative foreign currency translation adjustments. As a result, the Company recorded a net $83 million in restructuring charges all related to the Asia Pacific segment for the year ended December 31, 2012. During the year ended December 31, 2013, the Company recorded net pre-tax charges of less than $1 million in severance, facility and contract termination costs related to the Asia Pacific segment.
Q413 Restructuring Plan. During the fourth quarter of 2013, the Company started the process of closing its Cairo, Egypt and Rolle, Switzerland offices as part of its continued efforts to streamline its operations and focus its resources. During the year ended December 31, 2013, the Company recorded total pre-tax cash charges of $5 million in severance and other related costs, which all related to the EMEA segment.
Restructuring Accruals. The $30 million restructuring liability as of December 31, 2013 consists of $5 million for employee severance pay expenses, which the Company expects to pay out by the end of the third quarter of 2014 and $25 million relates to non-cancelable lease and contract termination costs that the Company expects to pay over the terms of the related obligations which extend to the fourth quarter of 2021.
121
The activity in the Companys restructuring accruals for the years ended December 31, 2012 and 2013 is summarized as follows (in thousands):
| Restructuring Plans Prior to 2012 |
Q212 Restructuring Plan |
Q412 Korea Business Closure |
Q413 Restructuring Plan |
Total | ||||||||||||||||
| Balance as of January 1, 2012 |
$ | 49,127 | $ | | $ | | $ | | $ | 49,127 | ||||||||||
| Employee severance pay and related costs |
5,924 | 128,701 | 4,998 | | 139,623 | |||||||||||||||
| Non-cash reversals of stock-based compensation expense |
| (3,429 | ) | | | (3,429 | ) | |||||||||||||
| Non-cancelable lease, contract termination, and other charges |
8,792 | 9,997 | 8,996 | | 27,785 | |||||||||||||||
| Other non-cash charges, net |
| 40,462 | 69,434 | | 109,896 | |||||||||||||||
| Changes in estimates and reversals of previous charges |
(5,085 | ) | (32,620 | ) | | | (37,705 | ) | ||||||||||||
|
|
|
|
|
|
|
|
|
|
|
|||||||||||
| Restructuring charges, net for the year ended December 31, 2012 |
$ | 9,631 | $ | 143,111 | $ | 83,428 | $ | | $ | 236,170 | ||||||||||
| Cash paid |
(30,746 | ) | (68,018 | ) | (4,307 | ) | | (103,071 | ) | |||||||||||
| Non-cash reversals of stock-based compensation expense |
| 3,429 | | | 3,429 | |||||||||||||||
| Other non-cash charges, net |
(232 | ) | (40,148 | ) | (69,157 | ) | | (109,537 | ) | |||||||||||
| Foreign currency |
(64 | ) | (3,325 | ) | 138 | | (3,251 | ) | ||||||||||||
|
|
|
|
|
|
|
|
|
|
|
|||||||||||
| Balance as of December 31, 2012 |
$ | 27,716 | $ | 35,049 | $ | 10,102 | $ | | $ | 72,867 | ||||||||||
| Employee severance pay and related costs |
28 | 6,722 | 443 | 5,144 | 12,337 | |||||||||||||||
| Non-cancelable lease, contract termination, and other charges |
14,407 | 164 | 1,251 | | 15,822 | |||||||||||||||
| Other non-cash charges |
| | 547 | | 547 | |||||||||||||||
| Changes in estimates and reversals of previous charges |
(1,000 | ) | (22,123 | ) | (1,817 | ) | | (24,940 | ) | |||||||||||
|
|
|
|
|
|
|
|
|
|
|
|||||||||||
| Restructuring charges (reversals), net for the year ended December 31, 2013 |
$ | 13,435 | $ | (15,237 | ) | $ | 424 | $ | 5,144 | $ | 3,766 | |||||||||
| Cash paid |
(19,082 | ) | (16,829 | ) | (9,471 | ) | (624 | ) | (46,006 | ) | ||||||||||
| Other non-cash charges |
| | (547 | ) | | (547 | ) | |||||||||||||
| Foreign currency |
280 | (218 | ) | (171 | ) | 125 | 16 | |||||||||||||
|
|
|
|
|
|
|
|
|
|
|
|||||||||||
| Balance as of December 31, 2013 |
$ | 22,349 | $ | 2,765 | $ | 337 | $ | 4,645 | $ | 30,096 | ||||||||||
|
|
|
|
|
|
|
|
|
|
|
|||||||||||
As of December 31, restructuring accruals were included in the Companys consolidated balance sheets as follows (in thousands):
| 2012 | 2013 | |||||||
| Accrued expenses and other current liabilities |
$ | 57,642 | $ | 21,741 | ||||
| Capital lease and other long-term liabilities |
15,225 | 8,355 | ||||||
|
|
|
|
|
|||||
| Total restructuring accruals |
$ | 72,867 | $ | 30,096 | ||||
|
|
|
|
|
|||||
122
As of December 31, restructuring accruals by segment consisted of the following (in thousands):
| 2012 | 2013 | |||||||
| Americas |
$ | 42,689 | $ | 18,078 | ||||
| EMEA |
18,144 | 11,284 | ||||||
| Asia Pacific |
12,034 | 734 | ||||||
|
|
|
|
|
|||||
| Total restructuring accruals |
$ | 72,867 | $ | 30,096 | ||||
|
|
|
|
|
|||||
Note 16 INCOME TAXES
The components of income before income taxes and earnings in equity interests are as follows (in thousands):
| Years Ended December 31, | ||||||||||||
| 2011 | 2012 | 2013 | ||||||||||
| United States |
$ | 533,262 | $ | 5,056,643 | $ | 538,824 | ||||||
| Foreign |
294,254 | 157,564 | 94,459 | |||||||||
|
|
|
|
|
|
|
|||||||
| Income before income taxes and earnings in equity interests |
$ | 827,516 | $ | 5,214,207 | $ | 633,283 | ||||||
|
|
|
|
|
|
|
|||||||
The provision for income taxes is composed of the following (in thousands):
| Years Ended December 31, | ||||||||||||
| 2011 | 2012 | 2013 | ||||||||||
| Current: |
||||||||||||
| United States federal |
$ | 141,922 | $ | 2,278,759 | $ | 138,032 | ||||||
| State |
(11,037 | ) | 361,788 | 49,872 | ||||||||
| Foreign |
40,490 | 68,816 | 49,790 | |||||||||
|
|
|
|
|
|
|
|||||||
| Total current provision for income taxes |
171,375 | 2,709,363 | 237,694 | |||||||||
|
|
|
|
|
|
|
|||||||
| Deferred: |
||||||||||||
| United States federal |
77,012 | (741,628 | ) | (63,166 | ) | |||||||
| State |
(4,437 | ) | (29,470 | ) | (22,498 | ) | ||||||
| Foreign |
(2,183 | ) | 1,778 | 1,362 | ||||||||
|
|
|
|
|
|
|
|||||||
| Total deferred provision (benefit) for income taxes |
70,392 | (769,320 | ) | (84,302 | ) | |||||||
|
|
|
|
|
|
|
|||||||
| Provision for income taxes |
$ | 241,767 | $ | 1,940,043 | $ | 153,392 | ||||||
|
|
|
|
|
|
|
|||||||
The provision for income taxes differs from the amount computed by applying the federal statutory income tax rate to income before income taxes and earnings in equity interests as follows (in thousands):
| Years Ended December 31, | ||||||||||||
| 2011 | 2012 | 2013 | ||||||||||
| Income tax at the U.S. federal statutory rate of 35 percent |
$ | 289,630 | $ | 1,824,973 | $ | 221,648 | ||||||
| State income taxes, net of federal benefit |
4,627 | 237,637 | 23,000 | |||||||||
| Stock-based compensation expense |
20,021 | 19,946 | 16,015 | |||||||||
| Research tax credits |
(10,499 | ) | | (18,036 | ) | |||||||
| Effect of non-U.S. operations |
(49,781 | ) | (138,078 | ) | (47,968 | ) | ||||||
| Settlement with tax authorities |
(14,685 | ) | (4,711 | ) | (46,943 | ) | ||||||
| Remeasurement of prior year tax positions |
| | (24,246 | ) | ||||||||
| Acquisition related non-deductible expenses |
| 1,894 | 9,296 | |||||||||
| Goodwill impairment charge |
| | 22,244 | |||||||||
| Other |
2,454 | (1,618 | ) | (1,618 | ) | |||||||
|
|
|
|
|
|
|
|||||||
| Provision for income taxes |
$ | 241,767 | $ | 1,940,043 | $ | 153,392 | ||||||
|
|
|
|
|
|
|
|||||||
123
Deferred income taxes reflect the tax effects of temporary differences between the carrying amounts of assets and liabilities for financial reporting purposes and the amounts used for income tax purposes. The components of deferred income tax assets and liabilities are as follows (in thousands):
| December 31, | ||||||||
| 2012 | 2013 | |||||||
| Deferred income tax assets: |
||||||||
| Net operating loss and tax credit carryforwards |
$ | 219,054 | $ | 148,060 | ||||
| Stock-based compensation expense |
81,910 | 66,583 | ||||||
| Non-deductible reserves and expenses |
265,751 | 431,374 | ||||||
| Depreciation expense |
21,386 | 22,937 | ||||||
| Unrealized investment gains |
3,584 | 2,878 | ||||||
| Intangible assets |
5,861 | 7,764 | ||||||
|
|
|
|
|
|||||
| Gross deferred income tax assets |
597,546 | 679,596 | ||||||
| Valuation allowance |
(51,503 | ) | (36,690 | ) | ||||
|
|
|
|
|
|||||
| Deferred income tax assets |
$ | 546,043 | $ | 642,906 | ||||
|
|
|
|
|
|||||
| Deferred income tax liabilities: |
||||||||
| Purchased intangible assets |
(29,960 | ) | (156,435 | ) | ||||
| Depreciation expense |
(118,808 | ) | (86,641 | ) | ||||
| Investments in equity interests |
(13,120 | ) | (323,368 | ) | ||||
| Restructuring liabilities |
(6,547 | ) | (7,235 | ) | ||||
|
|
|
|
|
|||||
| Deferred income tax liabilities |
$ | (168,435 | ) | $ | (573,679 | ) | ||
|
|
|
|
|
|||||
| Net deferred income tax assets |
$ | 377,608 | $ | 69,227 | ||||
|
|
|
|
|
|||||
As of December 31, 2013, the Companys federal and state net operating loss carryforwards for income tax purposes were approximately $299 million and $31 million, respectively. The federal and state net operating loss carryforwards are subject to various limitations under Section 382 of the Internal Revenue Code and applicable state tax law. If not utilized, the federal and state net operating loss carryforwards will begin to expire in 2021.
The federal research and development credit expired on December 31, 2011. On January 2, 2013, the American Taxpayer Relief Act of 2012 was signed into law retroactively extending the credit for amounts paid or incurred after December 31, 2011 and before January 1, 2014. As such, the provision for income taxes for the year ended December 31, 2013 reflects the benefit of both the 2012 and 2013 federal research and development tax credit. The Companys state research tax credit carryforward for income tax purposes is approximately $177 million and it can be carried forward indefinitely. Tax credit carryforwards that result from the exercise of employee stock options are not recorded on the Companys consolidated balance sheets and are accounted for as a credit to additional paid-in capital if and when realized through a reduction in income taxes payable.
The Company has a valuation allowance of approximately $37 million as of December 31, 2013 against certain deferred income tax assets that are not more likely than not to be realized in future periods. In evaluating the Companys ability to realize its deferred income tax assets, the Company considers all available positive and negative evidence, including operating results, ongoing tax planning, and forecasts of future taxable income on a jurisdiction by jurisdiction basis. The valuation allowance as of December 31, 2013 relates to foreign net operating loss carryforwards that will reduce the provision for income taxes if and when recognized.
The U.S. Department of the Treasury issued final regulations on the deduction and capitalization of expenditures related to tangible property for income tax purposes. These regulations apply to the Companys tax year beginning on January 1, 2014. Based on its assessment as of December 31, 2013, these regulations will not have a material impact on the Companys financial position, results of operations, or cash flows.
124
In 2012, the Company made a one-time distribution of foreign earnings resulting in an overall net benefit of $117 million. During 2013, the Company recorded an additional net benefit of $36 million related to this distribution. As of December 31, 2013, the Company does not anticipate a repatriation of its undistributed foreign earnings of approximately $2.6 billion. Those earnings are principally related to Yahoo Japan. If these earnings were to be repatriated in the future, the Company may be subject to additional U.S. income taxes (subject to an adjustment for foreign tax credits). It is not practicable to determine the income tax liability that might be incurred if these earnings were to be repatriated.
The total amount of gross unrecognized tax benefits was $695 million as of December 31, 2013, of which up to $466 million would affect the Companys effective tax rate if realized. A reconciliation of the beginning and ending amount of unrecognized tax benefits in 2012 and 2013 is as follows (in thousands):
| 2012 | 2013 | |||||||
| Unrecognized tax benefits balance at January 1 |
$ | 532,862 | $ | 727,367 | ||||
| Gross increase for tax positions of prior years |
9,441 | 69,188 | ||||||
| Gross decrease for tax positions of prior years |
(32,513 | ) | (40,298 | ) | ||||
| Gross increase for tax positions of current year |
231,525 | 34,556 | ||||||
| Settlements |
(10,520 | ) | (94,640 | ) | ||||
| Lapse of statute of limitations |
(3,428 | ) | (888 | ) | ||||
|
|
|
|
|
|||||
| Unrecognized tax benefits balance at December 31 |
$ | 727,367 | $ | 695,285 | ||||
|
|
|
|
|
|||||
The remaining balances are recorded on the Companys consolidated balance sheets as follows (in thousands):
| December 31, | ||||||||
| 2012 | 2013 | |||||||
| Total unrecognized tax benefits balance |
$ | 727,367 | $ | 695,285 | ||||
| Amounts netted against related deferred tax assets |
(83,635 | ) | (89,048 | ) | ||||
|
|
|
|
|
|||||
| Unrecognized tax benefits recorded on consolidated balance sheets |
$ | 643,732 | $ | 606,237 | ||||
|
|
|
|
|
|||||
| Amounts classified as accrued expenses and other current liabilities |
$ | 30,484 | $ | | ||||
| Amounts classified as deferred and other long-term tax liabilities, net |
613,248 | 606,237 | ||||||
|
|
|
|
|
|||||
| Unrecognized tax benefits recorded on consolidated balance sheets |
$ | 643,732 | $ | 606,237 | ||||
|
|
|
|
|
|||||
The Company recognizes interest and/or penalties related to uncertain tax positions in income tax expense. To the extent accrued interest and penalties do not ultimately become payable, amounts accrued will be reduced and reflected as a reduction of the overall income tax provision in the period that such determination is made. During 2011, 2012 and 2013, interest and penalties recorded in the consolidated statements of income were a credit of $2 million and a charge of $37 million and $21 million (net of interest received of $4 million), respectively. The amounts of accrued interest and penalties recorded on the consolidated balance sheets as of December 31, 2012 and 2013 were approximately $51 million and $76 million, respectively.
In 2013, the Company settled the IRS income tax examination for the 2005 and 2006 returns resulting in a benefit of approximately $54 million. In addition, the Company recorded a reduction of tax reserves of approximately $24 million based on proposed adjustments to its intercompany transfer pricing methodology for the 2007 and 2008 returns. As of December 31, 2013, the Companys federal 2009 and 2010 income tax returns are currently under the IRS examination. The Companys 2005 through 2008 tax returns are also under various stages of audit by the California Franchise Tax Board. While the California Franchise Tax Board has not reached any conclusions on the 2007 and 2008 returns, the Company has protested the proposed California Franchise Tax Boards adjustments to the 2005 and 2006 returns. The Company is also in various stages of examination and appeal in connection with its taxes in foreign jurisdictions, which generally span tax years 2005 through 2012.
125
It is difficult to predict when the examinations will be settled or their final outcomes. The Company believes that it has adequately provided for any reasonably foreseeable adjustment and that any settlement will not have a material adverse effect on the Companys consolidated financial position, results of operations, or cash flows.
The Company may have additional tax liabilities in China related to the sale to Alibaba Group of 523 million Alibaba Group Shares that took place during the year ended December 31, 2012. Any taxes assessed and paid in China are expected to be ultimately offset and recovered in the U.S.
During the year ended December 31, 2012, tax authorities from the Brazilian State of Sao Paulo assessed certain indirect taxes against the Companys Brazilian subsidiary, Yahoo! do Brasil Internet Ltda., related to online advertising services. The assessment totaling approximately $85 million is for calendar years 2008 and 2009. The Company currently believes the assessment is without merit. The Company believes the risk of loss is remote and has not recorded an accrual for the assessment.
Note 17 TRANSACTIONS WITH RELATED PARTIES
Revenue from related parties, excluding Yahoo Japan and Alibaba Group, represented approximately 1 percent of total revenue for the years ended December 31, 2011, 2012, and 2013. Management believes that the terms of the agreements with these related parties are comparable to the terms obtained in arms-length transactions with unrelated similarly situated customers of the Company.
See Note 8Investments in Equity Interests for additional information related to transactions involving Yahoo Japan and Alibaba Group.
Note 18 SEGMENTS
The Company continues to manage its business geographically. The primary areas of measurement and decision-making are the Americas, EMEA (Europe, Middle East and Africa) and Asia Pacific. Management relies on an internal reporting process that provides revenue ex-TAC, which is defined as revenue less TAC, direct costs excluding TAC by segment, and consolidated income from operations for making decisions related to the evaluation of the financial performance of, and allocating resources to, the Companys segments.
126
The following tables present summarized information by segment (in thousands):
| Years Ended December 31, | ||||||||||||
| 2011 | 2012 | 2013 | ||||||||||
| Revenue by segment: |
||||||||||||
| Americas |
$ | 3,302,989 | $ | 3,461,633 | $ | 3,481,502 | ||||||
| EMEA |
629,383 | 472,061 | 385,186 | |||||||||
| Asia Pacific |
1,051,827 | 1,052,872 | 813,692 | |||||||||
|
|
|
|
|
|
|
|||||||
| Total revenue |
4,984,199 | 4,986,566 | 4,680,380 | |||||||||
| TAC by segment: |
||||||||||||
| Americas |
160,110 | 182,511 | 158,974 | |||||||||
| EMEA |
221,916 | 114,230 | 42,915 | |||||||||
| Asia Pacific |
221,345 | 222,165 | 52,553 | |||||||||
|
|
|
|
|
|
|
|||||||
| Total TAC |
603,371 | 518,906 | 254,442 | |||||||||
| Revenue ex-TAC by segment: |
||||||||||||
| Americas |
3,142,879 | 3,279,122 | 3,322,528 | |||||||||
| EMEA |
407,467 | 357,831 | 342,271 | |||||||||
| Asia Pacific |
830,482 | 830,707 | 761,139 | |||||||||
|
|
|
|
|
|
|
|||||||
| Total revenue ex-TAC |
4,380,828 | 4,467,660 | 4,425,938 | |||||||||
| Direct costs by segment(1): |
||||||||||||
| Americas |
696,103 | 733,316 | 747,684 | |||||||||
| EMEA |
165,750 | 161,990 | 165,719 | |||||||||
| Asia Pacific |
225,417 | 224,114 | 197,619 | |||||||||
| Global operating costs(2)(3) |
1,638,975 | 1,672,070 | 1,830,621 | |||||||||
| Depreciation and amortization |
625,864 | 649,267 | 628,778 | |||||||||
| Goodwill impairment charge |
| | 63,555 | |||||||||
| Gains on sales of patents |
| | (79,950 | ) | ||||||||
| Stock-based compensation expense |
203,958 | 224,365 | 278,220 | |||||||||
| Restructuring charges, net |
24,420 | 236,170 | 3,766 | |||||||||
|
|
|
|
|
|
|
|||||||
| Income from operations |
$ | 800,341 | $ | 566,368 | $ | 589,926 | ||||||
|
|
|
|
|
|
|
|||||||
| (1) | Direct costs for each segment include cost of revenue-other, as well as other operating expenses that are directly attributable to the segment such as employee compensation expense (excluding stock-based compensation expense), local sales and marketing expenses, and facilities expenses. Beginning in 2012, marketing and customer experience costs are managed locally and included as direct costs for each segment. Prior period amounts have been revised to conform to the current presentation. |
| (2) | Global operating costs include product development, service engineering and operations, general and administrative, and other corporate expenses that are managed on a global basis and that are not directly attributable to any particular segment. Prior to 2012, marketing and customer experience costs were managed on a global basis and included as global operating costs. Prior period amounts have been revised to conform to the current presentation. |
| (3) | The net cost reimbursements from Microsoft pursuant to the Search Agreement are primarily included in global operating costs. |
127
| Years Ended December 31, | ||||||||||||
| 2011 | 2012 | 2013 | ||||||||||
| Capital expenditures, net: |
||||||||||||
| Americas |
$ | 437,804 | $ | 437,978 | $ | 309,215 | ||||||
| EMEA |
49,371 | 27,074 | 11,435 | |||||||||
| Asia Pacific |
106,119 | 40,455 | 17,481 | |||||||||
|
|
|
|
|
|
|
|||||||
| Total capital expenditures, net |
$ | 593,294 | $ | 505,507 | $ | 338,131 | ||||||
|
|
|
|
|
|
|
|||||||
| December 31, | ||||||||
| 2012 | 2013 | |||||||
| Property and equipment, net: |
||||||||
| Americas: |
||||||||
| U.S. |
$ | 1,483,225 | $ | 1,346,889 | ||||
| Other. |
1,869 | 1,183 | ||||||
|
|
|
|
|
|||||
| Total Americas |
$ | 1,485,094 | $ | 1,348,072 | ||||
|
|
|
|
|
|||||
| EMEA |
59,416 | 44,976 | ||||||
| Asia Pacific |
141,335 | 95,470 | ||||||
|
|
|
|
|
|||||
| Total property and equipment, net |
$ | 1,685,845 | $ | 1,488,518 | ||||
|
|
|
|
|
|||||
See also Note 5Goodwill and Note 15Restructuring Charges, Net for additional information regarding segments.
Enterprise Wide Disclosures:
The following table presents revenue for groups of similar services (in thousands):
| Years Ended December 31, | ||||||||||||
| 2011 | 2012 | 2013 | ||||||||||
| Display |
$ | 2,160,309 | $ | 2,142,818 | $ | 1,949,830 | ||||||
| Search |
1,853,110 | 1,885,860 | 1,741,791 | |||||||||
| Other |
970,780 | 957,888 | 988,759 | |||||||||
|
|
|
|
|
|
|
|||||||
| Total revenue |
$ | 4,984,199 | $ | 4,986,566 | $ | 4,680,380 | ||||||
|
|
|
|
|
|
|
|||||||
| Years Ended December 31, | ||||||||||||
| 2011 | 2012 | 2013 | ||||||||||
| Revenue: |
||||||||||||
| U.S. |
$ | 3,112,998 | $ | 3,294,206 | $ | 3,317,794 | ||||||
| International |
1,871,201 | 1,692,360 | 1,362,586 | |||||||||
|
|
|
|
|
|
|
|||||||
| Total revenue |
$ | 4,984,199 | $ | 4,986,566 | $ | 4,680,380 | ||||||
|
|
|
|
|
|
|
|||||||
Revenue is attributed to individual countries according to the online property that generated the revenue. No single foreign country accounted for more than 10 percent of the Companys revenue in 2011, 2012, and 2013, respectively.
Note 19 SEARCH AGREEMENT WITH MICROSOFT CORPORATION
On December 4, 2009, the Company entered into the Search Agreement with Microsoft, which provides for Microsoft to be the exclusive algorithmic and paid search services provider on Yahoo Properties and non-exclusive provider of such services on Affiliate sites. The Company also entered into a License Agreement with
128
Microsoft. Under the License Agreement, Microsoft acquired an exclusive 10-year license to the Companys core search technology and has the ability to integrate this technology into its existing Web search platforms. On February 18, 2010, the Company received regulatory clearance from both the U.S. Department of Justice and the European Commission and on February 23, 2010 the Company commenced implementation of the Search Agreement on a market-by-market basis. Under the Search Agreement, the Company is the exclusive worldwide relationship sales force for both companies premium search advertisers, which include advertisers meeting certain spending or other criteria, advertising agencies that specialize in or offer search engine marketing services and their clients, and resellers and their clients seeking assistance with their paid search accounts. The term of the Search Agreement is 10 years from February 23, 2010, subject to earlier termination as provided in the Search Agreement. Approximately 20 percent, 25 percent, and 31 percent of the Companys revenue for the years ended December 31, 2011, 2012 and, 2013, respectively, was attributable to the Search Agreement.
During the first five years of the term of the Search Agreement, in the transitioned markets, the Company is entitled to receive 88 percent of the revenue generated from Microsofts services on Yahoo Properties (the Revenue Share Rate) and the Company is also entitled to receive 88 percent of the revenue generated from Microsofts services on Affiliate sites after the Affiliates share of revenue. For new Affiliates during the term of the Search Agreement, and for all Affiliates after the first five years of such term, the Company will receive 88 percent of the revenue generated from Microsofts services on Affiliate sites after the Affiliates share of revenue and certain Microsoft costs are deducted. On February 23, 2015 (the fifth anniversary of the date that implementation of the Search Agreement commenced), Microsoft will have the option to terminate the Companys sales exclusivity for premium search advertisers. If Microsoft exercises this option, the Revenue Share Rate will increase to 93 percent for the remainder of the term of the Search Agreement, unless the Company exercises its option to retain the Companys sales exclusivity, in which case the Revenue Share Rate would be reduced to 83 percent for the remainder of the term. If Microsoft does not exercise such option, the Revenue Share Rate will be 90 percent for the remainder of the term of the Search Agreement. In the transitioned markets, the Company reports as revenue the 88 percent revenue share as the Company is not the primary obligor in the arrangement with the advertisers and publishers. The underlying search advertising services are provided by Microsoft.
As of December 31, 2012 and 2013, the Company had collected total amounts of nil and $21 million, respectively, on behalf of Microsoft and Affiliates, which was included in cash and cash equivalents with a corresponding liability in accrued expenses and other current liabilities. The Companys 88 percent share in connection with the Search Agreement, which is included in accounts receivable, net, was $258 million and $305 million as of December 31, 2012 and December 31, 2013, respectively.
Under the Search Agreement, for each market, Microsoft generally guarantees Yahoos revenue per search (RPS Guarantee) on Yahoo Properties only for 18 months after the transition of paid search services to Microsofts platform in that market based on the difference in revenue per search between the pre-transition and post-transition periods and certain other factors. The Company records the RPS Guarantee as search revenue in the quarter the amount becomes fixed, which is typically the quarter in which the associated shortfall in revenue per search occurred. In the fourth quarter of 2011, Microsoft agreed to extend the RPS Guarantee in the U.S. and Canada through March 2013, and in the second quarter of 2013, Microsoft extended the RPS Guarantee in the U.S. through March 2014. In June 2013, Microsoft and Yahoo agreed upon the RPS Guarantee payment amounts to be paid to the Company for the quarters ended December 31, 2012, March 31, 2013 and June 30, 2013. The Company also agreed to fixed quarterly payments in lieu of the RPS Guarantee in the U.S. for the quarters ending September 30, 2013, December 31, 2013 and March 31, 2014. In addition, the Company agreed to waive its right to receive any future RPS Guarantee payments in all other markets except Taiwan and Hong Kong.
The Company completed the transition of its algorithmic and paid search platforms to the Microsoft platform in the U.S. and Canada in the fourth quarter of 2010. In 2011, the Company completed the transition of algorithmic search in all other markets. By the end of 2012, the Company completed the transition of paid search in India, most of the EMEA markets, and six markets in Latin America. By the end of 2013, the Company had substantially completed the transition of paid search, including the transition of paid search in Taiwan and Hong Kong.
129
From February 23, 2010 until the applicable services were fully transitioned to Microsoft in all markets, Microsoft was required under the Search Agreement to reimburse the Company for the costs of operating algorithmic and paid search services subject to specified exclusions and limitations. The Companys results for the years ended December 31, 2011, 2012, and 2013 reflect $212 million, $67 million, and $49 million, respectively, in search operating cost reimbursements from Microsoft under the Search Agreement.
The Companys results for the year ended December 31, 2011 reflect transition cost reimbursements from Microsoft under the Search Agreement, which were equal to the transition costs of $26 million incurred by Yahoo related to the Search Agreement in the year ended December 31, 2011. During the third quarter of 2011, the Companys cumulative transition costs exceeded Microsofts $150 million reimbursement cap under the Search Agreement. Transition costs the Company incurs in excess of the $150 million reimbursement cap are not subject to reimbursement.
Reimbursement receivables are recorded as the reimbursable costs are incurred and are applied against the operating expense categories in which the costs were incurred. As of December 31, 2012, a total of $67 million of search operating cost reimbursable had been incurred by the Company related to the Search Agreement. Of that amount, $5 million had not been received from Microsoft and was classified as part of prepaid expenses and other current assets on the Companys consolidated balance sheets as of December 31, 2012. As of December 31, 2013, a total of $49 million of search operating cost reimbursable had been incurred by the Company related to the Search Agreement. Of that amount, $5 million had not been received from Microsoft and was classified as part of prepaid expenses and other current assets on the Companys consolidated balance sheets as of December 31, 2013.
Note 20 SUBSEQUENT EVENTS
Stock Repurchase Transactions. From January 1, 2014 through February 28, 2014, the Company repurchased approximately 9 million shares of its common stock at an average price of $37.75 per share, for a total of $332 million.
130
Schedule IIValuation and Qualifying Accounts
Years Ended December 31, 2011, 2012, and 2013
| Balance at Beginning of Year |
Charged to Expenses |
Write-Offs Net of, Recoveries |
Balance at End of Year |
|||||||||||||
| (In thousands) | ||||||||||||||||
| Accounts receivable |
||||||||||||||||
| Allowance for doubtful accounts |
||||||||||||||||
| 2011 |
22,975 | 18,147 | (10,980 | ) | 30,142 | |||||||||||
| 2012 |
30,142 | 12,868 | (10,375 | ) | 32,635 | |||||||||||
| 2013 |
32,635 | 10,278 | (7,364 | ) | 35,549 | |||||||||||
| Balance at Beginning of Year |
Charged to Expenses |
Charged (Credited) to Other Accounts(*) |
Balance at End of Year |
|||||||||||||
| (In thousands) | ||||||||||||||||
| Deferred tax asset valuation allowance |
||||||||||||||||
| 2011 |
60,176 | (5,975 | ) | (1,061 | ) | 53,140 | ||||||||||
| 2012 |
53,140 | (82 | ) | (1,555 | ) | 51,503 | ||||||||||
| 2013 |
51,503 | (4,595 | ) | (10,218 | ) | 36,690 | ||||||||||
| (*) | Amounts not charged (credited) to expenses are charged (credited) to stockholders equity, deferred tax assets (liabilities), or goodwill. |
131
Selected Quarterly Financial Data
(Unaudited)
| Quarters Ended | ||||||||||||||||||||||||||||||||
| March
31, 2012(1) |
June
30, 2012(2) |
September
30, 2012(3) |
December
31, 2012(4) |
March
31, 2013(5) |
June
30, 2013(6) |
September
30, 2013(7) |
December
31, 2013(8) |
|||||||||||||||||||||||||
| (In thousands, except per share amounts) | ||||||||||||||||||||||||||||||||
| Revenue |
$ | 1,221,233 | $ | 1,217,794 | $ | 1,201,732 | $ | 1,345,807 | $ | 1,140,368 | $ | 1,135,244 | $ | 1,138,973 | $ | 1,265,795 | ||||||||||||||||
| Total operating expenses |
$ | 1,051,857 | $ | 1,162,981 | $ | 1,049,543 | $ | 1,155,817 | $ | 954,398 | $ | 998,265 | $ | 1,046,214 | $ | 1,091,577 | ||||||||||||||||
| Income from operations |
$ | 169,376 | $ | 54,813 | $ | 152,189 | $ | 189,990 | $ | 185,970 | $ | 136,979 | $ | 92,759 | $ | 174,218 | ||||||||||||||||
| Other income, net |
$ | 2,278 | $ | 20,175 | $ | 4,607,656 | $ | 17,730 | $ | 17,072 | $ | 23,606 | $ | 5,370 | $ | (2,691 | ) | |||||||||||||||
| Provision for income taxes |
$ | (56,419 | ) | $ | (26,523 | ) | $ | (1,774,094 | ) | $ | (83,007 | ) | $ | (29,736 | ) | $ | (50,267 | ) | $ | (31,891 | ) | $ | (41,498 | ) | ||||||||
| Earnings in equity interests |
$ | 172,243 | $ | 179,991 | $ | 175,265 | $ | 148,939 | $ | 217,588 | $ | 224,690 | $ | 232,756 | $ | 221,641 | ||||||||||||||||
| Net income attributable to Yahoo! Inc. |
$ | 286,343 | $ | 226,631 | $ | 3,160,238 | $ | 272,267 | $ | 390,285 | $ | 331,150 | $ | 296,656 | $ | 348,190 | ||||||||||||||||
|
|
|
|
|
|
|
|
|
|
|
|
|
|
|
|
|
|||||||||||||||||
| Net income attributable to Yahoo! Inc. common stockholders per sharebasic |
$ | 0.24 | $ | 0.19 | $ | 2.66 | $ | 0.24 | $ | 0.36 | $ | 0.31 | $ | 0.29 | $ | 0.34 | ||||||||||||||||
|
|
|
|
|
|
|
|
|
|
|
|
|
|
|
|
|
|||||||||||||||||
| Net income attributable to Yahoo! Inc. common stockholders per sharediluted |
$ | 0.23 | $ | 0.18 | $ | 2.64 | $ | 0.23 | $ | 0.35 | $ | 0.30 | $ | 0.28 | $ | 0.33 | ||||||||||||||||
|
|
|
|
|
|
|
|
|
|
|
|
|
|
|
|
|
|||||||||||||||||
| Shares used in per share calculation basic |
1,215,783 | 1,213,320 | 1,186,046 | 1,155,950 | 1,094,170 | 1,079,389 | 1,024,289 | 1,012,972 | ||||||||||||||||||||||||
|
|
|
|
|
|
|
|
|
|
|
|
|
|
|
|
|
|||||||||||||||||
| Shares used in per share calculation diluted |
1,226,486 | 1,221,719 | 1,195,085 | 1,168,336 | 1,108,095 | 1,094,694 | 1,041,698 | 1,038,754 | ||||||||||||||||||||||||
|
|
|
|
|
|
|
|
|
|
|
|
|
|
|
|
|
|||||||||||||||||
| (1) | Net income attributable to Yahoo! Inc. for the quarter ended March 31, 2012 includes net restructuring charges of $6 million. |
| (2) | Net income attributable to Yahoo! Inc. for the quarter ended June 30, 2012 includes net restructuring charges of $129 million. |
| (3) | Net income attributable to Yahoo! Inc. for the quarter ended September 30, 2012 includes net restructuring charges of $25 million and pre-tax gain of $4.6 billion related to the sale of Alibaba Group Shares, which is included in other income, net. |
| (4) | Net income attributable to Yahoo! Inc. for the quarter ended December 31, 2012 includes a one-time distribution of foreign earnings resulting in an overall net benefit of approximately $117 million and net restructuring charges of $77 million. |
| (5) | Net income attributable to Yahoo! Inc. for the quarter ended March 31, 2013 includes net restructuring reversals of $7 million. |
| (6) | Net income attributable to Yahoo! Inc. for the quarter ended June 30, 2013 includes net restructuring charges of $4 million. |
| (7) | Net income attributable to Yahoo! Inc. for the quarter ended September 30, 2013 includes net restructuring reversals of less than $1 million. |
132
| (8) | Net income attributable to Yahoo! Inc. for the quarter ended December 31, 2013 includes a gain on sale of patents of $70 million, a goodwill impairment charge of $64 million, and net restructuring charges of $8 million. |
| Item 9. | Changes in and Disagreements With Accountants on Accounting and Financial Disclosure |
None.
| Item 9A. | Controls and Procedures |
Evaluation of Disclosure Controls and Procedures
The Companys management, with the participation of the Companys principal executive officer and principal financial officer, has evaluated the effectiveness of the Companys disclosure controls and procedures (as such term is defined in Rules 13a-15(e) and 15d-15(e) under the Exchange Act) as of the end of the period covered by this report. Based on such evaluation, the Companys principal executive officer and principal financial officer have concluded that, as of the end of such period, the Companys disclosure controls and procedures were effective.
Managements Report on Internal Control Over Financial Reporting
The Companys management is responsible for establishing and maintaining adequate internal control over financial reporting as defined in Rules 13a-15(f) and 15d-15(f) under the Exchange Act. Under the supervision and with the participation of the Companys management, including its principal executive officer and principal financial officer, the Company conducted an evaluation of the effectiveness of its internal control over financial reporting based on criteria established in the framework in Internal ControlIntegrated Framework issued by the Committee of Sponsoring Organizations of the Treadway Commission (1992 framework). Based on this evaluation, the Companys management concluded that its internal control over financial reporting was effective as of December 31, 2013.
Because of its inherent limitations, internal control over financial reporting may not prevent or detect all misstatements. Also, projections of any evaluation of effectiveness to future periods are subject to the risk that controls may become inadequate because of changes in conditions, or that the degree of compliance with the policies or procedures may deteriorate.
The Companys independent registered public accounting firm has issued an attestation report regarding its assessment of the Companys internal control over financial reporting as of December 31, 2013, which appears on page 74.
Changes in Internal Control Over Financial Reporting
There have been no changes in Yahoos internal control over financial reporting (as such term is defined in Rules 13a-15(f) and 15d-15(f) under the Exchange Act) during the quarter ended December 31, 2013 that have materially affected, or are reasonably likely to materially affect, internal control over financial reporting.
| Item 9B. | Other Information |
Not applicable.
133
Part III
| Item 10. | Directors, Executive Officers and Corporate Governance |
The information required by this item is incorporated by reference to Yahoos Proxy Statement for its 2014 Annual Meeting of Shareholders to be filed with the SEC within 120 days after the end of the fiscal year ended December 31, 2013.
In addition, the Board has adopted a code of ethics, which is posted on the Companys Website at www.yahoo.com. The code of ethics may be found as follows: From our main Web page, first click on About Yahoo at the bottom right of the page, then on More About Yahoo, then on Investor Relations in the left column, then on Corporate Governance then on Documents and then click on Yahoo Code of Ethics.
The Companys code of ethics applies to the Companys directors and employees, including our Chief Executive Officer, Chief Financial Officer, Principal Accounting Officer and Global Controller, and to contractors of the Company. The code of ethics sets forth the fundamental principles and key policies and procedures that govern the conduct of the Companys business. The Companys employees receive training on the code of ethics. We intend to disclose any amendment to, or waiver from, the code of ethics for our directors and executive officers, including our Principal Executive Officer, Principal Financial Officer, Principal Accounting Officer or Global Controller or persons performing similar functions, to the extent disclosure is required by applicable rules of the SEC and NASDAQ Stock Market LLC by posting such information on our Website, at the address and location specified above.
| Item 11. | Executive Compensation |
The information required by this item is incorporated by reference to Yahoos Proxy Statement for its 2014 Annual Meeting of Shareholders to be filed with the SEC within 120 days after the end of the fiscal year ended December 31, 2013.
| Item 12. | Security Ownership of Certain Beneficial Owners and Management and Related Stockholder Matters |
The information required by this item is incorporated by reference to Yahoos Proxy Statement for its 2014 Annual Meeting of Shareholders to be filed with the SEC within 120 days after the end of the fiscal year ended December 31, 2013.
| Item 13. | Certain Relationships and Related Transactions, and Director Independence |
The information required by this item is incorporated by reference to Yahoos Proxy Statement for its 2014 Annual Meeting of Shareholders to be filed with the SEC within 120 days after the end of the fiscal year ended December 31, 2013.
| Item 14. | Principal Accounting Fees and Services |
The information required by this item is incorporated by reference to Yahoos Proxy Statement for its 2014 Annual Meeting of Shareholders to be filed with the SEC within 120 days after the end of the fiscal year ended December 31, 2013.
134
Part IV
| Item 15. | Exhibits, Financial Statement Schedules |
(a) The following documents are filed as part of this report:
1. Consolidated Financial Statements:
| Page | ||||
| Index To Consolidated Financial Statements |
||||
| Consolidated Financial Statements: |
||||
| 74 | ||||
| Consolidated Balance Sheets as of December 31, 2012 and 2013 |
75 | |||
| Consolidated Statements of Income for each of the three years in the period ended December 31, 2013 |
76 | |||
| 77 | ||||
| 78 | ||||
| 80 | ||||
| 82 | ||||
| 2. Financial Statement Schedules: |
||||
| Financial Statement Schedules: |
||||
| 131 | ||||
| All other schedules are omitted because they are not applicable or the required information is shown in the Consolidated Financial Statements or Notes thereto |
||||
| Supplementary Financial Data: |
||||
| Selected Quarterly Financial Data (unaudited) for the two years ended December 31, 2013 |
132 | |||
| 3. | Exhibits: |
The exhibits listed in the Exhibit Index (following the signatures page of this report) are filed with, or incorporated by reference in, this report.
135
Pursuant to the requirements of Section 13 or 15(d) of the Securities Exchange Act of 1934, the Registrant has duly caused this report to be signed on its behalf by the undersigned, thereunto duly authorized, on the 28th day of February 2014.
| YAHOO! INC. | ||
| By: | /S/ KEN GOLDMAN |
|
| Ken Goldman | ||
| Chief Financial Officer | ||
Power of Attorney
KNOW ALL PERSONS BY THESE PRESENTS, that each person whose signature appears below constitutes and appoints Ken Goldman and Ronald S. Bell, or either of them, his or her attorneys-in-fact, each with the power of substitution, for him or her in any and all capacities, to sign any amendments to this Annual Report on Form 10-K and to file the same, with Exhibits thereto and other documents in connection therewith with the Securities and Exchange Commission, hereby ratifying and confirming all that each of said attorneys-in-fact, or substitute or substitutes may do or cause to be done by virtue hereof.
Pursuant to the requirements of the Securities Exchange Act of 1934, this report has been signed below by the following persons on behalf of the Registrant and in the capacities and on the dates indicated:
| Signature |
Title |
Date |
||
| /S/ MARISSA A. MAYER Marissa A. Mayer |
Chief Executive Officer, President and Director (Principal Executive Officer) |
February 28, 2014 | ||
| /S/ KEN GOLDMAN Ken Goldman |
Chief Financial Officer (Principal Financial Officer) |
February 28, 2014 | ||
| /S/ AMAN S. KOTHARI Aman S. Kothari |
SVP, Global Controller and Chief Accounting Officer (Principal Accounting Officer) |
February 28, 2014 | ||
| /S/ MAYNARD G. WEBB, JR. Maynard G. Webb, Jr. |
Chairman of the Board | February 28, 2014 | ||
| /S/ JOHN D. HAYES John D. Hayes |
Director | February 28, 2014 | ||
| /S/ SUSAN M. JAMES Susan M. James |
Director | February 28, 2014 | ||
| /S/ MAX R. LEVCHIN Max R. Levchin |
Director | February 28, 2014 | ||
| /S/ PETER LIGUORI Peter Liguori |
Director | February 28, 2014 | ||
| /S/ THOMAS J. MCINERNEY Thomas J. McInerney |
Director | February 28, 2014 | ||
136
EXHIBIT INDEX
The following exhibits are included, or incorporated by reference, in this Annual Report on Form 10-K (and are numbered in accordance with Item 601 of Regulation S-K). Pursuant to Item 601(a)(2) of Regulation S-K, this exhibit index immediately precedes the exhibits.
| Exhibit |
Description |
|
| 2.1 | Share Repurchase and Preference Share Sale Agreement, by and between Alibaba Group Holding Limited, the Registrant, and Yahoo! Hong Kong Holdings Limited, dated as of May 20, 2012 (previously filed as Exhibit 2.1 to the Registrants Current Report on Form 8-K filed May 24, 2012 and incorporated herein by reference). | |
| 2.2 | First Amendment to Share Repurchase and Preference Share Sale Agreement, by and between Alibaba Group Holding Limited, the Registrant, and Yahoo! Hong Kong Holdings Limited, dated as of September 11, 2012 (previously filed as Exhibit 2.2 to the Registrants Current Report on Form 8-K filed September 19, 2012 and incorporated herein by reference). | |
| 2.3 | Second Amendment to Share Repurchase and Preference Share Sale Agreement, by and among Alibaba Group Holding Limited, the Registrant, and Yahoo! Hong Kong Holdings Limited, dated as of October 14, 2013 (previously filed as Exhibit 2.3 to the Registrants Current Report on Form 8-K filed October 15, 2013 and incorporated herein by reference). | |
| 3.1(A) | Amended and Restated Certificate of Incorporation of the Registrant (previously filed as Exhibit 3.1 to the Registrants Quarterly Report on Form 10-Q filed July 28, 2000 and incorporated herein by reference). | |
| 3.1(B) | Certificate of Designation, Preferences and Rights of Series A Junior Participating Preferred Stock of the Registrant (previously filed as Exhibit 4.8 to the Registrants Quarterly Report on Form 10-Q filed May 4, 2001 and incorporated herein by reference). | |
| 3.2 | Amended and Restated Bylaws of the Registrant (previously filed as Exhibit 3.1 to the Registrants Current Report on Form 8-K/A filed December 20, 2010 and incorporated herein by reference). | |
| 4.1 | Form of the Registrants Common Stock certificate (previously filed as Exhibit 4.1 to the Registrants Quarterly Report on Form 10-Q filed November 12, 2013 and incorporated herein by reference). | |
| 4.2* | Indenture (including form of Notes) with respect to the Registrants 0.00% Convertible Senior Notes due 2018, dated as of November 26, 2013, between the Registrant and The Bank of New York Mellon Trust Company, N.A., as trustee (Reflects minor corrections to Edgar conversion errors where a plus (+) was reflected as a minus (-) in certain conversion formulas in Section 14.04 of the indenture). | |
| 10.1+ | Form of Indemnification Agreement between the Registrant and each of its directors and executive officers (previously filed as Exhibit 10.1 to the Registrants Quarterly Report on Form 10-Q filed November 6, 2009 and incorporated herein by reference). | |
| 10.2(A)+ | Yahoo! Inc. 1995 Stock Plan (previously filed as Exhibit 10.1 to the Registrants Current Report on Form 8-K filed July 13, 2012 and incorporated herein by reference). | |
| 10.2(B)+ | Form of Stock Option Agreement, including Notice of Stock Option Grant, under the Yahoo! Inc.1995 Stock Plan (previously filed as Exhibit 10.2(B) to the Registrants Quarterly Report on Form 10-Q filed August 8, 2013 and incorporated herein by reference). | |
137
| Exhibit |
Description |
|
| 10.2(C)+ | Form of Stock Option Agreement for Executives, including Notice of Stock Option Grant to Executive, under the Yahoo! Inc. 1995 Stock Plan (previously filed as Exhibit 10.2(C) to the Registrants Quarterly Report on Form 10-Q filed August 8, 2013 and incorporated herein by reference). | |
| 10.2(D)+ | Form of Restricted Stock Unit Award Agreement, including Notice of Grant, under the Yahoo! Inc. 1995 Stock Plan (previously filed as Exhibit 10.2(D) to the Registrants Quarterly Report on Form 10-Q filed August 8, 2013 and incorporated herein by reference). | |
| 10.2(E)+ | Form of Restricted Stock Unit Award Agreement for Executives, including Notice of Grant, under the Yahoo! Inc. 1995 Stock Plan (previously filed as Exhibit 10.2(E) to the Registrants Quarterly Report on Form 10-Q filed August 8, 2013 and incorporated herein by reference). | |
| 10.2(F)+ | Form of Restricted Stock Unit Award Agreement for Executives (version 2) under the Yahoo! Inc. 1995 Stock Plan (previously filed as Exhibit 10.2(F) to the Registrants Annual Report on Form 10-K filed February 29, 2012 and incorporated herein by reference). | |
| 10.2(G)+ | Form of Performance Restricted Stock Unit Award Agreement (TSR version) under the Yahoo! Inc. 1995 Stock Plan (previously filed as Exhibit 10.2(F) to the Registrants Annual Report on Form 10-K filed February 26, 2010 and incorporated herein by reference). | |
| 10.2(H)+ | Form of Performance Restricted Stock Unit Award Agreement (2010 AFP version) under the Yahoo! Inc. 1995 Stock Plan (previously filed as Exhibit 10.2(I) to the Registrants Annual Report on Form 10-K filed February 26, 2010 and incorporated herein by reference). | |
| 10.2(I)+ | Form of Letter Amendment (2011) to Performance Restricted Stock Unit Award Agreement (2010 AFP version) under the Yahoo! Inc. 1995 Stock Plan (previously filed as Exhibit 10.2(K) to the Registrants Annual Report on Form 10-K filed February 28, 2011 and incorporated herein by reference). | |
| 10.2(J)+ | Form of Second Letter Amendment (2012) to Performance Restricted Stock Unit Award Agreement (2010 AFP version) under the Yahoo! Inc. 1995 Stock Plan (previously filed as Exhibit 10.2(M) to the Registrants Annual Report on Form 10-K filed February 29, 2012 and incorporated herein by reference). | |
| 10.2(K)+ | Form of Performance Restricted Stock Unit Award Agreement under the Yahoo! Inc. 1995 Stock Plan (previously filed as Exhibit 10.2(L) to the Registrants Annual Report on Form 10-K filed February 28, 2011 and incorporated herein by reference). | |
| 10.2(L)+ | Form of Restricted Stock Award Agreement under the Yahoo! 1995 Stock Plan (previously filed as Exhibit 10.2(F) to the Registrants Quarterly Report on Form 10-Q filed November 6, 2009 and incorporated herein by reference). | |
| 10.2(M)+ | Form of Stock Appreciation Rights Award Agreement under the Yahoo! Inc. 1995 Stock Plan (previously filed as Exhibit 10.23(D) to the Registrants Quarterly Report on Form 10-Q filed August 8, 2007 and incorporated herein by reference). | |
| 10.2(N)+ | Form of Performance Restricted Stock Unit Award Agreement for Executives, including Notice of Grant, under the Yahoo! Inc. 1995 Stock Plan (previously filed as Exhibit 10.2 to the Registrants Current Report on Form 8-K filed March 6, 2013 and incorporated herein by reference). | |
| 10.2(O)+ | Form of Performance Restricted Stock Unit Award Agreement for Executives (2012 TSR version) under the Yahoo! Inc. 1995 Stock Plan (previously filed as Exhibit 10.2(O) to the Registrants Quarterly Report on Form 10-Q filed May 7, 2013 and incorporated herein by reference). | |
138
| Exhibit |
Description |
|
| 10.2(P)+ | Form of Restricted Stock Unit Award Agreement Letter Amendment between the Registrant and executives regarding tax withholding elections (previously filed as Exhibit 10.2(P) to the Registrants Quarterly Report on Form 10-Q filed November 12, 2013 and incorporated herein by reference). | |
| 10.3(A)+ | Yahoo! Inc. 1996 Employee Stock Purchase Plan (previously filed as Exhibit 10.3(A) to the Registrants Quarterly Report on Form 10-Q filed November 8, 2012 and incorporated herein by reference). | |
| 10.3(B)+ | Form of Enrollment Agreement under the Yahoo! Inc. 1996 Employee Stock Purchase Plan (previously filed as Exhibit 10.3(B) to the Registrants Quarterly Report on Form 10-Q filed November 8, 2012 and incorporated herein by reference). | |
| 10.4(A)+ | Yahoo! Inc. 1996 Directors Stock Plan (previously filed as Exhibit 10.2 to the Registrants Current Report on Form 8-K filed July 13, 2012 and incorporated herein by reference). | |
| 10.4(B)+ | Form of Director Nonstatutory Stock Option Agreement, including Notice of Grant, under the Yahoo! Inc. 1996 Directors Stock Plan (previously filed as Exhibit 10.4(B) to the Registrants Quarterly Report on Form 10-Q filed August 9, 2010 and incorporated herein by reference). | |
| 10.4(C)+ | Form of Notice of Restricted Stock Unit Grant and Director Restricted Stock Unit Award Agreement under the Yahoo! Inc. 1996 Directors Stock Plan (previously filed as Exhibit 10.4(C) to the Registrants Quarterly Report on Form 10-Q filed August 9, 2010 and incorporated herein by reference). | |
| 10.5 | Joint Venture Agreement dated April 1, 1996 by and between the Registrant and SOFTBANK Corporation (previously filed as Exhibit 10.7 to the Registrants Annual Report on Form 10-K filed March 21, 2003 and incorporated herein by reference). | |
| 10.6 | Amendment Agreement dated September 17, 1997 by and between Registrant and SOFTBANK Corporation (previously filed as Exhibit 10.11 to the Registrants Annual Report on Form 10-K filed March 21, 2003 and incorporated herein by reference). | |
| 10.7 | Yahoo Japan License Agreement dated April 1, 1996 by and between the Registrant and Yahoo Japan Corporation (previously filed as Exhibit 10.43 to Amendment No. 2 to the Registrants Registration Statement on Form S-3, Registration No. 333-100298, filed on December 23, 2002 and incorporated herein by reference). | |
| 10.8 | Amendment to Yahoo Japan License Agreement dated September 12, 1997 by and between the Registrant and Yahoo Japan Corporation (previously filed as Exhibit 10.40 to Amendment No. 1 of the Registrants Registration Statement on Form S-3, Registration No. 333-100298, filed on November 27, 2002 and incorporated herein by reference). | |
| 10.9 | Amendment No. 2 to Yahoo Japan License Agreement dated January 31, 2005 by and between the Registrant and Yahoo Japan Corporation (previously filed as Exhibit 10.30 to the Registrants Annual Report on Form 10-K filed March 11, 2005 and incorporated herein by reference). | |
| 10.10+ | Summary of Compensation Payable to Named Executive Officers (previously filed as Exhibit 10.10 to the Registrants Quarterly Report on Form 10-Q filed November 8, 2012 and incorporated herein by reference). | |
| 10.11+ | Yahoo! Inc. Executive Incentive Plan for 2013 (previously filed as Exhibit 10.1 to the Registrants Current Report on Form 8-K filed March 6, 2013 and incorporated herein by reference). | |
| 10.12+ | Form of Severance Agreement (2013 version) (previously filed as Exhibit 10.6 to the Registrants Current Report on Form 8-K filed March 6, 2013 and incorporated herein by reference). | |
139
| Exhibit |
Description |
|
| 10.13+ | Yahoo! Inc. Change in Control Employee Severance Plan for Level I and Level II Employees, as amended on December 10, 2008 (previously filed as Exhibit 10.15 to the Registrants Annual Report on Form 10-K filed February 27, 2009 and incorporated herein by reference). | |
| 10.14(A) | Letter Agreement, dated July 29, 2009, between the Registrant and Microsoft Corporation (previously filed as Exhibit 10.21(A) to the Registrants Quarterly Report on Form 10-Q filed November 6, 2009 and incorporated herein by reference). | |
| 10.14(B) | Search and Advertising Services and Sales Agreement, dated December 4, 2009, between the Registrant and Microsoft Corporation (previously filed as Exhibit 10.18(B) to the Registrants Annual Report on Form 10-K filed February 26, 2010 and incorporated herein by reference). | |
| 10.14(C) | License Agreement, dated December 4, 2009, between the Registrant and Microsoft Corporation (previously filed as Exhibit 10.18(C) to the Registrants Annual Report on Form 10-K filed February 26, 2010 and incorporated herein by reference). | |
| 10.14(D) | First Amendment to Search and Advertising Services and Sales Agreement, dated as of July 14, 2010, by and between the Registrant and Microsoft Corporation (previously filed as Exhibit 10.18(D) to the Registrants Quarterly Report on Form 10-Q filed May 10, 2011 and incorporated herein by reference). | |
| 10.14(E) | Second Amendment to Search and Advertising Services and Sales Agreement, dated as of October 10, 2010, by and between the Registrant and Microsoft Corporation (previously filed as Exhibit 10.18(E) to the Registrants Quarterly Report on Form 10-Q filed May 10, 2011 and incorporated herein by reference). | |
| 10.14(F) | Third Amendment to Search and Advertising Services and Sales Agreement, dated as of March 31, 2011, by and between the Registrant and Microsoft Corporation (previously filed as Exhibit 10.18(F) to the Registrants Quarterly Report on Form 10-Q filed May 10, 2011 and incorporated herein by reference). | |
| 10.14(G) | Amendment No. 1 to License Agreement, dated as of October 10, 2010, by and between the Registrant and Microsoft Corporation (previously filed as Exhibit 10.18(G) to the Registrants Quarterly Report on Form 10-Q filed May 10, 2011 and incorporated herein by reference). | |
| 10.14(H) | Fourth Amendment to Search and Advertising Services and Sales Agreement, dated as of December 13, 2010, by and between the Registrant and Microsoft Corporation (previously filed as Exhibit 10.18(H) to Amendment No. 1 to the Registrants Quarterly Report on Form 10-Q filed December 2, 2011 and incorporated herein by reference). | |
| 10.14(I) | Fifth Amendment to Search and Advertising Services and Sales Agreement, dated as of July 2, 2011, by and between the Registrant and Microsoft Corporation (previously filed as Exhibit 10.18(I) to Amendment No. 1 to the Registrants Quarterly Report on Form 10-Q filed December 2, 2011 and incorporated herein by reference). | |
| 10.14(J) | Sixth Amendment to Search and Advertising Services and Sales Agreement, dated as of October 14, 2011, by and between the Registrant and Microsoft Corporation (previously filed as Exhibit 10.18(J) to the Registrants Quarterly Report on Form 10-Q filed November 7, 2011 and incorporated herein by reference). | |
| 10.14(K) | Seventh Amendment to Search and Advertising Services and Sales Agreement, dated as of January 1, 2012, by and between the Registrant and Microsoft Corporation (previously filed as Exhibit 10.16(K) to the Registrants Quarterly Report on Form 10-Q filed August 9, 2012 and incorporated herein by reference). | |
140
| Exhibit |
Description |
|
| 10.14(L) | Eighth Amendment to Search and Advertising Services and Sales Agreement, dated as of June 6, 2012, by and between the Registrant and Microsoft Corporation (previously filed as Exhibit 10.16(L) to the Registrants Quarterly Report on Form 10-Q filed August 9, 2012 and incorporated herein by reference). | |
| 10.14(M) | Ninth Amendment to Search and Advertising Services and Sales Agreement, dated as of June 27, 2013, by and between the Registrant and Microsoft Corporation (previously filed as Exhibit 10.15(M) to the Registrants Quarterly Report on Form 10-Q filed August 8, 2013 and incorporated herein by reference). | |
| 10.15(A) | Framework Agreement, dated as of July 29, 2011, by and among the Registrant, Alibaba Group Holding Limited, Softbank Corp., Alipay.com Co., Ltd., APN Ltd., Zhejiang Alibaba E-Commerce Co., Ltd., Jack Ma Yun, Joseph C. Tsai and certain joinder parties (previously filed as Exhibit 10.1 to Amendment No. 1 to the Registrants Current Report on Form 8-K filed August 12, 2011 and incorporated herein by reference). | |
| 10.15(B) | Amendment to Framework Agreement, dated as of November 15, 2012, by and among the Registrant, Alibaba Group Holding Limited, Softbank Corp., Alipay.com Co., Ltd., APN Ltd., Zhejiang Alibaba E-Commerce Co., Ltd., Jack Ma Yun, Joseph C. Tsai and certain joinder parties (previously filed as Exhibit 10.18 (B) to the Registrants Annual Report on Form 10-K filed March 1, 2013 and incorporated herein by reference). | |
| 10.16 | Settlement Agreement, dated May 13, 2012, among the Registrant, Third Point LLC and each of the other persons set forth on the signature pages thereto (previously filed as Exhibit 99.01 to the Registrants Current Report on Form 8-K filed May 14, 2012 and incorporated herein by reference). | |
| 10.17(A)+ | Employment Offer Letter, dated July 16, 2012, between the Registrant and Marissa A. Mayer (previously filed as Exhibit 10.1 to the Registrants Current Report on Form 8-K filed July 19, 2012 and incorporated herein by reference). | |
| 10.17(B)+ | Restricted Stock Unit Award Agreement (CEO Make-Whole Grant), dated July 26, 2012, between the Registrant and Marissa A. Mayer (previously filed as Exhibit 10.22(B) to the Registrants Quarterly Report on Form 10-Q filed August 9, 2012 and incorporated herein by reference). | |
| 10.17(C)+ | Form of Restricted Stock Unit Award Agreement (CEO Retention and Annual Grants), between the Registrant and Marissa A. Mayer (previously filed as Exhibit 10.22(C) to the Registrants Quarterly Report on Form 10-Q filed August 9, 2012 and incorporated herein by reference). | |
| 10.17(D)+ | Performance Stock Option Agreement (Retention Grant), including Notice of Performance Stock Option Grant, dated November 29, 2012, between the Registrant and Marissa A. Mayer (previously filed as Exhibit 10.21(D) to the Registrants Annual Report on Form 10-K filed March 1, 2013 and incorporated herein by reference). | |
| 10.17(E)+ | Performance Stock Option Agreement (Annual Grant), including Notice of Performance Stock Option Grant, dated November 29, 2012, between the Registrant and Marissa A. Mayer (previously filed as Exhibit 10.21(E) to the Registrants Annual Report on Form 10-K filed March 1, 2013 and incorporated herein by reference). | |
| 10.17(F)+ | Form of Performance Restricted Stock Unit Award Agreement between the Registrant and Marissa A. Mayer, including Notice of Grant, under the Yahoo! Inc. 1995 Stock Plan (previously filed as Exhibit 10.3 to the Registrants Current Report on Form 8-K filed March 6, 2013 and incorporated herein by reference). | |
141
| Exhibit |
Description |
|
| 10.17(G)+ | Form of Restricted Stock Unit Award Agreement between the Registrant and Marissa A. Mayer, including Notice of Grant Plan, under the Yahoo! Inc. 1995 Stock Plan (previously filed as Exhibit 10.5 to the Registrants Current Report on Form 8-K filed March 6, 2013 and incorporated herein by reference). | |
| 10.17(H)+ | Form of Severance Agreement between the Registrant and Marissa A. Mayer (previously filed as Exhibit 10.7 to the Registrants Current Report on Form 8-K filed March 6, 2013 and incorporated herein by reference). | |
| 10.18(A)+ | Employment Offer Letter, dated September 23, 2012, between the Registrant and Ken Goldman (previously filed as Exhibit 10.1 to the Registrants Current Report on Form 8-K filed September 26, 2012 and incorporated herein by reference). | |
| 10.18(B)+ | Performance Stock Option Agreement, including Notice of Performance Stock Option Grant, dated November 29, 2012, between the Registrant and Ken Goldman (previously filed as Exhibit 10.22(B) to the Registrants Annual Report on Form 10-K filed March 1, 2013 and incorporated herein by reference). | |
| 10.19(A)+ | Employment Offer Letter, dated October 15, 2012, between the Registrant and Henrique de Castro (previously filed as Exhibit 10.1 to the Registrants Current Report on Form 8-K filed October 15, 2012 and incorporated herein by reference). | |
| 10.19(B)+ | Restricted Stock Unit Award Agreement (Make-Whole Grant), dated November 29, 2012, between the Registrant and Henrique de Castro (previously filed as Exhibit 10.23(B) to the Registrants Annual Report on Form 10-K filed March 1, 2013 and incorporated herein by reference). | |
| 10.19(C)+ | Restricted Stock Unit Award Agreement (Initial Grant), dated November 29, 2012, between the Registrant and Henrique de Castro (previously filed as Exhibit 10.23(C) to the Registrants Annual Report on Form 10-K filed March 1, 2013 and incorporated herein by reference). | |
| 10.19(D)+ | Performance Stock Option Agreement, including Notice of Performance Stock Option Grant, dated November 29, 2012, between the Registrant and Henrique de Castro (previously filed as Exhibit 10.23(D) to the Registrants Annual Report on Form 10-K filed March 1, 2013 and incorporated herein by reference). | |
| 10.19(E)+ | Form of Severance Agreement between the Registrant and Henrique de Castro (previously filed as Exhibit 10.23(E) to the Registrants Quarterly Report on Form 10-Q filed May 7, 2013 and incorporated herein by reference). | |
| 10.20(A) | Credit Agreement, dated as of October 19, 2012, by and among the Registrant, the initial lenders named therein, Citibank, N.A., as Administrative Agent, HSBC Bank USA, National Association as Syndication Agent and Citigroup Global Markets Inc. and HSBC Securities (USA) Inc., as Joint Lead Arrangers and Joint Bookrunners (previously filed as Exhibit 10.1 to the Registrants Current Report on Form 8-K filed October 22, 2012 and incorporated herein by reference). | |
| 10.20(B) | Amendment No. 1 to Credit Agreement, dated as of October 10, 2013, by and among the Registrant, the lenders named therein, and Citibank, N.A. as Administrative Agent (previously filed as Exhibit 10.1 to the Registrants Current Report on Form 8-K filed October 15, 2013 and incorporated herein by reference). | |
| 10.21(A) | Purchase Agreement, dated July 22, 2013, among the Registrant, Third Point, LLC, Daniel S. Loeb, Third Point Partners L.P., Third Point Partners Qualified L.P., Third Point Offshore Master Fund L.P., Third Point Ultra Master Fund L.P. and Third Point Reinsurance Company, Ltd. (previously filed as Exhibit 99.1 to the Registrants Current Report on Form 8-K filed on July 25, 2013 and incorporated herein by reference). | |
142
| Exhibit |
Description |
|
| 10.21(B) | Amendment to Agreement, dated July 22, 2013, between the Registrant, Third Point, LLC and each of the other persons set forth on the signature pages thereto (previously filed as Exhibit 99.2 to the Registrants Current Report on Form 8-K filed on July 25, 2013 and incorporated herein by reference). | |
| 10.22 | Form of Call Option Confirmation between Yahoo and each Option Counterparty (previously filed as Exhibit 10.1 to the Registrants Current Report on Form 8-K filed November 26, 2013 and incorporated herein by reference). | |
| 10.23 | Form of Warrant Confirmation between Yahoo and each Option Counterparty (previously filed as Exhibit 10.2 to the Registrants Current Report on Form 8-K filed November 26, 2013 and incorporated herein by reference). | |
| 21.1* | List of Subsidiaries. | |
| 23.1* | Consent of Independent Registered Public Accounting Firm. | |
| 24.1 | Power of Attorney (see the signature page of this Annual Report on Form 10-K.) | |
| 31.1* | Certificate of Chief Executive Officer Pursuant to Securities Exchange Act Rules 13a-14(a) and 15d-14(a) as Adopted Pursuant to Section 302 of the Sarbanes-Oxley Act of 2002, dated February 28, 2014. | |
| 31.2* | Certificate of Chief Financial Officer Pursuant to Securities Exchange Act Rules 13a-14(a) and 15d-14(a) as Adopted Pursuant to Section 302 of the Sarbanes-Oxley Act of 2002, dated February 28, 2014. | |
| 32** | Certificate of Chief Executive Officer and Chief Financial Officer Pursuant to Securities Exchange Act Rules 13a-14(b) and 15d-14(b) and 18 U.S.C. Section 1350, as Adopted Pursuant to Section 906 of the Sarbanes-Oxley Act of 2002, dated February 28, 2014. | |
| 101.INS* | XBRL Instance | |
| 101.SCH* | XBRL Taxonomy Extension Schema | |
| 101.CAL* | XBRL Taxonomy Extension Calculation | |
| 101.DEF* | XBRL Taxonomy Extension Definition | |
| 101.LAB* | XBRL Taxonomy Extension Labels | |
| 101.PRE* | XBRL Taxonomy Extension Presentation | |
| * | Filed herewith. |
| ** | Furnished herewith. |
| + | Indicates a management contract or compensatory plan or arrangement. |
| | Portions of this exhibit have been omitted and filed separately with the U.S. Securities and Exchange Commission pursuant to a request for confidential treatment. |
143
