Yahoo! Inc 10-K 2011-12-31
Sign in or join
Add a note by highlighting text or Replying to an existing note.
Add a note by highlighting text or Replying to an existing note.
UNITED STATES
SECURITIES AND EXCHANGE COMMISSION
Washington, D.C. 20549
Form 10-K
| þ | ANNUAL REPORT PURSUANT TO SECTION 13 OR 15(d) OF THE SECURITIES EXCHANGE ACT OF 1934 |
For the fiscal year ended December 31, 2011
OR
| ¨ | TRANSITION REPORT PURSUANT TO SECTION 13 OR 15(d) OF THE SECURITIES EXCHANGE ACT OF 1934 |
For the transition period from to
Commission File Number 000-28018
Yahoo! Inc.
(Exact name of Registrant as specified in its charter)
| Delaware | 77-0398689 | |
| (State or other jurisdiction of incorporation or organization) | (I.R.S. Employer Identification No.) |
701 First Avenue
Sunnyvale, California 94089
(Address of principal executive offices, including zip code)
Registrants telephone number, including area code: (408) 349-3300
Securities registered pursuant to Section 12(b) of the Act:
| Title of Each Class |
Name of Each Exchange on Which Registered |
|
| Common stock, $.001 par value | The NASDAQ Stock Market LLC (NASDAQ Global Select Market) |
Securities registered pursuant to Section 12(g) of the Act: None
(Title of Class)
Indicate by check mark if the Registrant is a well-known seasoned issuer, as defined in Rule 405 of the Securities Act. Yes þ No ¨
Indicate by check mark if the Registrant is not required to file reports pursuant to Section 13 or Section 15(d) of the Act. Yes ¨ No þ
Indicate by check mark whether the Registrant (1) has filed all reports required to be filed by Section 13 or 15(d) of the Securities Exchange Act of 1934 during the preceding 12 months (or for such shorter period that the Registrant was required to file such reports), and (2) has been subject to such filing requirements for the past 90 days. Yes þ No ¨
Indicate by check mark whether the Registrant has submitted electronically and posted on its corporate Web site, if any, every Interactive Data File required to be submitted and posted pursuant to Rule 405 of Regulation S-T (§232.405 of this chapter) during the preceding 12 months (or for such shorter period that the registrant was required to submit and post such files). Yes þ No ¨
Indicate by check mark if disclosure of delinquent filers pursuant to Item 405 of Regulation S-K (§229.405 of this chapter) is not contained herein, and will not be contained, to the best of Registrants knowledge, in definitive proxy or information statements incorporated by reference in Part III of this Form 10-K or any amendment to this Form 10-K. þ
Indicate by check mark whether the Registrant is a large accelerated filer, an accelerated filer, a non-accelerated filer, or a smaller reporting company. See definitions of large accelerated filer, accelerated filer, and smaller reporting company in Rule 12b-2 of the Exchange Act.
| Large accelerated filer þ |
Accelerated filer ¨ | |
|
Non-accelerated filer ¨ (Do not check if a smaller reporting company) |
Smaller reporting company ¨ |
Indicate by check mark whether the Registrant is a shell company (as defined by Rule 12b-2 of the Exchange Act). Yes ¨ No þ
As of June 30, 2011, the aggregate market value of voting stock held by non-affiliates of the Registrant, based upon the closing sales price for the Registrants common stock, as reported on the NASDAQ Global Select Market, was $14,443,263,515. Shares of common stock held by each officer and director and by each person who owns 10 percent or more of the outstanding common stock have been excluded in that such persons may be deemed to be affiliates. This determination of affiliate status is not necessarily a conclusive determination for any other purpose.
The number of shares of the Registrants common stock outstanding as of February 17, 2012 was 1,213,749,472.
DOCUMENTS INCORPORATED BY REFERENCE
The following documents (or parts thereof) are incorporated by reference into the following parts of this Form 10-K:
Proxy Statement for the 2012 Annual Meeting of ShareholdersPart III Items 10, 11, 12, 13, and 14.
YAHOO! INC.
Form 10-K
Fiscal Year Ended December 31, 2011
The trademarks and/or registered trademarks of Yahoo! Inc. and its subsidiaries referred to herein include, but are not limited to, Yahoo!, Y!, IntoNow, interclick, Livestand, Flickr, Right Media, omg!, Shine, Sportacular, Prime Time in No Time, Behind Enemy Lines, Ready Set Dance, Yahoo! Search BOSS, Wretch, Meme from Yahoo!, Citizen Sports, Associated Content and their respective logos. Other names are trademarks and/or registered trademarks of their respective owners.
2
| Item 1. | Business |
OVERVIEW
Yahoo! Inc., together with its consolidated subsidiaries (Yahoo!, the Company, we, or us), is a premier digital media company. Through our proprietary technology and insights, Yahoo! delivers personalized digital content and experiences, across devices and around the globe, to vast audiences. We provide engaging and innovative canvases for advertisers to connect with their target audiences using our unique blend of Science + Art + Scale. We provide online properties and services (Yahoo! Properties) to users as well as a range of marketing services designed to reach and connect with those users on Yahoo! and through a distribution network of third-party entities (Affiliates). These Affiliates integrate our advertising offerings into their Websites or other offerings (those Websites and other offerings, Affiliate sites).
We generate revenue from the display of graphical advertisements (display advertising), the display of text-based links to advertisers Websites (search advertising), and other sources.
Our offerings to users on Yahoo! Properties currently fall into three categories: Communications and Communities; Search and Marketplaces; and Media. The majority of our offerings are available in more than 45 languages and in 60 countries, regions, and territories. We have properties tailored to users in specific international markets including the Yahoo! Homepage and social networking Websites including Meme and Wretch.
Yahoo! was developed and first made available in 1994 by our founders, David Filo and Jerry Yang, while they were graduate students at Stanford University. We were incorporated in 1995 and are a Delaware corporation. We are headquartered in Sunnyvale, California, and have offices in more than 30 countries, regions, and territories.
Changes in Our Board of Directors and Executive Leadership
During 2011, there were a number of changes to the composition of our Board of Directors (the Board) and our executive leadership team. Effective April 1, 2011, Eric Hippeau resigned from our Board and David Kenny was appointed to our Board. On September 6, 2011, Carol Bartz was removed from her role as our Chief Executive Officer and President, and our Board appointed Tim Morse, our Executive Vice President and Chief Financial Officer, as our Interim Chief Executive Officer and President. Ms. Bartz resigned from our Board on September 9, 2011.
On January 4, 2012, we announced the appointment of Scott Thompson as our Chief Executive Officer, President, and member of our Board, effective January 9, 2012. At that time Tim Morse resumed his primary role as Executive Vice President and Chief Financial Officer. On January 17, 2012, Jerry Yang resigned from our Board and all other positions at Yahoo!. On February 7, 2012, Alfred J. Amoroso and Maynard G. Webb, Jr. were appointed to our Board. We also announced on February 7, 2012 that Chairman of the Board Roy J. Bostock and directors Vyomesh Joshi, Arthur H. Kern and Gary L. Wilson have each volunteered not to stand for re-election to the Board at the Companys 2012 Annual Meeting of Shareholders.
Strategic Review
During 2011, our Board of Directors initiated a comprehensive strategic review to assess alternatives to return the Company to increased growth and innovation. As part of this review, we have pursued a wide range of discussions with potential partners. We are in discussions regarding the possibility of restructuring our holdings in Alibaba Group and Yahoo Japan. While we continue to pursue these discussions, there is no assurance that any transaction will be achieved.
3
2011 HIGHLIGHTS
Transactions and Alliances
| | Acquired interclick, inc., a company with innovative data targeting capabilities, optimization technologies and new premium supply as well as a team experienced in selling audiences across disparate sources of pooled advertising supply. |
| | Acquired IntoNow, enabling Yahoo! to provide enhanced media experiences and video programming, bolstering social engagement across the Yahoo! network. IntoNow is available on iPhone, Android and iPad devices. |
| | Announced with Benchmark Capital the formation of Hortonworks, an independent company consisting of key architects and core contributors to the open source Apache Hadoop technology pioneered by Yahoo!. |
| | Announced agreements with Microsoft and AOL intended to improve the process of buying and selling premium online display inventory. The agreements will allow ad networks operated by Yahoo!, Microsoft and AOL to offer each others premium non-guaranteed online display inventory to their respective advertising customers. |
| | Announced a strategic alliance with ABC News that combines Yahoo! News vast audience and depth and breadth of content, with ABC News global news-gathering operation and anchors and reporters. The alliance kicked off with the launch of GoodMorningAmerica.com on Yahoo! and a live stream of anchor George Stephanopoulos interviewing President Barack Obama at the White House. |
Communications and Communities
| | Launched globally our latest version of Yahoo! Mail, which is the #1 Mail offering in the U.S. Yahoo! Mail is significantly faster than previous versions; offers a safer experience with new anti-phishing defenses and enhanced spam protection; and a sleek, new personalized design that brings together social experiences and conversations from across the Web and provides users with one place to quickly access photo and video information from their connections. In addition, the latest version of Yahoo! Mail offers a consistent experience across devices, whether on desktop, mobile devices such as the iPhone or Android smart phones, or tablets. |
| | Launched Yahoo! Messenger 11, which offers users more ways to connect with friends and family. The latest version lets users instant message (IM), text, make voice and video calls, and play some of the most popular social games with friends. In addition, users can view, comment on and like real-time updates from Flickr and Facebook, and can also start IM conversations on a PC and continue them on iPhones, Android smart phones or any Internet-enabled devices. |
| | Launched Social Bar (previously known as Yahoo! news activity), a new way to discover and connect with content on both Yahoo! and Facebook. Currently available on more than 26 Yahoo! sites around the world, users can discover and share the news and information that they are enjoying on Yahoo! seamlessly through updates on Facebook. |
| | Introduced the Flickr App for Android and Photo Session from Flickr. The Flickr Android application lets Android users capture, customize, edit and share high-quality photos on the go. Photo Session is an interactive live-sharing tool that allows users to share Flickr photostreams and sets with other users in real-time. Photo Session is available on the PC, iPhone and iPad. |
Search and Marketplaces
| | Completed the complex transition of algorithmic search to Microsofts search platform in all 35 global markets, across desktop and mobile, for all Yahoo! and Affiliate traffic. |
| | Launched Search Direct, which delivers instant answers and direct access to relevant Websites before a user completes a query, hits the search button, or navigates to a search results page. This search innovation supports Yahoo!s strategy of fundamentally shifting the way users experience the Web by providing rich, integrated content faster and more efficiently. |
4
| | Introduced Yahoo! App Search, for desktops and PCs, to help users discover new and relevant mobile applications. Using Yahoo!s powerful search technology, Yahoo! App Search allows users to zero-in on any application by displaying in one location matching application titles along with a full comprehensive description, price data, overall star rating from users, and screenshots. |
| | Launched a new version of BOSS, which offers search and contextual products that enable publishers, portals, internet service providers, developers, and start-ups to build Web-scale search products and offers opportunities to monetize through search revenue sharing; a new version of Clues, an online tool for analyzing search trends; and a variety of other search product updates. |
Media
| | Launched Livestand from Yahoo!, a personalized living magazine designed first for iPad. Livestand combines content from leading third-party publishers and Yahoo!s global media network to create a personalized digital experience tailored to users interests. |
| | Continued to grow the number of Yahoo! Properties on the Yahoo! Publishing Platform (YPP), reaching 126 sites globally. The YPP enables publishers to easily create and manage their online media experiences. YPP provides the tools and technology to allow premium and personalized content to be created, distributed, and consumed on a global scale, on a single platform. |
| | Debuted MLB.com® Full Count, a new online video offering produced and powered by MLB.com in partnership with Yahoo! Sports that allows fans to follow live Major League Baseball action throughout the regular season. |
| | Introduced a full slate of original, premium, TV-quality Web shows in tandem with the beta launch of our re-vamped video destination, Yahoo! Screen. The eight new shows add to Yahoo!s existing industry-leading video programming, and include top Hollywood talent such as Judy Greer (The Descendants, Arrested Development), Cameron Mathison (All My Children, Dancing with the Stars), and Morgan Spurlock (Super-Size Me, 30 Days), among others. |
| | Continued to drive large amounts of traffic on Yahoo! sites with news events such as the Royal Wedding in April, which included coverage on Yahoo! News, Shine from Yahoo!, omg! from Yahoo!, and our own Royal Wedding site. |
USER OFFERINGS
Our offerings to users on Yahoo! Properties currently fall into three categories: Communications and Communities; Search and Marketplaces; and Media. We have distribution partnerships with close to 100 carriers, original equipment manufacturers (OEMs), and publishers around the world. Our offerings are available on desktop and other devices such as PCs, mobile phones, tablets and TVs.
Communications and Communities
Our Communications and Communities offerings, including Yahoo! Mail, Yahoo! Messenger, Yahoo! Groups, Yahoo! Answers, Flickr, and Connected TV, provide a wide range of communication and social services to users across a variety of devices and through our broadband Internet access partners, OEM partners and strategic partners. These offerings enable users to organize into groups and share knowledge, common interests, and photos. We offer some services free of charge to our users and also provide some services on a fee or subscription basis. We generate display and search revenue and fees revenue from these offerings.
Yahoo! Mail provides users with full-featured online communications functionality, including email, instant messaging and SMS as well as integrated contacts, calendar and third-party applications written for the mail platform through the Yahoo! Mail Developer Program. In addition to our free e-mail service, for a subscription fee, we offer Yahoo! Mail Plus, a premium e-mail service that provides features such as an interface free of display advertising. Yahoo! Mail is also available on PCs, mobile phones, and tablets.
5
Yahoo! Messenger instant messaging service provides an interactive and personalized way for users to connect, communicate and share experiences on a real-time basis. Yahoo! also offers mobile applications for Yahoo! Messenger, including real-time video chat on mobile devices. Recently, a new feature was added on iPhone, Android, Blackberry, and feature phones that enables Yahoo! Messenger users to chat directly with their Facebook friends without leaving Yahoo! Messenger.
Yahoo! Groups provides members with shared access to information such as message archives, photo albums, event calendars, and polls.
Yahoo! Answers is a service that allows users to ask and answer questions on a variety of topics on both PCs and mobile devices.
Flickr is an online photo management and sharing service that makes it easy for users to upload, store, organize, and share their photos. In addition to the basic service, Flickr offers a fee-based service with unlimited storage, uploads, and an advertising-free browsing and sharing interface. Yahoo! offers mobile applications for Flickr, on both iPhone and Android devices.
Connected TV enhances the TV viewing experience through an open, interactive platform. Yahoo! Connected TV is available on top TV brands, including LG, Samsung, Sony, Toshiba and VIZIO.
We also have social properties tailored to users in specific international markets, which include blogging and social networking Websites such as Wretch in Taiwan and Meme in Argentina, Brazil, Mexico, Taiwan, Indonesia, India and the Philippines.
Search and Marketplaces
Our Search and Marketplaces offerings are designed to quickly answer users information needs by delivering innovative and meaningful search, local, and listings experiences on the search results pages and across Yahoo!.
Search
Our Search offerings, including Yahoo! Search and Yahoo! Local, are available free to users and often serve as the starting points from which our users navigate the Internet and discover content that matters to them.
Yahoo! Search provides users with a free search capability offering rich search results ranked and organized based on relevance to each users search query. Sponsored search results are a subset of the overall search results and provide links to paying advertisers Web pages.
On December 4, 2009, Yahoo! entered into a Search and Advertising Services and Sales Agreement (the Search Agreement) and a License Agreement with Microsoft which provides for Microsoft to be the exclusive algorithmic and paid search services provider on Yahoo! Properties and non-exclusive provider of such services on Affiliate sites. Under the Search Agreement, Yahoo! will be the exclusive worldwide relationship sales force for both companies premium search advertisers, which include advertisers meeting certain spending or other criteria, advertising agencies that specialize in or offer search engine marketing services and their clients, and resellers and their clients seeking assistance with their paid search accounts. Algorithmic and paid search transitioned to the Microsoft platform in the U.S. and Canada in the fourth quarter of 2010. In 2011, we completed the transition of algorithmic search in all remaining markets. The market-by-market transition of our paid search platform to Microsofts platform and the migration of paid search advertisers and publishers to Microsofts platform are expected to continue through the first half of 2013. See Managements Discussion and Analysis of Financial Condition and Results of OperationsSearch Agreement with Microsoft Corporation.
6
While Microsoft provides the algorithmic search results under the Search Agreement, Yahoo! continues to develop and launch features around the results to enhance the users Yahoo! search experience and to deliver more answers to the millions of users who come to Yahoo! to be entertained and to stay informed and productive. These features include Search Direct, rich results, Contextual Search results, site filters, related topic suggestions and more.
Yahoo! Search is evolving to allow users to find the right information at the right time, whether by entering keywords in a search box or by discovering search-powered experiences wherever they are online. Yahoo! currently offers Yahoo! Search experiences and applications across connected devices, including PCs, tablets and mobile phones.
Yahoo! Local offers users local and hyperlocal news, business listings, events and deals and is tightly integrated with Yahoo! Maps. In addition, users can access related content such as recommendations, user reviews and photos about a business listing. We generate revenue from listing fees and premium location targeted display advertising.
Marketplaces
Our Marketplaces offerings and services include Yahoo! Shopping, Yahoo! Travel, Yahoo! Real Estate, Yahoo! Autos, and Yahoo! Small Business. On these properties, users can research specific topics, products, services or areas of interest by reviewing and exchanging information, obtaining contact details or considering offers from providers of goods, providers of services, or parties with similar interests. We generate revenue from listing fees, transaction fees, and display and search advertising on many of these properties, as well as from the subscription fees that we charge for hosting Websites for our customers, fees that we charge for registering domains, and fees that we charge for services we provide to small businesses seeking to maintain a Website. We also have properties tailored to users in specific international markets, primarily our Asian markets, which allow prospective buyers and sellers to enter into an online auction for goods for which we earn a posting and transaction fee. Monday in Taiwan is one such property.
Media
Our Media offerings are designed to engage users with some of the most relevant and compelling online content and services on the Web. We offer a majority of these services free of charge to our users. On our Media properties, we generate revenue from display and search advertising and from fee-based services. Many of our media properties are also available in mobile-optimized versions for display on mobile phones and tablet devices. Our Media properties and services include the following:
Yahoo! Homepage is a navigation hub and starting point for entering into Yahoo! Properties and the Internet, via a PC or mobile device. Yahoo! Homepage brings together the most useful information and functionality from across the Web, giving users one place to search, preview and access everything that matters to them most.
Yahoo! News provides stories from the major news agencies that are aggregated by our editorial team and augmented by in-house generated content focused on up-to-the-minute news coverage with video, text, photos, and audio.
Yahoo! Sports offers free fantasy games, original editorial content, real-time statistics, scores and game updates, broadcast programming, integrated shopping, and online sports communities. Yahoo! Sports offers mobile applications for specific areas of interest to our users, such as Yahoo! Fantasy Football, which was available on TVs, PCs, mobile devices, and tablets for the 2011 season, along with sports content via our Yahoo! Mobile application, Yahoo! Sportacular and Yahoo! Fantasy Sports.
Yahoo! Finance provides a comprehensive set of financial data, information, and tools that helps users make informed financial decisions. The content is primarily provided through our relationships with several third-party
7
providers. Some of these providers pay a fee when a user is referred from Yahoo! Finance to their Websites. Some financial content, such as analyst research reports, is also available to users for a fee. MarketDash, a mobile application from Yahoo! Finance is available on iPhone, Android and iPad devices.
My Yahoo! is a personalized start page that gives registered users the ability to customize their pages with information that interests them most from around the Web.
Yahoo! Toolbar is a Web browser add-on that conveniently enables users to access and preview Yahoo! Properties and third-party content via applications from anywhere on the Web.
Yahoo! Entertainment & Lifestyles represents a collection of properties that provides users with information, and other engaging content centered on popular culture-related themes and activities with sites such as Yahoo! Movies, Yahoo! Music, Yahoo! Games, and Yahoo! TV. For example, Prime Time in No Time provides quick recaps of the previous evenings prime time television shows. In addition, our Media properties also include Websites devoted to specialty topics such as Yahoo! Health, Yahoo! Education, Yahoo! Weather, omg! (celebrity news) and Shine (womens lifestyles).
Livestand from Yahoo! is a personalized living magazine application for the iPad that Yahoo! launched in November 2011. Livestand combines content from more than 100 third-party publishers and Yahoo!s own media network to create a visually rich and personalized experience tailored to the interests of our users. Many Yahoo! original content sites have specialized publications available only on Livestand, including Yahoo! Scene (Entertainment), In the Money (Finance), Yahoo! Today (homepage), Shine from Yahoo! (womens lifestyles) and The Thread (Fashion).
IntoNow from Yahoo! is available on iPhone, Android and iPad devices, and makes watching TV more engaging, social, and fun with the touch of a button. IntoNow identifies what users are watching, whether live or recorded; shows related content and personalized recommendations; and enables discussions with friends.
Yahoo! Contributor Network is a platform allowing users to publish their creative content on Yahoo!. The Yahoo! Contributor Network is an evolution of the Associated Content platform that we expect will bring contributions from writers, photographers, and videographers to the Internets largest media destinations, including Yahoo! News, Yahoo! Finance, Yahoo! Sports and even the Yahoo! Homepage.
ADVERTISER AND PUBLISHER OFFERINGS AND SERVICES
Yahoo! recognizes that brand advertisers are looking for immersive digital experiences that allow them to make emotional connections with users, and we have aligned resources to best serve our advertising partners. Rather than taking a product-centric approach, we are focused on providing advertisers with complete marketing solutions that drive results. We believe Yahoo! offers the best combination of elements needed for successful digital marketing campaigns across multiple devices today: the science to understand and target an audience; the art to create lasting engagement with consumers through context; and the scale to reach the right person in the right setting in meaningful numbers (Science + Art + Scale).
We offer advertisers targeted solutions (such as interest-based and search retargeting), valuable insights about their customer base, and tools that leverage those insights for optimized program performance. We help advertisers develop lasting engagement with consumers through interactivity. We pioneered digital ad formats such as the Yahoo! Mail Login Page, and have introduced new innovations this year with the launch of Smart Ads for Video and Living Ads in Livestand, both of which showcase their message in a quality context that delivers results. We also provide advertisers access to one of the largest concentrations of target audiences and premium content on the Web. We do this by bringing quality publishers together through Yahoo! Network Plus (including AT&T, Verizon, Rogers, Monster, and Comcast) and the Right Media Exchange. The Right Media Exchange is Yahoo!s ad platform for digital advertising companies, including differentiated ad networks, direct
8
advertisers in our non-guaranteed marketplace, data providers, technology innovators, and global agencies. In November 2011, we announced agreements with Microsoft and AOL that will allow ad networks operated by Yahoo!, Microsoft and AOL to offer each others premium non-guaranteed online display inventory to their respective advertising customers.
We work with high-quality publishers to attract audiences, create engaging experiences, learn insightful information about the publishers audiences and monetize the experiences rendered with a set of application programming interfaces (APIs) and tools for ease of doing business. With this offering, publishers are able to participate in the Yahoo! Search and Bing Unified Search Marketplaces as well as the Right Media Exchange for display advertising.
We generate revenue by providing marketing services to advertisers across a majority of Yahoo! Properties and Affiliate sites. Our marketing services include display advertising, search advertising, listing-based services, and commerce-based transactions.
DEVELOPERS AND PLATFORM OFFERINGS
We provide several software and platform offerings for third-party developers, advertisers, agencies, publishers and designers. We believe that our open platforms enable developers and partners to build and incorporate new products and innovations that users want into our product experiences. We are committed to providing the developer community with products that solve their problems and enhance the development experience, positioning Yahoo! as a technical leader.
We host events worldwide to further support our developer community, such as Open Hackdays and Hack Us (for universities). Over 4,000 people from 35 countries have attended more than 15 such events, submitting more than 800 product applications.
Our offerings include:
Yahoo! Developer Networks (YDN) goal is to be the hub for the digital media developer community. The large and active ecosystem is primarily composed of thousands of independent software vendors, publishers, advertisers, agencies, and designers. The YDN site allows the community to socialize, build and learn, leveraging Yahoo!s platforms, APIs, tools, documentation, support and resources.
Cocktails is Yahoo!s development platform (made up of Yahoo!s Mojito and Yahoo!s Manhattan) for connected devices, which is built on open industry standards (HTML5, CSS3, Node.JS, JavaScript). Its cross platform programming environment allows a new class of multi-screen applications with native-like performance, built with minimal resource usage and maximum speed. Cocktails powers Livestand by making it simple for publishers to connect audiences with premium content, for advertisers to engage audiences with rich personalized ads and for developers to quickly build, personalize and modify content.
Yahoo! Query Language (YQL) is a simple but powerful language that enables developers to query, filter, and join data across different Web services. Traditionally, developers must locate the correct URLs and documentation for every Web service needed by an application, which is time consuming and complex. With YQL, developers can access and shape data across the Internet with one simple syntax, eliminating the need to learn how to call different APIs and making it possible for applications to run faster with fewer lines of code and a smaller network footprint.
Yahoo! User Interface (YUI) is a free, open source JavaScript and cascading style sheets (CSS) framework for building richly interactive Web applications. YUI is provided under a free license and is available on GitHub, which allows developers to maintain their own versions of the software as well as contribute to its further development.
9
Yahoo! Search BOSS is an open search Web services platform that enables developers, start-ups, and large Internet companies to build Web-scale search products.
Yahoo!s Social API suite offers advertisers and users the power of the Yahoo! network and all its inherent social connections. The social suite is comprised of the social directory, contacts, user status and updates APIs.
Yahoo! Application Platform (YAP) is an application platform that third-party developers can use to create innovative experiences that will function across the Yahoo! network and beyond. For example, YAP powers our partnership with Zynga to bring social gaming experiences into core Yahoo! experiences.
Yahoo! Mail Developer Program (YMDP) provides Yahoo! and third parties with the ability to create applications that enhance the mail experience through a well-documented set of APIs. Currently, there are more than 20 applications available to Yahoo! Mail users.
Yahoo! Updates allows developers and publishers to syndicate user-generated actions from Yahoo! on their Websites and vice versa, integrating social data and actions into new applications and services. Yahoo! Updates is available for commercial and non-commercial use by developers.
Yahoo! PlaceFinder is a geocoding Web service that helps developers make their applications location-aware by converting street addresses or place names into geographic coordinates (and vice versa).
GLOBAL BUSINESS
We manage our business geographically. The primary areas of measurement and decision-making are Americas, EMEA (Europe, Middle East, and Africa), and Asia Pacific. Additional information required by this item is incorporated herein by reference to Note 13Segments of the Notes to the consolidated financial statements, which appears in Part II, Item 8 of this Annual Report on Form 10-K.
We provide services in more than 45 languages and in 60 countries, regions, and territories, including localized versions of Yahoo! in Argentina, Australia, Austria, Brazil, Canada, Chile, China, Colombia, Egypt, France, Germany, Greece, Hong Kong, India, Indonesia, Ireland, Italy, Japan, Jordan, Korea, Kuwait, Malaysia, Mexico, the Netherlands, New Zealand, Peru, the Philippines, Russia, Saudi Arabia, Scandinavia (Denmark, Finland, Norway, and Sweden), Singapore, Spain, Switzerland, Taiwan, Thailand, Turkey, the United Arab Emirates, the United Kingdom, the United States, Venezuela, and Vietnam.
Outside of native English speaking countries, we provide some of our most popular user services through Yahoo! Asia (our English language portal to Southeast Asia), Yahoo! Canada En Français (French Canadian Website), and Yahoo! En Espanol (United States Hispanic Website).
We own a majority or 100 percent of all of these international operations (except in Australia and New Zealand, China, and Japan where we have joint ventures and/or noncontrolling interests). We support these businesses through a network of offices worldwide.
Revenue is primarily attributed to individual countries according to the international online property that generated the revenue.
Information regarding risks involving our international operations is included in Part I, Item 1A Risk Factors of this Annual Report on Form 10-K and is incorporated herein by reference.
SALES
We maintain three primary channels for selling our advertising services: field, mid-market, and reseller/small business. Our field advertising sales team sells display advertising in all markets and search advertising services in non-transitioned markets to leading advertisers and agencies. Under the Search Agreement, our field
10
advertising team also sells search advertising to premium advertisers in transitioned markets. Our mid-market channel sells our services to medium-sized businesses, while our reseller/small business channel enables us to sell advertising services to additional regional and small business advertisers. In 2011, we reorganized our U.S. sales force to focus on our customers and sales solutions to better meet their needs.
In the U.S., we employ sales professionals in multiple locations, including Atlanta, Boston, Chicago, Dallas, Detroit, Hillsboro, Los Angeles, Miami, New York, Omaha, San Francisco, and Sunnyvale. In international markets, we either have our own internal sales professionals or have established sales agency relationships in 50 countries, regions, and territories.
No individual customer represented more than 10 percent of our revenue in 2009, 2010, or 2011. Revenue under the Search Agreement represented more than 10 percent of our revenue during 2011.
Internet usage is subject to seasonal fluctuations, typically declining during customary summer vacation periods and becoming most active during the fourth quarter holiday period due to increased online retail activity. This seasonality pattern has affected, and we expect will continue to affect, our business and quarterly sequential revenue growth rates.
MARKETING
The Yahoo! brand is one of the most widely recognized in the world. Maintaining and growing the Yahoo! brand enables us to attract, retain, and more deeply engage users, advertisers, publishers, and developers. We believe a great brand begins with great products, services, and content. Our marketing teams engage in each step of product and services development, deployment, and management and content design to understand and shape our offerings to better market them to our communities of potential and existing users.
COMPETITION
We operate in the Internet products, services, and content markets, which are highly competitive and characterized by rapid change, emerging and converging technologies, and increasing competition. Our most significant competition is from Facebook, Google, Microsoft, and AOL, which each generally offer an integrated variety of Internet products, services, and/or content. We compete with these and other companies for users, advertisers, publishers, and developers. We also compete with these companies to obtain agreements with software publishers, Internet access providers, mobile carriers, device manufacturers and others to promote or distribute our services to their users. In addition, we compete with advertising networks, exchanges, demand side platforms and other platforms, such as Google AdSense, DoubleClick Ad Exchange, AOLs Ad.com and Microsoft Media Network, as well as traditional media companies for a share of advertisers marketing budgets and in the development of the tools and systems for managing and optimizing advertising campaigns.
We believe our principal competitive strengths relating to attracting and retaining users include our ability to provide premium and exclusive content; the usefulness, accessibility, integration, and personalization of the online services that we offer; the quality, personalization, and presentation of our search results; and the overall user experience on Yahoo! Properties. Our principal competitive strengths relating to attracting advertisers and publishers are the reach, effectiveness, and efficiency of our marketing services as well as the creativity of the marketing solutions that we offer. Reach is the size of the audience and/or demographic that can be accessed through the Yahoo! network. Effectiveness for advertisers is the achievement of marketing objectives, which we support by developing campaigns, measuring the performance of these campaigns against their objectives, and optimizing their objectives across the Yahoo! network. Effectiveness for publishers is the monetization of their online audiences. Efficiency is the simplicity and ease of use of the services we offer advertisers and publishers.
In international markets, we also compete with local portals that are predominantly supported by local telecommunication providers or local providers of specific locally designed and marketed Internet services, some
11
of which may have a potential competitive advantage due to an existing direct billing relationship with their users, dominant market share in their territories, greater brand recognition, focus on a single market, familiarity with local tastes and preferences, or greater regulatory and operational flexibility.
Additional information regarding competition is included in Part I, Item 1A Risk Factors of this Annual Report on Form 10-K and is incorporated herein by reference.
PRODUCT DEVELOPMENT
Yahoo! continually enhances, expands, and launches products and features to meet evolving user, advertiser, and publisher needs for technological innovation and a deeper, more integrated experience.
Most of our software products and features are developed internally by our employees. In some instances, however, we might purchase technology and license intellectual property rights if the opportunity is strategically aligned, operationally compatible, and economically advantageous. While it may be necessary in the future to seek or renew licenses relating to various aspects of our products, we believe based on past experience and industry practice that such licenses generally could be obtained on commercially reasonable terms. We believe our continuing innovation and product development are not materially dependent upon any single license or other agreement with a third party relating to the development of our products.
Yahoo!s Product Development organization includes a broad array of engineering talent that spans the breadth of our technology infrastructure. This includes deep expertise in scalable platforms, networking and communications technologies and presentation layer frameworks. Our Product Development organization includes Yahoo! Labs. This organization includes our industry-leading Yahoo! Research group, our Applied Sciences group and our Academic Relations team, which has spearheaded key relationships with some of the worlds most influential universities and institutions. Yahoo! Labs is designed to foster the long-term scientific competitiveness of Yahoo! as a world leader on the Internet through cutting-edge, multi-disciplinary research in a variety of fields, including economic theory, computer science, artificial intelligence, and various social sciences. In addition to Yahoo! Labs, the Product Development organization contains our Cloud Computing group which provides the common computing infrastructure upon which our products are delivered, including grid computing. Finally, the Product Development organization contains our Cloud Platforms group, which focuses on the common elements that are embedded in multiple Yahoo! Products. These elements include the user data base and login, video and social connection platforms.
Our engineering and production teams are primarily located in our Sunnyvale, California headquarters, Bangalore, India, and Beijing, China. Product development expenses for 2009, 2010, and 2011 totaled approximately $1.2 billion, $1.1 billion, and $1.0 billion, respectively, which included stock-based compensation expense of $206 million, $107 million, and $90 million, respectively.
INTELLECTUAL PROPERTY
We create, own, and maintain a wide array of intellectual property assets that we believe are among our most valuable assets. Our intellectual property assets include patents and patent applications related to our innovations, products and services; trademarks related to our brands, products and services; copyrights in software and creative content; trade secrets; and other intellectual property rights and licenses of various kinds. We seek to protect our intellectual property assets through patents, copyrights, trade secrets, trademarks and laws of the U.S. and other countries, and through contractual provisions. We enter into confidentiality and invention assignment agreements with our employees and contractors, and utilize non-disclosure agreements with third parties with whom we conduct business in order to secure and protect our proprietary rights and to limit access to, and disclosure of, our proprietary information. We consider the Yahoo! trademark and our many related company brands to be among our most valuable assets, and we have registered these trademarks in the U.S. and other countries throughout the world and actively seek to protect them. We have licensed in the past, and expect that we may license in the future, certain of our technology and proprietary rights, such as trademark, patent, copyright, and trade secret rights, to third parties.
12
Additional information regarding certain risks related to our intellectual property is included in Part I, Item 1A Risk Factors of this Annual Report on Form 10-K and is incorporated herein by reference.
EMPLOYEES
As of December 31, 2011, we had approximately 14,100 full-time employees. Our future success is substantially dependent on the performance of our senior management and key technical personnel, as well as our continuing ability to attract, maintain the caliber of, and retain highly qualified technical, executive, and managerial personnel. Additional information regarding certain risks related to our employees is included in Part I, Item 1A Risk Factors of this Annual Report on Form 10-K and is incorporated herein by reference.
AVAILABLE INFORMATION
Our Website is located at http://www.yahoo.com. Our investor relations Website is located at http://investor.yahoo.net. We make available free of charge on our investor relations Website under SEC Filings our Annual Reports on Form 10-K, Quarterly Reports on Form 10-Q, Current Reports on Form 8-K, and any amendments to those reports as soon as reasonably practicable after we electronically file or furnish such materials to the U.S. Securities and Exchange Commission (SEC). The SEC maintains a Website that contains reports, proxy and information statements, and other information regarding our filings at http://www.sec.gov.
13
| Item 1A. | Risk Factors |
We face significant competition for users, advertisers, publishers, developers, and distributors.
We face significant competition from integrated online media companies as well as from social networking sites, traditional print and broadcast media, general purpose and vertical search engines and various e-commerce sites. In a number of international markets, especially those in Asia, Europe, the Middle East and Latin America, we face substantial competition from local Internet service providers and other portals that offer search, communications, and other commercial services.
Several of our competitors offer an integrated variety of Internet products, advertising services, technologies, online services and content in a manner similar to Yahoo!. We compete against these and other companies to attract and retain users, advertisers, developers, and third-party Website publishers as participants in our Affiliate network, and to obtain agreements with third parties to promote or distribute our services. We also compete with social media and networking sites which are attracting a substantial and increasing share of users and users online time, and may continue to attract an increasing share of online advertising dollars.
In addition, several competitors offer products and services that directly compete for users with our offerings, including consumer e-mail, local search, instant messaging, daily deals, photos, maps, video sharing, content channels, mobile applications, and shopping. Similarly, the advertising networks operated by our competitors or by other participants in the display marketplace offer services that directly compete with our offerings for advertisers, including advertising exchanges, ad networks, demand side platforms, ad serving technologies and sponsored search offerings. We also compete with traditional print and broadcast media companies to attract domestic and international advertising spending. Some of our existing competitors and possible entrants may have greater brand recognition for certain products and services, more expertise in a particular segment of the market, and greater operational, strategic, technological, financial, personnel, or other resources than we do. Many of our competitors have access to considerable financial and technical resources with which to compete aggressively, including by funding future growth and expansion and investing in acquisitions, technologies, and research and development. Further, emerging start-ups may be able to innovate and provide new products and services faster than we can. In addition, competitors may consolidate with each other or collaborate, and new competitors may enter the market. Some of our competitors in international markets have a substantial competitive advantage over us because they have dominant market share in their territories, are owned by local telecommunications providers, have greater brand recognition, are focused on a single market, are more familiar with local tastes and preferences, or have greater regulatory and operational flexibility due to the fact that we may be subject to both U.S. and foreign regulatory requirements.
If our competitors are more successful than we are in developing and deploying compelling products or in attracting and retaining users, advertisers, publishers, developers, or distributors, our revenue and growth rates could decline.
The majority of our revenue is derived from display and search, and the reduction in spending by or loss of current or potential advertisers would cause our revenue and operating results to decline.
For the twelve months ended December 31, 2011, 81 percent of our total revenue came from display and search. Our ability to continue to retain and grow display and search revenue depends upon:
| | maintaining and growing our user base; |
| | maintaining and growing our popularity as an Internet destination site; |
| | maintaining and expanding our advertiser base on the Internet and mobile devices; |
| | broadening our relationships with advertisers to small- and medium-sized businesses; |
| | successfully implementing changes and improvements to our advertising management platforms and obtaining the acceptance of our advertising management platforms by advertisers, Website publishers, and online advertising networks; |
14
| | successfully acquiring, investing in, and implementing new technologies and strategic partnerships; |
| | successfully implementing changes in our sales force, sales development teams, and sales strategy; |
| | continuing to innovate and improve the monetization capabilities of our display advertising products; |
| | effectively monetizing search queries; |
| | continuing to innovate and improve users search experiences; |
| | maintaining and expanding our Affiliate program for search and display advertising services; and |
| | deriving better demographic and other information about our users to enable us to offer better experiences to both our users and advertisers. |
In most cases, our agreements with advertisers have a term of one year or less, and may be terminated at any time by the advertiser or by us. Search marketing agreements often have payments dependent upon usage or click-through levels. Accordingly, it is difficult to forecast display and search revenue accurately. In addition, our expense levels are based in part on expectations of future revenue, including occasional guaranteed minimum payments to our Affiliates in connection with search and/or display advertising, and are fixed over the short-term in some categories. The state of the global economy and availability of capital has impacted and could further impact the advertising spending patterns of existing and potential advertisers. Any reduction in spending by, or loss of, existing or potential advertisers would negatively impact our revenue and operating results. Further, we may be unable to adjust our expenses and capital expenditures quickly enough to compensate for any unexpected revenue shortfall.
Adverse general economic conditions have caused and could cause decreases or delays in display and search services spending by our advertisers and could harm our ability to generate display and search revenue and our results of operations.
Display and search expenditures tend to be cyclical, reflecting overall economic conditions and budgeting and buying patterns. Since we derive most of our revenue from display and search, adverse economic conditions have caused, and a continuation of adverse economic conditions could cause, additional decreases or delays in advertising spending, a reduction in our display and search revenue and a negative impact on our short-term ability to grow our revenue. Further, any decreased collectability of accounts receivable or early termination of agreements, whether resulting from customer bankruptcies or otherwise due to the current economic conditions, could negatively impact our results of operations.
If we do not manage our operating expenses effectively, our profitability could decline.
We have implemented cost reduction initiatives to better align our operating expenses with our revenue, including reducing our headcount, outsourcing some administrative functions, consolidating space and terminating leases or entering into subleases. We plan to continue to manage costs to better and more efficiently manage our business. However, our operating expenses might also increase from their reduced levels as we expand our operations in areas of desired growth, continue to develop and extend the Yahoo! brand, fund product development, build data centers or acquire real property, and acquire and integrate complementary businesses and technologies. Our operating costs might also increase if we do not effectively manage costs as we transition markets under the Search Agreement and reimbursements from Microsoft under the Search Agreement decline or cease. In addition, weak economic conditions or other factors could cause our business to contract, requiring us to implement additional cost cutting measures. If our expenses increase at a greater pace than our revenue, or if we fail to implement additional cost cutting if required in a timely manner, our profitability will decline.
15
Transition, implementation and execution risks associated with our Search Agreement with Microsoft may adversely affect our business and operating results.
Under our Search Agreement with Microsoft, Microsoft is the exclusive algorithmic and paid search services provider on Yahoo! Properties and non-exclusive provider of such services on Affiliate sites for the transitioned markets. Revenue under the Search Agreement represented more than 10 percent of our revenue during 2011. The parties commenced implementation of the Search Agreement on February 23, 2010. The transition process is complex and requires the expenditure of significant time and resources by us. We have completed the transition of our algorithmic search platform to the Microsoft platform in all markets, and have completed transition of paid search in several markets, including the U.S., Canada, and India. The market-by-market transition of our paid search platform to Microsofts platform and the migration of paid search advertisers and publishers to Microsofts platform are expected to continue through the first half of 2013. Delays or difficulties in, or disruptions and inconveniences caused by, the transition process could result in the loss of advertisers, publishers, Affiliates, and employees, as well as delays in recognizing or reductions in the anticipated benefits of the transaction, any of which could negatively impact our business and operating results.
If Microsoft fails to perform as required under the Search Agreement for any reason or suffers service level interruptions or other performance issues (including if Microsoft is unable to effectively monetize search queries in markets where paid search has transitioned under the Search Agreement), or if advertisers, Affiliates, or users are less satisfied than expected with the services provided or results obtained after transition or during the period prior to the transition of search to Microsoft in their respective markets, we may not realize the anticipated benefits of the Search Agreement, we may lose advertisers, publishers and Affiliates, we may lose exclusivity with certain publishers, and our search revenue or our profitability could decline. Under the Search Agreement, for each market, Microsoft generally guarantees Yahoo!s revenue per search (RPS Guarantee) on Yahoo! Properties for 18 months after the transition of paid search services to Microsofts platform in that market. In 2011, Microsoft agreed to extend the RPS Guarantee in the U.S. and Canada through March 2013. To the extent the RPS Guarantee payments we receive do not fully offset any shortfall relating to revenue per search in transitioned markets or if our revenue per search upon expiration of the RPS Guarantee payments is lower than the guarantee levels, our search revenue, or our profitability could decline. Notwithstanding any RPS Guarantee payments that we may receive, our competitors may increase revenue, profitability and market share at a higher rate than us.
If we are unable to provide innovative search experiences and other products and services that generate significant traffic to our Websites, our business could be harmed, causing our revenue to decline.
Internet search is characterized by rapidly changing technology, significant competition, evolving industry standards, and frequent product and service enhancements. We must continually invest in improving our users search experiencepresenting users with a search experience that is responsive to their needs and preferencesin order to continue to attract, retain, and expand our user base and paid search advertiser base.
We currently deploy our own technology to provide algorithmic Web search and paid search results on our network, except in markets where we have transitioned those services to Microsofts platform. Even after we complete the transition to Microsofts platform in all markets, we will need to continue to invest and innovate to improve our users search experience.
We also generate revenue through other online products and services, such as Yahoo! Mail. If we are unable to provide innovative search and other products and services which generate significant traffic to our Websites, our business could be harmed, causing our revenue to decline.
16
Our comprehensive strategic review may cause uncertainty regarding the future of our business, impact employee hiring and retention, increase the volatility in our stock price, and adversely impact our revenue, operating results, and financial condition.
Our Board of Directors is engaged in a comprehensive strategic review, which includes evaluating the full range of options available to return our company to increased growth and innovation. Our Boards strategic review and any related speculation and uncertainty regarding our future business strategy and direction, including litigation pending in the Delaware Chancery Court relating to the strategic review process, may cause or result in:
| | disruption of our business or distraction of our employees and management; |
| | difficulty in recruiting, hiring, motivating, and retaining talented and skilled personnel; |
| | increased stock price volatility; |
| | difficulty in negotiating, maintaining, or consummating business or strategic relationships or transactions; and |
| | increased advisory fees or costs to investigate or defend litigation, even if claims are without merit or do not ultimately result in liability or changes in business practices. |
If we are unable to mitigate these or other potential risks related to the uncertainty caused by the strategic review, it may disrupt our business or adversely impact our revenue, operating results, and financial condition.
If we are unable to recruit and retain key personnel, we may not be able to execute our business plan.
Our business is dependent on our ability to recruit, hire, motivate, and retain talented, highly skilled personnel. Achieving this objective may be difficult due to many factors, including the intense competition for such highly skilled personnel in the San Francisco Bay Area and other metropolitan areas where our offices and the offices of several of our competitors are located; fluctuations in global economic and industry conditions; changes in our management or leadership; uncertainty due to our comprehensive strategic review; competitors hiring practices; and the effectiveness of our compensation programs. If we do not succeed in recruiting, retaining, and motivating our key employees and in attracting new key personnel, we may be unable to meet our business plan and as a result, our revenue and profitability may decline.
If we are unable to license or acquire compelling content and services at reasonable cost or if we do not develop or commission compelling content of our own, the number of users of our services may not grow as anticipated, or may decline, or users level of engagement with our services may decline, all or any of which could harm our operating results.
Our future success depends in part on our ability to aggregate compelling content and deliver that content through our online properties. We license from third parties much of the content and services on our online properties, such as news items, stock quotes, weather reports, music videos, music radio, and maps. We believe that users will increasingly demand high-quality content and services, including music videos, film clips, news footage, and special productions. Such content and services may require us to make substantial payments to third parties from whom we license or acquire such content or services. Our ability to maintain and build relationships with such third-party providers is critical to our success. In addition, as new methods for accessing the Internet become available, including through alternative devices, we may need to enter into amended agreements with existing third-party providers to cover the new devices. We may be unable to enter into new, or preserve existing, relationships with the third-parties whose content or services we seek to obtain. In addition, as competition for compelling content increases both domestically and internationally, our third-party providers may increase the prices at which they offer their content and services to us, and potential providers may not offer their content or services to us at all, or may offer them on terms that are not agreeable to us. An increase in the prices charged to us by third-party providers could harm our operating results and financial condition. Further, many of our content and services licenses with third parties are non-exclusive. Accordingly, other media providers may be able to offer similar or identical content. This increases the importance of our ability to deliver compelling editorial content and personalization of this content for users in order to differentiate Yahoo! from other businesses. If we
17
are unable to license or acquire compelling content at reasonable prices, if other companies distribute content or services that are similar to or the same as that provided by us, or if we do not develop compelling editorial content or personalization services, the number of users of our services may not grow as anticipated, or may decline, which could harm our operating results.
We rely on the value of our brands, and a failure to maintain or enhance the Yahoo! brands in a cost-effective manner could harm our operating results.
We believe that maintaining and enhancing our brands is an important aspect of our efforts to attract and expand our user, advertiser, and Affiliate base. We also believe that the importance of brand recognition will increase due to the relatively low barriers to entry in certain portions of the Internet market. We have spent considerable money and resources to date on the establishment and maintenance of our brands, and we anticipate continuing to spend and devote resources to, advertising, marketing, and other brand-building efforts to preserve and enhance consumer awareness of our brands. Our brands may be negatively impacted by a number of factors, including among other issues: service outages; product malfunctions; data privacy and security issues; exploitation of our trademarks by others without permission; and poor presentation or integration of our search marketing offerings by Affiliates on their sites or in their software and services.
Further, while we attempt to ensure that the quality of our brands is maintained by our licensees, our licensees might take actions that could impair the value of our brands, our proprietary rights, or the reputation of our products and media properties. If we are unable to maintain or enhance customer awareness of, and trust in, our brands in a cost-effective manner, or if we incur excessive expenses in these efforts, our business, operating results and financial condition could be harmed.
Our intellectual property rights are valuable, and any failure or inability to sufficiently protect them could harm our business and our operating results.
We create, own, and maintain a wide array of intellectual property assets, including copyrights, patents, trademarks, trade dress, trade secrets, and rights to certain domain names, which we believe are collectively among our most valuable assets. We seek to protect our intellectual property assets through patent, copyright, trade secret, trademark, and other laws of the U.S. and other countries of the world, and through contractual provisions. However, the efforts we have taken to protect our intellectual property and proprietary rights might not be sufficient or effective at stopping unauthorized use of those rights. Protection of the distinctive elements of Yahoo! might not always be available under copyright law or trademark law, or we might not discover or determine the full extent of any unauthorized use of our copyrights and trademarks in order to protect our rights. In addition, effective trademark, patent, copyright, and trade secret protection might not be available or cost-effective in every country in which our products and media properties are distributed or made available through the Internet. Changes in patent law, such as changes in the law regarding patentable subject matter, could also impact our ability to obtain patent protection for our innovations. In particular, recent amendments to the U.S. patent law will become effective in 2012 and may affect our ability to protect our innovations and defend against claims of patent infringement. Further, given the costs of obtaining patent protection, we might choose not to protect (or not to protect in some jurisdictions) certain innovations that later turn out to be important. There is also a risk that the scope of protection under our patents may not be sufficient in some cases or that existing patents may be deemed invalid or unenforceable. With respect to maintaining our trade secrets, we have entered into confidentiality agreements with most of our employees and contractors, and confidentiality agreements with many of the parties with whom we conduct business in order to limit access to and disclosure of our proprietary information. However, these agreements might be breached and our trade secrets might be compromised by outside parties or by our employees, which could cause us to lose any competitive advantage provided by maintaining our trade secrets.
If we are unable to protect our proprietary rights from unauthorized use, the value of our intellectual property assets may be reduced. In addition, protecting our intellectual property and other proprietary rights is expensive and time consuming. Any increase in the unauthorized use of our intellectual property could make it more expensive to do business and consequently harm our operating results.
18
We are, and may in the future be, subject to intellectual property infringement or other third-party claims, which are costly to defend, could result in significant damage awards, and could limit our ability to provide certain content or use certain technologies in the future.
Internet, technology, media, and patent holding companies often possess a significant number of patents. Further, many of these companies and other parties are actively developing or purchasing search, indexing, electronic commerce, and other Internet-related technologies, as well as a variety of online business models and methods.
We believe that these parties will continue to take steps to protect these technologies, including, but not limited to, seeking patent protection. In addition, patent holding companies may continue to seek to monetize patents they have purchased or otherwise obtained. As a result, disputes regarding the ownership of technologies and rights associated with online businesses are likely to continue to arise in the future. From time to time, parties assert patent infringement claims against us. Currently, we are engaged in a number of lawsuits regarding patent issues and have been notified of a number of other potential disputes.
In addition to patent claims, third parties have asserted, and are likely in the future to assert, claims against us alleging infringement of copyrights, trademark rights, trade secret rights or other proprietary rights, or alleging unfair competition, violation of federal or state statutes or other claims, including alleged violation of international statutory and common law. In addition, third parties have made, and may continue to make, infringement and related claims against us over the display of content or search results triggered by search terms, including the display of advertising, that include trademark terms. Currently, we are engaged in lawsuits regarding such intellectual property issues.
As we expand our business and develop new technologies, products and services, we may become increasingly subject to intellectual property infringement claims, including those that may arise under international laws. In the event that there is a determination that we have infringed third-party proprietary rights such as patents, copyrights, trademark rights, trade secret rights, or other third-party rights such as publicity and privacy rights, we could incur substantial monetary liability, or be required to enter into costly royalty or licensing agreements or be prevented from using such rights, which could require us to change our business practices in the future, hinder us from offering certain features, functionalities, products or services, require us to develop non-infringing products or technologies, and limit our ability to compete effectively. We may also incur substantial expenses in defending against third-party claims regardless of the merit of such claims. In addition, many of our agreements with our customers or Affiliates require us to indemnify them for some types of third-party intellectual property infringement claims, which could increase our costs in defending such claims and our damages. Furthermore, such customers and Affiliates may discontinue the use of our products, services, and technologies either as a result of injunctions or otherwise. The occurrence of any of these results could harm our brands or have an adverse effect on our business, financial position, operating results, and cash flows.
We are subject to a variety of new and existing U.S. and foreign government laws and regulations which could subject us to claims, judgments, monetary liabilities and other remedies, and to limitations on our business practices.
We are subject to laws and regulations directly applicable to providers of Internet, mobile, and voice over Internet protocol, or VOIP, services both domestically and internationally. The application of existing domestic and international laws and regulations to us relating to issues such as user privacy and data protection, security, defamation, pricing, advertising, taxation, gambling, sweepstakes, promotions, billing, real estate, consumer protection, accessibility, content regulation, quality of services, law enforcement demands, telecommunications, mobile, television, and intellectual property ownership and infringement in many instances is unclear or unsettled. In addition, we will also be subject to any new laws and regulations directly applicable to our domestic and international activities. Further, the application of existing laws to us or our subsidiaries regulating or requiring licenses for certain businesses of our advertisers including, for example, distribution of pharmaceuticals, alcohol, adult content, tobacco, or firearms, as well as insurance and securities brokerage, and
19
legal services, can be unclear. Internationally, we may also be subject to laws regulating our activities in foreign countries and to foreign laws and regulations that are inconsistent from country to country. We may incur substantial liabilities for expenses necessary to defend such litigation or to comply with these laws and regulations, as well as potential substantial penalties for any failure to comply. Compliance with these laws and regulations may also cause us to change or limit our business practices in a manner adverse to our business.
A number of U.S. federal laws, including those referenced below, impact our business. The Digital Millennium Copyright Act (DMCA) is intended, in part, to limit the liability of eligible online service providers for listing or linking to third-party Websites that include materials that infringe copyrights or other rights of others. Portions of the Communications Decency Act (CDA) are intended to provide statutory protections to online service providers who distribute third-party content. We rely on the protections provided by both the DMCA and the CDA in conducting our business. If these or other laws or judicial interpretations are changed to narrow their protections, or if international jurisdictions refuse to apply similar provisions in foreign lawsuits, we will be subject to greater risk of liability, our costs of compliance with these regulations or to defend litigation may increase, or our ability to operate certain lines of business may be limited. The Childrens Online Privacy Protection Act is intended to impose restrictions on the ability of online services to collect some types of information from children under the age of 13. In addition, Providing Resources, Officers, and Technology to Eradicate Cyber Threats to Our Children Act of 2008 (PROTECT Act) requires online service providers to report evidence of violations of federal child pornography laws under certain circumstances. Other federal, state or international laws and legislative efforts designed to protect children on the Internet may impose additional requirements on us. U.S. export control laws and regulations impose requirements and restrictions on exports to certain nations and persons and on our business.
Changes in these or any other laws and regulations or the interpretation of them could increase our future compliance costs, make our products and services less attractive to our users, or cause us to change or limit our business practices. Further, any failure on our part to comply with any relevant laws or regulations may subject us to significant civil or criminal liabilities.
Changes in regulations or user concerns regarding privacy and protection of user data, or any failure to comply with such laws, could adversely affect our business.
The use of consumer data by online service providers and advertising networks is a topic of active interest among federal, state, and international regulatory bodies, and the regulatory environment is unsettled. Federal, state, and international laws and regulations govern the collection, use, retention, disclosure, sharing and security of data that we receive from and about our users. Our privacy policies and practices concerning the collection, use, and disclosure of user data are posted on our and many of our Affiliates Websites. Any failure, or perceived failure, by us to comply with our posted privacy policies, to make effective modifications to our privacy policies, or to comply with any data-related consent orders, Federal Trade Commission requirements or orders, or other federal, state, or international privacy or data-protection-related laws, regulations or industry self-regulatory principles could result in proceedings or actions against us by governmental entities or others, which could potentially have an adverse effect on our business.
Further, failure or perceived failure by us to comply with our policies, applicable requirements, or industry self-regulatory principles related to the collection, use, sharing or security of personal information, or other privacy, data-retention or data-protection matters could result in a loss of user confidence in us, damage to the Yahoo! brands, and ultimately in a loss of users, advertising partners, or Affiliates which could adversely affect our business.
In addition, various federal, state and foreign legislative or regulatory bodies may enact new or additional laws and regulations concerning privacy, data-retention and data-protection issues, including laws or regulations mandating disclosure to domestic or international law enforcement bodies, which could adversely impact our business, our brand or our reputation with users. The interpretation and application of privacy, data protection
20
and data retention laws and regulations are currently unsettled in the U.S. and internationally. These laws may be interpreted and applied inconsistently from country to country and inconsistently with our current policies and practices, making it difficult to make long-range business planning decisions regarding data use, notice, storage, access, or retention. Complying with these varying international requirements could cause us to incur substantial costs or require us to change our business practices in a manner adverse to our business.
If our security measures are breached, our products and services may be perceived as not being secure, users and customers may curtail or stop using our products and services, and we may incur significant legal and financial exposure.
Our products and services involve the storage and transmission of Yahoo!s users and customers personal and proprietary information in our facilities and on our equipment, networks and corporate systems. Security breaches could expose us to a risk of loss of this information, litigation, remediation costs, increased costs for security measures, loss of revenue, damage to our reputation, and potential liability. Our user data and corporate systems and security measures may be breached due to the actions of outside parties, employee error, malfeasance, or otherwise, and, as a result, an unauthorized party may obtain access to our data or our users or customers data. Additionally, outside parties may attempt to fraudulently induce employees, users, or customers to disclose sensitive information in order to gain access to our data or our users or customers data. We must continuously examine and modify our security controls and business policies to adapt to the rise of social networking, the adoption of new devices and technologies enabling users to share data and communicate in new ways, and the increasing focus by our users and regulators on controlling and protecting user data.
Any breach or unauthorized access could result in significant legal and financial exposure, increased costs for security measures or to defend litigation or damage to our reputation, and a loss of confidence in the security of our products and services and networks that could potentially have an adverse effect on our business. Because the techniques used to obtain unauthorized access, disable or degrade service, or sabotage systems change frequently or may be designed to remain dormant until a predetermined event and often are not recognized until launched against a target, we may be unable to anticipate these techniques or implement adequate preventative measures. If an actual or perceived breach of our security occurs, the market perception of the effectiveness of our security measures could be harmed, we could lose users and customers, and we could suffer financial exposure due to such events or in connection with remediation efforts, investigation costs, changed security, and system protection measures.
We may be subject to legal liability associated with providing online services or content.
We host and provide a wide variety of services and technology products that enable and encourage individuals and businesses to exchange information, upload or otherwise generate photos, videos, text, and other content; advertise products and services; conduct business; and engage in various online activities both domestically and internationally. As a publisher of original content, we may be subject to claims such as libel, defamation or improper use of publicity rights, as well as infringement claims such as plagiarism. The law relating to the liability of providers of online services and products for activities of their users is currently unsettled both within the U.S. and internationally. Claims have been threatened and brought against us for defamation, negligence, breaches of contract, plagiarism, copyright or trademark infringement, unfair competition, unlawful activity, tort, including personal injury, fraud, or other theories based on the nature and content of information which we publish or to which we provide links or that may be posted online or generated by us or by third parties, including our users. In addition, we have been and may again in the future be subject to domestic or international actions alleging that certain content we have generated or third-party content that we have made available within our services violates laws in domestic and international jurisdictions. Defense of any such actions could be costly and involve significant time and attention of our management and other resources, may result in monetary liabilities or penalties, and may require us to change our business in an adverse manner.
We arrange for the distribution of third-party advertisements to third-party publishers and advertising networks, and we offer third-party products, services, or content, such as stock quotes and trading information, under the
21
Yahoo! brand or via distribution on Yahoo! Properties. We may be subject to claims concerning these products, services, or content by virtue of our involvement in marketing, branding, broadcasting, or providing access to them, even if we do not ourselves host, operate, provide, or provide access to these products, services, or content. While our agreements with respect to these products, services, and content often provide that we will be indemnified against such liabilities, the ability to receive such indemnification may be disputed, could result in substantial costs to enforce or defend, and depends on the financial resources of the other party to the agreement, and any amounts received might not be adequate to cover our liabilities or the costs associated with defense of such proceedings.
It is also possible that if the manner in which information is provided or any information provided directly by us contains errors or is otherwise wrongfully provided to users, third parties could make claims against us. For example, we offer Web-based e-mail services, which expose us to potential risks, such as liabilities or claims resulting from unsolicited e-mail, lost or misdirected messages, illegal or fraudulent use of e-mail, alleged violations of policies or privacy protections, including civil or criminal laws, or interruptions or delays in e-mail service. We may also face purported consumer class actions or state actions relating to our online services, including our fee-based services (particularly in connection with any decision to discontinue a fee-based service). In addition, our customers, third parties, or government entities may assert claims or actions against us if our online services or technologies are used to spread or facilitate malicious or harmful code or applications. Investigating and defending these types of claims are expensive, even if the claims are without merit or do not ultimately result in liability, and could subject us to significant monetary liability or cause a change in business practices that could negatively impact our ability to compete.
Acquisitions and strategic investments could result in adverse impacts on our operations and in unanticipated liabilities.
We have acquired, and have made strategic investments in, a number of companies (including through joint ventures) in the past, and we expect to make additional acquisitions and strategic investments in the future. Such transactions may result in dilutive issuances of our equity securities, use of our cash resources, and incurrence of debt and amortization expenses related to intangible assets. Our acquisitions and strategic investments to date were accompanied by a number of risks, including:
| | the difficulty of assimilating the operations and personnel of our acquired companies into our operations; |
| | the potential disruption of our ongoing business and distraction of management; |
| | the incurrence of additional operating losses and expenses of the businesses we acquired or in which we invested; |
| | the difficulty of integrating acquired technology and rights into our services and unanticipated expenses related to such integration; |
| | the failure to successfully further develop acquired technology resulting in the impairment of amounts currently capitalized as intangible assets; |
| | the failure of strategic investments to perform as expected; |
| | the potential for patent and trademark infringement and data privacy and security claims against the acquired companies, or companies in which we have invested; |
| | litigation or other claims in connection with acquisitions, acquired companies, or companies in which we have invested; |
| | the impairment or loss of relationships with customers and partners of the companies we acquired or in which we invested or with our customers and partners as a result of the integration of acquired operations; |
| | the impairment of relationships with, or failure to retain, employees of acquired companies or our existing employees as a result of integration of new personnel; |
| | our lack of, or limitations on our, control over the operations of our joint venture companies; |
22
| | the difficulty of integrating operations, systems, and controls as a result of cultural, regulatory, systems, and operational differences; |
| | in the case of foreign acquisitions and investments, the impact of particular economic, tax, currency, political, legal and regulatory risks associated with specific countries; and |
| | the impact of known potential liabilities or liabilities that may be unknown, including as a result of inadequate internal controls, associated with the companies we acquired or in which we invested. |
We are likely to experience similar risks in connection with our future acquisitions and strategic investments. Our failure to be successful in addressing these risks or other problems encountered in connection with our past or future acquisitions and strategic investments could cause us to fail to realize the anticipated benefits of such acquisitions or investments, incur unanticipated liabilities, and harm our business generally.
Any failure to manage expansion and changes to our business could adversely affect our operating results.
We continue to evolve our business. As a result of acquisitions, and international expansion in recent years, more than half of our employees are now based outside of our Sunnyvale, California headquarters. If we are unable to effectively manage a large and geographically dispersed group of employees or to anticipate our future growth and personnel needs, our business may be adversely affected.
As we expand our business, we must also expand and adapt our operational infrastructure. Our business relies on data systems, billing systems, and financial reporting and control systems, among others. All of these systems have become increasingly complex in the recent past due to the growing complexity of our business, acquisitions of new businesses with different systems, and increased regulation over controls and procedures. To manage our business in a cost-effective manner, we will need to continue to upgrade and improve our data systems, billing systems, and other operational and financial systems, procedures, and controls. In some cases, we are outsourcing administrative functions to lower-cost providers. These upgrades, improvements and outsourcing changes will require a dedication of resources and in some cases are likely to be complex. If we are unable to adapt our systems and put adequate controls in place in a timely manner, our business may be adversely affected. In particular, sustained failures of our billing systems to accommodate increasing numbers of transactions, to accurately bill users and advertisers, or to accurately compensate Affiliates could adversely affect the viability of our business model.
Any failure to scale and adapt our existing technology architecture to manage expansion of user-facing services and to respond to rapid technological change could adversely affect our business.
As some of the most visited sites on the Internet, Yahoo! Properties deliver a significant number of products, services, page views, and advertising impressions to users around the world. The products and services offered by us are expected to continue to expand and change significantly and rapidly in the future to accommodate new technologies and Internet advertising solutions, and new means of content delivery.
In addition, widespread adoption of new Internet, networking or telecommunications technologies, or other technological changes, could require substantial expenditures to modify or adapt our services or infrastructure. The technology architectures and platforms utilized for our services are highly complex and may not provide satisfactory security features or support in the future, as usage increases and products and services expand, change, and become more complex. In the future, we may make additional changes to our, or move to completely new, architectures, platforms and systems. Such changes may be technologically challenging to develop and implement, may take time to test and deploy, may cause us to incur substantial costs or data loss, and may cause delays or interruptions in service. These changes, delays, or interruptions in our service may cause our users, Affiliates and other advertising platform participants to become dissatisfied with our service and move to competing providers or seek remedial actions or compensation. Further, to the extent that demands for our services increase, we will need to expand our infrastructure, including the capacity of our hardware servers and the sophistication of our software. This expansion is likely to be expensive and complex and require additional
23
technical expertise. As we acquire users who rely upon us for a wide variety of services, it becomes more technologically complex and costly to retrieve, store, and integrate data that will enable us to track each users preferences. Any difficulties experienced in adapting our architectures, platforms and infrastructure to accommodate increased traffic, to store user data, and track user preferences, together with the associated costs and potential loss of traffic, could harm our operating results, cash flows from operations, and financial condition.
We have dedicated considerable resources to provide a variety of premium products and services, which might not prove to be successful in generating significant revenue for us.
We offer fee-based enhancements for many of our free services. The development cycles for these technologies are long and generally require significant investment by us. We have invested and will continue to invest in premium products and services. Some of these premium products and services might not generate anticipated revenue or might not meet anticipated user adoption rates. We have previously discontinued some non-profitable premium services and may discontinue others. General economic conditions as well as the rapidly evolving competitive landscape may affect users willingness to pay for such premium services. If we cannot generate revenue from our premium services that are greater than the cost of providing such services, our operating results could be harmed.
We rely on third parties to provide the technologies necessary to deliver content, advertising, and services to our users, and any change in the licensing terms, costs, availability, or acceptance of these formats and technologies could adversely affect our business.
We rely on third parties to provide the technology to deliver content, advertising, and services to our users. There can be no assurance that these providers will continue to license their technologies to us on reasonable terms, or at all. Providers of those technologies may change the fees they charge users or otherwise change their business model in a manner that slows the widespread acceptance of their technologies. In order for our services to be successful, there must be a large base of users of the technologies necessary to deliver our content, advertising, and services. We have limited or no control over the availability or acceptance of those technologies, and any change in the licensing terms, costs, availability, or user acceptance of these technologies could adversely affect our business.
If we are unable to attract, sustain, and renew distribution arrangements on favorable terms, our revenue may decline.
We enter into distribution arrangements with third parties such as operators of third-party Websites, online networks, software companies, electronics companies, computer manufacturers, and others to promote or supply our services to their users. For example:
| | We maintain search and display advertising relationships with Affiliate sites, which integrate our advertising offerings into their Websites. |
| | We enter into distribution alliances with Internet service providers (including providers of cable and broadband Internet access) and software distributors to promote our services to their users. |
| | We enter into agreements with mobile, tablet, netbook, television, and other device manufacturers, electronics companies and carriers to promote our software and services on their devices. |
In some markets, we depend on a limited number of distribution arrangements for a significant percentage of our user activity. A failure by our distributors to attract or retain their user bases would negatively impact our user activity and, in turn, would reduce our revenue. In some cases, device manufacturers may be unwilling to pay Yahoo! fees in order to distribute Yahoo! services.
24
Distribution agreements often involve revenue sharing. Over time competition to enter into distribution arrangements may cause our traffic acquisition costs to increase. In some cases, we guarantee distributors a minimum level of revenue and, as a result, run a risk that the distributors performance (in terms of ad impressions, toolbar installations, etc.) might not be sufficient to otherwise earn their minimum payments. In other cases, we agree that if the distributor does not realize specified minimum revenue we will adjust the distributors revenue-share percentage or provide make-whole arrangements.
Some of our distribution agreements are not exclusive, have a short term, are terminable at will, or are subject to early termination provisions. The loss of distributors, increased distribution costs, or the renewal of distribution agreements on significantly less favorable terms may cause our revenue to decline.
More individuals are utilizing devices other than a PC to access the Internet, and versions of our services developed for these devices might not gain widespread adoption by the devices users, manufacturers, or distributors or might fail to function as intended on some devices.
The number of individuals who access the Internet through devices other than a PC, such as mobile telephones, personal digital assistants, handheld computers, tablets, netbooks, televisions, and set-top box devices has increased dramatically, and the trend is likely to continue. Our services were originally designed for rich, graphical environments such as those available on PCs. The different hardware and software, memory, operating systems, resolution, and other functionality associated with alternative devices currently available may make our PC services unusable or difficult to use on such devices. Similarly, the licenses we have negotiated to present third-party content to PC users may not extend to users of alternative devices. In those cases, we may need to enter into new or amended agreements with the content providers in order to present a similar user-experience on the new devices. The content providers may not be willing to enter into such new or amended agreements on reasonable terms or at all.
We offer versions of many of our popular services (such as sports, finance, and news) designed to be accessed on a number of models of alternative devices. We also offer versions of some of our services (such as instant messaging) designed for specific popular devices. As new devices are introduced, it is difficult to predict the problems we may encounter in developing versions of our services for use on those devices, and we may need to devote significant resources to the creation, support, and maintenance of such versions or risk loss of market share. If we are unable to successfully innovate new forms of Internet advertising for alternative devices, to attract and retain a substantial number of alternative device manufacturers, distributors, content providers, and users to our services, or to capture a sufficient share of an increasingly important portion of the market for these services, we may be unsuccessful in attracting both advertisers and premium service subscribers to these services.
To the extent that an access provider or device manufacturer enters into a distribution arrangement with one of our competitors, or as our competitors design, develop, or acquire control of alternative connected devices or their operating systems, we face an increased risk that our users will favor the services or properties of that competitor. The manufacturer or access provider might promote a competitors services or might impair users access to our services by blocking access through their devices or by not making our services available in a readily-discoverable manner on their devices. If competitive distributors impair access to our services, or if they simply are more successful than our distributors in developing compelling products that attract and retain users or advertisers, then our revenue could decline.
In the future, as new methods for accessing the Internet and our services become available, including through alternative devices, we may need to enter into amended distribution agreements with existing access providers, distributors, and manufacturers to cover the new devices and new arrangements. We face a risk that existing and potential new access providers, distributors, and manufacturers may decide not to offer distribution of our services on reasonable terms, or at all. If we fail to obtain distribution or to obtain distribution on terms that are reasonable, we may not be able to fully execute our business plan.
25
Our international operations are subject to additional risks which could harm our business, operating results, and financial condition.
In addition to uncertainty about our ability to continue to generate revenue from our foreign operations and expand our international market position, there are additional risks inherent in doing business internationally (including through our international joint ventures), including:
| | trade barriers and changes in trade regulations; |
| | difficulties in developing, staffing, and simultaneously managing a large number of varying foreign operations as a result of distance, language, and cultural differences; |
| | stringent local labor laws and regulations; |
| | longer payment cycles; |
| | credit risk and higher levels of payment fraud; |
| | profit repatriation restrictions and foreign currency exchange restrictions; |
| | political or social unrest, economic instability, repression, or human rights issues; |
| | geopolitical events, including acts of war and terrorism; |
| | import or export regulations; |
| | compliance with U.S. laws such as the Foreign Corrupt Practices Act, and local laws prohibiting bribery and corrupt payments to government officials; |
| | antitrust and competition regulations; |
| | seasonal volatility in business activity and local economic conditions; |
| | laws, regulations, licensing requirements, and business practices that favor local competitors or prohibit foreign ownership or investments; |
| | different or more stringent user protection, content, data protection, privacy and other laws; and |
| | risks related to other government regulation or required compliance with local laws. |
We are subject to numerous and sometimes conflicting U.S. and foreign laws and regulations. Violations of these complex laws and regulations that apply to our international operations could result in damage awards, fines, criminal actions, sanctions, or penalties against us, our officers or our employees, prohibitions on the conduct of our business, and damage to our reputation. Although we have implemented policies and procedures designed to promote compliance with these laws, there can be no assurance that our employees, contractors, or agents will not violate our policies. These risks inherent in our international operations and expansion increase our costs of doing business internationally and could result in harm to our business, operating results, and financial condition.
The benefits of the Framework Agreement may not be realized and we are involved in legal proceedings related to Alipay that may result in adverse outcomes.
On July 29, 2011, we entered into a Framework Agreement with Alibaba Group Limited (Alibaba Group), Softbank Corp., a Japanese corporation, Alipay.com Co., Ltd. (Alipay), APN Ltd., a company organized under the laws of the Cayman Islands (IPCo), Zhejiang Alibaba E-Commerce Co., Ltd., a limited liability company organized under the laws of the Peoples Republic of China (Holdco), Jack Ma Yun, Joseph C. Tsai and certain security holders of Alipay or HoldCo as joinder parties. See Note 4Investments in Equity Interests in the Notes to the consolidated financial statements. Pursuant to the terms of the Framework Agreement, the parties agreed upon the consideration to be received by Alibaba Group for the restructuring of Alipay and the ongoing relationship between Alipay and Alibaba Group and its subsidiaries. The closing contemplated by the Framework Agreement occurred in December 2011. Alibaba Group may not realize the anticipated benefits of the
26
Framework Agreement due to risks and uncertainties including: the failure of Alipay to generate significant royalty and software technology services fees payable to Alibaba Group; the possibility that a liquidity event of Alipay does not occur; the failure or inability of IPCo to pay its promissory note in accordance with its terms; and uncertainties concerning the laws and regulations of the Peoples Republic of China (the PRC) and the PRC regulatory environment.
We and certain officers, directors and third parties are party to a number of stockholder derivative suits and purported stockholder class action suits filed since we filed our Report on Form 10-Q for the quarter ended March 31, 2011 with the Securities and Exchange Commission. See the section captioned Contingencies included in Note 12Commitments and Contingencies in the Notes to the consolidated financial statements. Such claims and proceedings are inherently uncertain and their results cannot be predicted with certainty. Regardless of the outcome, such legal proceedings can have an adverse impact on us because of legal costs, diversion of management resources, and other factors. These lawsuits or any future lawsuits may become time consuming and expensive and may result in adverse outcomes.
New technologies could block our advertisements, impair our ability to serve interest-based advertising, or shift the location in which search results appear, which could harm our operating results.
Technologies have been developed and are likely to continue to be developed that can block display, search, and interest-based advertising, or shift the location in which search results appear on pages so that our advertisements do not appear in the most monetizable places on our pages or are obscured. Most of our revenue is derived from fees paid by advertisers in connection with the display of graphical advertisements or clicks on search advertisements on Web pages. As a result, such technologies and tools could reduce the number of display and search advertisements that we are able to deliver or our ability to serve our interest-based advertising and this, in turn, could reduce our advertising revenue and operating results.
Proprietary document formats may limit the effectiveness of our search technology by preventing our technology from accessing the content of documents in such formats, which could limit the effectiveness of our products and services.
A large amount of information on the Internet is provided in proprietary document formats. These proprietary document formats may limit the effectiveness of search technology by preventing the technology from accessing the content of such documents. The providers of the software applications used to create these documents could engineer the document format to prevent or interfere with the process of indexing the document contents with search technology. This would mean that the document contents would not be included in search results even if the contents were directly relevant to a search. The software providers may also seek to require us to pay them royalties in exchange for giving us the ability to search documents in their format. If the search platform technology we employ is unable to index proprietary format Web documents as effectively as our competitors technology, usage of our search services might decline, which could cause our revenue to fall.
Interruptions, delays, or failures in the provision of our services could harm our operating results.
Delays or disruptions to our service, or the loss or compromise of data, could result from a variety of causes, including the following:
| | Our operations are susceptible to outages and interruptions due to fire, flood, earthquake, tsunami, other natural disasters, power loss, equipment or telecommunications failures, cyber attacks, terrorist attacks, political or social unrest, and other events over which we have little or no control. |
| | The systems through which we provide our products and services are highly technical, complex, and interdependent. Design errors might exist in these systems, or might be introduced as we roll out improvements and upgrades, which might cause service malfunctions or require services to be taken offline while corrective responses are developed. |
27
| | Despite our implementation of network security measures, our servers are vulnerable to computer viruses, worms, hacking, physical and electronic break-ins, router disruption, sabotage or espionage, and other disruptions from unauthorized access and tampering, as well as coordinated denial-of-service attacks. We may not be in a position to promptly address attacks or to implement adequate preventative measures if we are unable to immediately detect such attacks. Such events could result in large expenditures to investigate or remediate, to recover data, to repair or replace networks or information systems, including changes to security measures, to deploy additional personnel, to defend litigation or to protect against similar future events, and may cause damage to our reputation or loss of revenue. We distribute servers among data centers around the world to create redundancies; however, we do not have multiple site capacity for all of our services and some of our systems are not fully redundant in the event of delays or disruptions to service. As not all of our systems are fully redundant, some data or systems may not be fully recoverable after such events. |
| | We rely on third-party providers for our principal Internet connections and co-location of a significant portion of our data servers, as well as for our payment processing capabilities and key components or features of our search, e-mail and VOIP services, news, stock quote and other content delivery, chat services, mapping, streaming, geo-targeting, music, games, and other services. We have little or no control over these third-party providers. Any disruption of the services they provide us or any failure of these third-party providers to handle higher volumes of use could, in turn, cause delays or disruptions in our services and loss of revenue. In addition, if our agreements with these third-party providers are terminated for any reason, we might not have a readily available alternative. |
Prolonged delays or disruptions to our service could result in a loss of users, damage to our brands, legal costs or liability, and harm to our operating results.
If we or our third-party service provider fail to prevent click fraud or choose to manage traffic quality in a way that advertisers find unsatisfactory, our profitability may decline.
A portion of our display and search revenue comes from advertisers that pay for advertising on a price-per-click basis, meaning that the advertisers pay a fee every time a user clicks on their advertising. This pricing model can be vulnerable to so-called click fraud, which occurs when clicks are submitted on ads by a user who is motivated by reasons other than genuine interest in the subject of the ad. On Yahoo! Properties and Affiliate sites, we or our third-party service provider may be exposed to the risk of click fraud or other clicks or conversions that advertisers may perceive as undesirable. If fraudulent or other malicious activity is perpetrated by others and we or our third-party service provider are unable to detect and prevent it, or choose to manage traffic quality in a way that advertisers find unsatisfactory, the affected advertisers may experience or perceive a reduced return on their investment in our advertising programs which could lead the advertisers to become dissatisfied with our advertising programs and they might refuse to pay, demand refunds, or withdraw future business. Undetected click fraud could damage our brands and lead to a loss of advertisers and revenue. Moreover, advertiser dissatisfaction has led to litigation alleging click fraud and other types of traffic quality-related claims and could potentially lead to further litigation against us or our third-party provider or government regulation of advertising. Advertisers may also be issued refunds or credits as a result of such activity. Any increase in costs due to any such litigation, government regulation or legislation, or refunds or credits could negatively impact our profitability.
We are involved in legal proceedings that may result in adverse outcomes.
We are regularly involved in claims, suits, government investigations, and proceedings arising from the ordinary course of our business, including actions with respect to intellectual property claims, privacy, data protection or law enforcement matters, tax matters, labor and employment claims, commercial claims, as well as actions involving content generated by our users, stockholder derivative actions, purported class action lawsuits, and other matters. Such claims, suits, government investigations, and proceedings are inherently uncertain and their results cannot be predicted with certainty. Regardless of the outcome, such legal proceedings can have an adverse impact on us because of legal costs, diversion of management and other personnel, and other factors. In addition,
28
it is possible that a resolution of one or more such proceedings could result in liability, penalties, or sanctions, as well as judgments, consent decrees, or orders preventing us from offering certain features, functionalities, products, or services, or requiring a change in our business practices, products or technologies, which could in the future materially and adversely affect our business, operating results, and financial condition. See Note 12Commitments and Contingencies in the Notes to the consolidated financial statements.
Fluctuations in foreign currency exchange rates affect our operating results in U.S. dollar terms.
A portion of our revenue comes from international operations. Revenue generated and expenses incurred by our international subsidiaries and equity method investees are often denominated in the currencies of the local countries. As a result, our consolidated U.S. dollar financial statements are subject to fluctuations due to changes in exchange rates as the financial results of our international subsidiaries and equity method investees are translated from local currencies into U.S. dollars. In addition, our financial results are subject to changes in exchange rates that impact the settlement of transactions in non-local currencies.
We use derivative instruments, such as foreign currency forward contracts, to partially offset certain exposures to fluctuations in foreign currency exchange rates. The use of such instruments may not offset any or more than a portion of the adverse financial effects of unfavorable movements in foreign currency exchange rates over the limited time the instruments are in place.
We may be required to record a significant charge to earnings if our goodwill, amortizable intangible assets, investments in equity interests, including investments held by our equity method investees, or other investments become impaired.
We are required under generally accepted accounting principles to test goodwill for impairment at least annually and to review our amortizable intangible assets and investments in equity interests, including investments held by our equity method investees, for impairment when events or changes in circumstance indicate the carrying value may not be recoverable. Factors that could lead to impairment of goodwill and amortizable intangible assets include significant adverse changes in the business climate (affecting our company as a whole or affecting any particular segment) and declines in the financial condition of our business. Factors that could lead to impairment of investments in equity interests include a prolonged period of decline in the stock price or operating performance of, or an announcement of adverse changes or events by, the companies in which we invested or the investments held by those companies. Factors that could lead to an impairment of U.S. government securities, which constitute a significant portion of our assets, include any downgrade of U.S. government debt or concern about the creditworthiness of the U.S. government. We have recorded and may be required in the future to record additional charges to earnings if our goodwill, amortizable intangible assets, investments in equity interests, including investments held by our equity investees, or other investments become impaired. Any such charge would adversely impact our financial results.
We may have exposure to additional tax liabilities which could negatively impact our income tax provision, net income, and cash flow.
We are subject to income taxes and other taxes in both the U.S. and the foreign jurisdictions in which we currently operate or have historically operated. The determination of our worldwide provision for income taxes and current and deferred tax assets and liabilities requires judgment and estimation. In the ordinary course of our business, there are many transactions and calculations where the ultimate tax determination is uncertain. We earn a significant amount of our operating income from outside the U.S., and any repatriation of funds currently held in foreign jurisdictions may result in higher effective tax rates for us. In the past there have been proposals to change U.S. tax laws that could significantly impact how U.S. multinational corporations are taxed on foreign earnings. We cannot predict the form or timing of potential legislative changes, but any newly enacted tax law could have a material adverse impact on our tax expense and cash flow. We are subject to regular review and audit by both domestic and foreign tax authorities as well as subject to the prospective and retrospective effects
29
of changing tax regulations and legislation. Although we believe our tax estimates are reasonable, the ultimate tax outcome may materially differ from the tax amounts recorded in our consolidated financial statements and may materially affect our income tax provision, net income, or cash flows in the period or periods for which such determination and settlement is made.
Our stock price has been volatile historically and may continue to be volatile regardless of our operating performance.
The trading price of our common stock has been and may continue to be subject to broad fluctuations. During the year ended December 31, 2011, the closing sale price of our common stock on the NASDAQ Global Select Market ranged from $11.09 to $18.65 per share and the closing sale price on February 17, 2012 was $15.01 per share. Our stock price may fluctuate in response to a number of events and factors, such as variations in quarterly operating results, announcements and implementations of technological innovations or new services by us or our competitors; changes in financial estimates and recommendations by securities analysts; the operating and stock price performance of, or other developments involving, other companies that investors may deem comparable to us; the current and anticipated future operating performance of companies in which we have an equity investment, including Yahoo Japan Corporation (Yahoo Japan) and Alibaba Group; and news reports or rumors relating to us, companies in which we have an equity investment, trends in our markets, or general economic conditions.
In addition, the stock market in general, and the market prices for Internet-related companies in particular, have experienced volatility that often has been unrelated to the operating performance of such companies. These broad market and industry fluctuations may adversely affect the price of our stock, regardless of our operating performance. Volatility or a lack of positive performance in our stock price may adversely affect our ability to retain key employees, all of whom have been granted stock options or other stock-based awards. A sustained decline in our stock price and market capitalization could lead to an impairment charge to our long-lived assets.
Delaware statutes and certain provisions in our charter documents could make it more difficult for a third-party to acquire us.
Our Board of Directors has the authority to issue up to 10 million shares of Preferred Stock and to determine the price, rights, preferences, privileges and restrictions, including voting rights, of those shares without any further vote or action by the stockholders. The rights of the holders of our common stock may be subject to, and may be adversely affected by, the rights of the holders of any Preferred Stock that may be issued in the future. The issuance of Preferred Stock may have the effect of delaying, deterring or preventing a change in control of Yahoo! without further action by the stockholders and may adversely affect the voting and other rights of the holders of our common stock.
Some provisions of our charter documents, including provisions eliminating the ability of stockholders to take action by written consent and limiting the ability of stockholders to raise matters at a meeting of stockholders without giving advance notice, may have the effect of delaying or preventing changes in control or changes in our management, which could have an adverse effect on the market price of our stock. In addition, our charter documents do not permit cumulative voting, which may make it more difficult for a third-party to gain control of our Board of Directors. Further, we are subject to the anti-takeover provisions of Section 203 of the Delaware General Corporation Law, which will prohibit us from engaging in a business combination with an interested stockholder for a period of three years after the date of the transaction in which the person became an interested stockholder, even if such combination is favored by a majority of stockholders, unless the business combination is approved in a prescribed manner. The application of Section 203 also could have the effect of delaying or preventing a change in control of us.
30
| Item 1B. | Unresolved Staff Comments |
None.
| Item 2. | Properties |
Our headquarters is located in Sunnyvale, California and consists of owned and leased space aggregating approximately 1.4 million square feet. We also lease office space in Argentina, Australia, Belgium, Brazil, Canada, China, Egypt, France, Germany, Hong Kong, Hungary, India, Indonesia, Ireland, Israel, Italy, Japan, Jordan, Malaysia, Mexico, Morocco, New Zealand, Norway, the Philippines, Singapore, South Korea, Spain, Switzerland, Taiwan, the United Arab Emirates, the United Kingdom, and Vietnam. In the United States, we lease offices in various locations, including Atlanta, Boston, Champaign, Chicago, Dallas, Denver, Detroit, Hillsboro, the Los Angeles Area, Miami, New York, Omaha, Orlando, the San Diego Area, the San Francisco Bay Area, and Washington, D.C. Our data centers are operated in locations in the United States, Brazil, Europe, and Asia.
We believe that our existing facilities are adequate to meet current requirements, and that suitable additional or substitute space will be available as needed to accommodate any further physical expansion of operations and for any additional sales offices.
| Item 3. | Legal Proceedings |
For a description of our material legal proceedings, see Note 12Commitments and Contingencies in the Notes to the consolidated financial statements, which is incorporated herein by reference.
| Item 4. | Mine Safety Disclosures |
Not applicable.
31
| Item 5. | Market for Registrants Common Equity, Related Stockholder Matters and Issuer Purchases of Equity Securities |
Market Information for Common Stock
Yahoo! Inc. common stock is quoted on the NASDAQ Global Select Market under the symbol YHOO. The following table sets forth the range of high and low per share sales prices as reported for each period indicated:
| 2010 | 2011 | |||||||||||||||
| High | Low | High | Low | |||||||||||||
| First quarter |
$ | 17.30 | $ | 14.48 | $ | 17.84 | $ | 15.41 | ||||||||
| Second quarter |
$ | 19.12 | $ | 13.79 | $ | 18.84 | $ | 14.50 | ||||||||
| Third quarter |
$ | 15.60 | $ | 12.94 | $ | 15.95 | $ | 11.09 | ||||||||
| Fourth quarter |
$ | 17.60 | $ | 14.13 | $ | 16.79 | $ | 13.37 | ||||||||
Stockholders
We had 10,545 stockholders of record as of February 17, 2012.
Dividends
We have not declared or paid any cash dividends on our common stock. We presently do not have plans to pay any cash dividends in the near future.
Issuer Repurchases of Equity Securities
Share repurchase activity during the three months ended December 31, 2011 was as follows:
| Period |
Total Number of Shares Purchased(*) |
Average Price Paid per Share |
Total Number of Shares Purchased as Part of a Publicly Announced Program |
Approximate Dollar Value of Shares that May Yet be Purchased Under the Program (in 000s)(*) |
||||||||||||
| October 1October 31, 2011 |
| $ | | | $ | 1,021,583 | ||||||||||
| November 1November 30, 2011 |
12,796,763 | $ | 15.17 | 12,796,763 | $ | 827,519 | ||||||||||
| December 1December 31, 2011 |
14,679,979 | $ | 15.13 | 14,679,979 | $ | 605,347 | ||||||||||
|
|
|
|
|
|||||||||||||
| Total |
27,476,742 | $ | 15.15 | 27,476,742 | ||||||||||||
|
|
|
|
|
|||||||||||||
| (*) | The share repurchases in the three months ended December 31, 2011 were made under our stock repurchase program announced in June 2010, which authorizes the repurchase of up to $3 billion of our outstanding shares of common stock from time to time. This program, according to its terms, will expire in June 2013. Repurchases may take place in the open market or in privately negotiated transactions, including derivative transactions, and may be made under a Rule 10b5-1 plan. |
.
32
Performance Graph
This performance graph shall not be deemed filed for purposes of Section 18 of the Securities Exchange Act of 1934, as amended (the Exchange Act), or otherwise subject to the liabilities under that section and shall not be deemed to be incorporated by reference into any filing of Yahoo! Inc. under the Securities Act of 1933, as amended, or the Exchange Act.
The following graph compares, for the five-year period ended December 31, 2011, the cumulative total stockholder return for Yahoo!s common stock, the NASDAQ 100 Index, the Standard & Poors North American Technology-Internet Index (the SPGIINTR), and the Standard & Poors 500 Stock Index (the S&P 500 Index). Measurement points are the last trading day of each of Yahoo!s fiscal years ended December 31, 2007, December 31, 2008, December 31, 2009, December 31, 2010, and December 31, 2011. The graph assumes that $100 was invested at the market close on December 29, 2006 in the common stock of Yahoo!, the NASDAQ 100 Index, the SPGIINTR, and the S&P 500 Index and assumes reinvestment of any dividends. The stock price performance on the following graph is not necessarily indicative of future stock price performance.
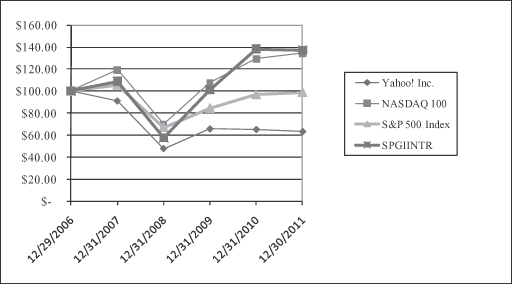
33
| Item 6. | Selected Financial Data |
The following selected consolidated financial data should be read in conjunction with the consolidated financial statements and notes thereto and Managements Discussion and Analysis of Financial Condition and Results of Operations appearing elsewhere in this Annual Report on Form 10-K. The consolidated statements of income data and the consolidated balance sheets data for the years ended, and as of, December 31, 2007, 2008, 2009, 2010, and 2011 are derived from our audited consolidated financial statements.
Consolidated Statements of Income Data:
| Years Ended December 31, | ||||||||||||||||||||
| 2007 | 2008(1) | 2009(2) | 2010(3) | 2011(4) | ||||||||||||||||
| (In thousands, except per share amounts) | ||||||||||||||||||||
| Revenue |
$ | 6,969,274 | $ | 7,208,502 | $ | 6,460,315 | $ | 6,324,651 | $ | 4,984,199 | ||||||||||
| Income from operations |
$ | 695,413 | $ | 12,963 | $ | 386,692 | $ | 772,524 | $ | 800,341 | ||||||||||
| Net income attributable to Yahoo! Inc. |
$ | 639,155 | $ | 418,921 | $ | 597,992 | $ | 1,231,663 | $ | 1,048,827 | ||||||||||
|
|
|
|
|
|
|
|
|
|
|
|||||||||||
| Net income attributable to Yahoo! Inc. common stockholders per sharebasic |
$ | 0.48 | $ | 0.31 | $ | 0.43 | $ | 0.91 | $ | 0.82 | ||||||||||
|
|
|
|
|
|
|
|
|
|
|
|||||||||||
| Net income attributable to Yahoo! Inc. common stockholders per sharediluted |
$ | 0.47 | $ | 0.29 | $ | 0.42 | $ | 0.90 | $ | 0.82 | ||||||||||
|
|
|
|
|
|
|
|
|
|
|
|||||||||||
| Shares used in per share calculationbasic |
1,338,987 | 1,369,476 | 1,397,652 | 1,354,118 | 1,274,240 | |||||||||||||||
|
|
|
|
|
|
|
|
|
|
|
|||||||||||
| Shares used in per share calculationdiluted |
1,366,264 | 1,391,230 | 1,415,658 | 1,364,612 | 1,282,282 | |||||||||||||||
|
|
|
|
|
|
|
|
|
|
|
|||||||||||
| (1) | Our net income attributable to Yahoo! Inc. for the year ended December 31, 2008 included a non-cash gain of $401 million, net of tax, related to Alibaba Groups initial public offering (IPO) of Alibaba.com Limited (Alibaba.com), the business to business e-commerce subsidiary of Alibaba Group, and a non-cash loss of $30 million, net of tax, related to the impairment of our direct investment in Alibaba.com. In addition, in the year ended December 31, 2008, we recorded a goodwill impairment charge of $488 million related to our European reporting unit and net restructuring charges of $107 million related to our strategic workforce realignment and cost reduction initiatives, and a tax benefit for these two items of $42 million. In the aggregate, these items had a net negative impact of $182 million on net income attributable to Yahoo! Inc., or $0.13 per both basic and diluted share, for the year ended December 31, 2008. |
| (2) | Our net income attributable to Yahoo! Inc. for the year ended December 31, 2009 included a pre-tax gain of $67 million in connection with the sale of our Gmarket shares and a gain on the sale of our direct investment in Alibaba.com of $98 million. In addition, in the year ended December 31, 2009, we recorded net restructuring charges of $127 million related to our cost reduction initiatives. In the aggregate, these items had a net positive impact of $18 million on net income attributable to Yahoo! Inc., or $0.01 per both basic and diluted share for the year ended December 31, 2009. |
| (3) | Our revenue declined in 2010 due to the Search Agreement with Microsoft, which beginning during the fourth quarter of 2010 required a change in revenue presentation and a sharing of search revenue with Microsoft in transitioned markets. Our net income attributable to Yahoo! Inc. for the year ended December 31, 2010 included a pre-tax gain of $66 million in connection with the sale of Zimbra, Inc. and a pre-tax gain on the sale of HotJobs of $186 million. In addition, in the year ended December 31, 2010, we recorded net restructuring charges of $58 million related to our cost reduction initiatives. In the aggregate, these items had a net positive impact of $204 million on net income attributable to Yahoo! Inc., or $0.15 per both basic and diluted share, for the year ended December 31, 2010. In addition, in the year ended December 31, 2010, we recorded $43 million pre-tax for the reimbursement of transition costs incurred in 2009 related to the Search Agreement. See Note 16Search Agreement with Microsoft Corporation in the Notes to the consolidated financial statements for additional information. Our income tax provision was also reduced by the effect of certain tax benefits as discussed in Note 9Income Taxes in the Notes to the consolidated financial statements. |
34
| (4) | Our revenue declined in 2011 due to the Search Agreement with Microsoft, which beginning during the fourth quarter of 2010 required a change in revenue presentation and a sharing of search revenue with Microsoft in transitioned markets. Our net income attributable to Yahoo! Inc. for the year ended December 31, 2011 included a non-cash gain of $25 million, net of tax related to the dilution of our ownership interest in Alibaba Group and a non-cash loss of $33 million related to impairments of assets held by Yahoo Japan. In addition, in the year ended December 31, 2011, we recorded net restructuring charges of $24 million related to our cost reduction initiatives. In the aggregate, these items had a net negative impact of $24 million on net income attributable to Yahoo! Inc., or $0.02 per both basic and diluted share, for the year ended December 31, 2011. |
Consolidated Balance Sheets Data:
| December 31, | ||||||||||||||||||||
|
2007(1) |
2008(2) | 2009 | 2010 | 2011 | ||||||||||||||||
| (In thousands) | ||||||||||||||||||||
| Cash and cash equivalents |
$ | 1,513,930 | $ | 2,292,296 | $ | 1,275,430 | $ | 1,526,427 | $ | 1,562,390 | ||||||||||
| Marketable debt securities |
$ | 849,542 | $ | 1,229,677 | $ | 3,242,574 | $ | 2,102,255 | $ | 967,527 | ||||||||||
| Working capital |
$ | 942,652 | $ | 3,040,483 | $ | 2,877,044 | $ | 2,719,676 | $ | 2,245,175 | ||||||||||
| Total assets |
$ | 12,229,554 | $ | 13,689,848 | $ | 14,936,030 | $ | 14,928,104 | $ | 14,782,786 | ||||||||||
| Long-term liabilities |
$ | 384,208 | $ | 715,872 | $ | 699,666 | $ | 705,822 | $ | 994,078 | ||||||||||
| Total Yahoo! Inc. stockholders equity |
$ | 9,538,209 | $ | 11,250,942 | $ | 12,493,320 | $ | 12,558,129 | $ | 12,541,067 | ||||||||||
| (1) | As of December 31, 2007, our $750 million of outstanding zero coupon senior convertible notes were classified as short-term debt and were reflected in working capital. |
| (2) | During the year ended December 31, 2008, our $750 million of outstanding zero coupon senior convertible notes were converted into 36.6 million shares of Yahoo! common stock. During the year ended December 31, 2008, we received a $350 million, one-time payment from AT&T Inc., of which $129 million was recorded in short-term deferred revenue and $221 million was recorded in long-term deferred revenue. |
35
| Item 7. | Managements Discussion and Analysis of Financial Condition and Results of Operations |
Forward-Looking Statements
In addition to current and historical information, this Annual Report on Form 10-K contains forward-looking statements within the meaning of the Private Securities Litigation Reform Act of 1995. These statements relate to our future operations, prospects, potential products, services, developments, and business strategies. These statements can, in some cases, be identified by the use of terms such as may, will, should, could, would, intend, expect, plan, anticipate, believe, estimate, predict, project, potential, or continue, the negative of such terms, or other comparable terminology. This Annual Report on Form 10-K includes, among others, forward-looking statements regarding our:
| | expectations about revenue, including display, search, and other revenue; |
| | expectations about growth in users; |
| | expectations about cost of revenue and operating expenses; |
| | expectations about the amount of unrecognized tax benefits and the adequacy of our existing tax reserves; |
| | anticipated capital expenditures; |
| | expectations about the implementation and the financial and operational impacts of our Search Agreement with Microsoft; |
| | impact of recent acquisitions on our business and evaluation of, and expectations for, possible acquisitions of, or investments in, businesses, products, and technologies; and |
| | expectations about positive cash flow generation and existing cash, cash equivalents, and investments being sufficient to meet normal operating requirements. |
These statements involve certain known and unknown risks and uncertainties that could cause our actual results to differ materially from those expressed or implied in our forward-looking statements. Such risks and uncertainties include, among others, those listed in Part 1, Item 1A Risk Factors of this Annual Report on Form 10-K. We do not intend, and undertake no obligation, to update any of our forward-looking statements after the date of this Annual Report on Form 10-K to reflect actual results or future events or circumstances.
Overview
Yahoo! Inc., together with its consolidated subsidiaries (Yahoo!, the Company, we, or us), is a premier digital media company. Through our proprietary technology and insights, we deliver personalized digital content and experiences, across devices and around the globe, to vast audiences. We provide engaging and innovative canvases for advertisers to connect with their target audiences using our unique blend of Science + Art + Scale. We provide online properties and services (Yahoo! Properties) to users as well as a range of marketing services designed to reach and connect with those users on Yahoo! and through a distribution network of third-party entities (Affiliates). These Affiliates integrate our advertising offerings into their Websites or other offerings (those Websites and other offerings, Affiliate sites).
Our offerings to users on Yahoo! Properties currently fall into three categories: Communications and Communities; Search and Marketplaces; and Media. The majority of our offerings are available in more than 45 languages and in 60 countries, regions, and territories. We have properties tailored to users in specific international markets including Yahoo! Homepage and social networking Websites such as Meme and Wretch. We manage and measure our business geographically, principally in the Americas, EMEA (Europe, Middle East, and Africa) and Asia Pacific.
36
Strategic Review
During 2011, our Board of Directors initiated a comprehensive strategic review to assess alternatives to return the Company to increased growth and innovation. As part of this review, we have pursued a wide range of discussions with potential partners. We are in discussions regarding the possibility of restructuring our holdings in Alibaba Group and Yahoo Japan. While we continue to pursue these discussions, there is no assurance that any transaction will be achieved.
Search Agreement with Microsoft Corporation
On December 4, 2009, we entered into a Search and Advertising Services and Sales Agreement (the Search Agreement) with Microsoft Corporation (Microsoft), which provides for Microsoft to be the exclusive algorithmic and paid search services provider on Yahoo! Properties and non-exclusive provider of such services on Affiliate sites. We also entered into a License Agreement with Microsoft pursuant to which Microsoft acquired an exclusive 10-year license to our core search technology that it will be able to integrate into its existing Web search platforms.
During the first five years of the Search Agreement, in transitioned markets we are entitled to receive 88 percent of the revenue generated from Microsofts services on Yahoo! Properties. We are also entitled to receive 88 percent of the revenue generated from Microsofts services on Affiliate sites after the Affiliates share of revenue. In the transitioned markets, for search revenue generated from Microsofts services on Yahoo! Properties and Affiliate sites, we report as revenue the 88 percent revenue share, as we are not the primary obligor in the arrangement with the advertisers and publishers.
Under the Search Agreement, for each market, Microsoft generally guarantees Yahoo!s revenue per search (RPS Guarantee) on Yahoo! Properties only for 18 months after the transition of paid search services to Microsofts platform in that market. In the fourth quarter of 2011, Microsoft agreed to extend the RPS Guarantee in the U.S. and Canada through March 2013. The RPS Guarantee is calculated based on the difference in revenue per search between the pre-transition and post-transition periods. We record the RPS Guarantee as search revenue in the quarter the amount becomes fixed, which is typically the quarter in which the associated shortfall in revenue per search occurred.
Under the Search Agreement, Microsoft agreed to reimburse us for certain transition costs up to an aggregate total of $150 million during the first three years of the Search Agreement. During the third quarter of 2011, our cumulative transition costs exceeded Microsofts $150 million reimbursement cap under the Search Agreement. Transition costs we incur in excess of the $150 million reimbursement cap are not subject to reimbursement. Our results for the year ended December 31, 2011 reflect transition cost reimbursements from Microsoft under the Search Agreement of $26 million. During the year ended December 31, 2010, we recorded transition cost reimbursements from Microsoft under the Search Agreement of $81 million. During the year ended December 31, 2010, we also recorded reimbursements of $43 million for transition costs incurred in 2009. The 2009 transition cost reimbursements were recorded in the first quarter of 2010 after regulatory clearance in the U.S. and Europe was received, implementation of the Search Agreement commenced, and Microsoft became obligated to make such payments.
From February 23, 2010 until the applicable services are fully transitioned to Microsoft in all markets, Microsoft will also reimburse us for the costs of operating algorithmic and paid search services subject to specified exclusions and limitations. Our results reflect search operating cost reimbursements from Microsoft under the Search Agreement of $212 million for the year ended December 31, 2011 and $268 million for the same period of 2010. The global transition of the algorithmic and paid search platforms to Microsofts platform and the migration of the paid search advertisers and publishers to Microsofts platform are being done on a market by market basis. Search operating cost reimbursements are expected to decline as we fully transition all markets and, in the long term, the underlying expenses are not expected to be incurred under our cost structure.
37
We completed the transition of our algorithmic and paid search platforms to the Microsoft platform in the U.S. and Canada in the fourth quarter of 2010. In 2011, we completed the transition of algorithmic search in all other markets and the transition of paid search in India. The market-by-market transition of our paid search platform to Microsofts platform and the migration of paid search advertisers and publishers to Microsofts platform are expected to continue through the first half of 2013.
In the year ended December 31, 2010, $17 million was recorded for reimbursements for employee retention costs incurred in 2010, and $5 million for employee retention costs incurred in 2009. These employee retention cost reimbursements are separate from and in addition to the $150 million of transition cost reimbursement payments and the search operating cost reimbursements.
We record receivables for the reimbursements as costs are incurred and apply them against the operating expense categories in which the costs were incurred. Of the total amounts incurred during the year ended December 31, 2010, the total reimbursements not yet received from Microsoft of $64 million were classified as part of prepaid expenses and other current assets on our consolidated balance sheets as of December 31, 2010. Of the total amounts incurred during the year ended December 31, 2011, total reimbursements of $16 million not yet received from Microsoft were classified as part of prepaid expenses and other current assets on our consolidated balance sheets as of December 31, 2011. We received $6 million of the unpaid reimbursements during the first quarter of 2012.
See Note 16Search Agreement with Microsoft Corporation in the Notes to the consolidated financial statements for additional information.
Revenue Sources
Display and Search Revenue. Display and search revenue is generated from several offerings including the display of graphical advertisements (display advertising) and the display of text-based links to advertisers Websites (search advertising).
We recognize revenue from display advertising on Yahoo! Properties and Affiliate sites as impressions are delivered. Impressions are delivered when an advertisement appears in pages viewed by users. Arrangements for these services generally have terms of up to one year, and in some cases the terms may be up to three years. For display advertising on Affiliate sites, we pay Affiliates for the revenue generated from the display of these advertisements on the Affiliate sites or other offerings. Traffic acquisition costs (TAC) are payments made to third-party entities that have integrated our advertising offerings into their Websites or other offerings and payments made to companies that direct consumer and business traffic to Yahoo! Properties. The display revenue derived from these arrangements that involve traffic supplied by Affiliates is reported gross of the TAC paid to Affiliates as we are the primary obligor to the advertisers who are the customers of the display advertising service.
We recognize revenue from search advertising on Yahoo! Properties and Affiliate sites. Search revenue is recognized based on click-throughs. A click-through occurs when a user clicks on an advertisers search result listing. Under the Search Agreement with Microsoft described above, in the transitioned markets, we report as revenue the 88 percent revenue share as we are not the primary obligor in the arrangement with the advertisers. See Note 16Search Agreement with Microsoft Corporation in the Notes to the consolidated financial statements for a description of our Search Agreement with Microsoft. In the non-transitioned markets, we pay Affiliates TAC for the revenue generated from the search advertisements on the Affiliates Websites. The revenue derived from these arrangements is reported gross of the TAC paid to Affiliates, as we continue to be the primary obligor to the advertisers. We also generate search revenue from a revenue sharing arrangement with Yahoo Japan for search technology and services.
Other Revenue. Other revenue includes listings-based services revenue, transaction revenue, and fees revenue. Listings-based services revenue is generated from a variety of consumer and business listings-based services, including classified advertising such as Yahoo! Autos and other services. We recognize listings-based services
38
revenue when the services are performed. Transaction revenue is generated from facilitating commercial transactions through Yahoo! Properties, principally from Yahoo! Small Business, Yahoo! Travel, and Yahoo! Shopping. We recognize transaction revenue when there is evidence that qualifying transactions have occurred (for example, when travel arrangements are booked through Yahoo! Travel). Fees revenue consists of revenue generated from a variety of consumer and business fee-based services, including Internet broadband services, royalties received from joint venture partners, and premium mail, as well as services for small businesses. We recognize fees revenue when the services are performed.
2011 Highlights
| Years Ended December 31, | Dollar Change |
|||||||||||
| Operating Highlights |
2010 | 2011 | ||||||||||
| (In thousands) | ||||||||||||
| Revenue |
$ | 6,324,651 | $ | 4,984,199 | $ | (1,340,452 | ) | |||||
| Income from operations |
$ | 772,524 | $ | 800,341 | $ | 27,817 | ||||||
| Years Ended December 31, | Dollar Change |
|||||||||||
| Cash Flow Highlights |
2010 | 2011 | ||||||||||
| (In thousands) | ||||||||||||
| Net cash provided by operating activities |
$ | 1,240,190 | $ | 1,323,806 | $ | 83,616 | ||||||
| Net cash provided by investing activities |
$ | 509,915 | $ | 202,362 | $ | (307,553 | ) | |||||
| Net cash used in financing activities |
$ | (1,501,706 | ) | $ | (1,455,958 | ) | $ | 45,748 | ||||
Our revenue decrease of 21 percent for the year ended December 31, 2011 compared to 2010 can be attributed to a decrease in our search revenue. The decrease in search revenue was primarily due to the required change in revenue presentation which began in the fourth quarter of 2010, the associated revenue share with Microsoft for the Americas region, and the loss of an Affiliate in the Asia Pacific region. The increase in income from operations of $28 million for the year ended December 31, 2011 reflects a decrease in gross profit offset by a decrease in operating expenses of $243 million for the year ended December 31, 2011 compared to 2010.
Cash provided by operating activities is a measure of the cash productivity of our business model. Our operating activities in 2011 generated adequate cash to meet our operating needs. Cash provided by investing activities in the year ended December 31, 2011 included net proceeds from sales, maturities, and purchases of marketable debt securities of $1,117 million offset by $324 million used for acquisitions, net of cash acquired and net capital expenditures of $593 million. Cash used in financing activities included $1,619 million used in the direct repurchase of common stock and $45 million used for tax withholding payments related to the net share settlements of restricted stock units, offset by $156 million in proceeds from employee option exercises and employee stock purchases.
Summary
In the following Managements Discussion and Analysis, we provide information regarding to the following areas of our financial results:
| | Results of Operations; |
| | Business Segment Results; |
| | Transactions; |
| | Liquidity and Capital Resources; |
| | Critical Accounting Policies and Estimates; and |
| | Recent Accounting Pronouncements. |
39
Results of Operations
Revenue. Revenue by groups of similar services was as follows (dollars in thousands):
| Years Ended December 31, | 2009-2010 |
2010-2011 |
||||||||||||||||||||||||||
| 2009 | (*) | 2010 | (*) | 2011 | (*) | |||||||||||||||||||||||
| Display |
$ | 1,866,984 | 29 | % | $ | 2,154,886 | 34 | % | $ | 2,160,309 | 43 | % | 15% | 0% | ||||||||||||||
| Search |
3,396,396 | 53 | % | 3,161,589 | 50 | % | 1,853,110 | 37 | % | (7)% | (41)% | |||||||||||||||||
| Other |
1,196,935 | 18 | % | 1,008,176 | 16 | % | 970,780 | 20 | % | (16)% | (4)% | |||||||||||||||||
|
|
|
|
|
|
|
|
|
|
|
|
|
|||||||||||||||||
| Total revenue |
$ | 6,460,315 | 100 | % | $ | 6,324,651 | 100 | % | $ | 4,984,199 | 100 | % | (2)% | (21)% | ||||||||||||||
|
|
|
|
|
|
|
|
|
|
|
|
|
|||||||||||||||||
| (*) | Percent of total revenue. |
We currently generate revenue principally from display advertising on Yahoo! Properties and from search advertising on Yahoo! Properties and Affiliate sites.
We earn revenue from guaranteed or premium display advertising by delivering advertisements according to advertisers specified criteria, such as number of impressions during a fixed period on a specific placement. Also, we earn revenue from non-guaranteed or non-premium display advertising by delivering advertisements for advertisers purchasing inventory on a preemptible basis, which means that the advertisement may or may not appear, inventory is not reserved and position placement is not assured. Generally, we make our non-guaranteed display inventory available through our Right Media Exchange.
To assist us in evaluating display advertising and search advertising, beginning in the fourth quarter of 2010 we began reporting the number of Web pages viewed by users (Page Views) separately for display and search. Search Page Views is defined as the number of Web pages viewed by users on Yahoo! Properties and Affiliate sites resulting from search queries and revenue per Search Page View is defined as search revenue divided by our Search Page Views. Display Page Views is defined as the total number of Page Views on Yahoo! Properties less the number of Search Page Views on Yahoo! Properties, and revenue per Display Page View is defined as display revenue divided by our Display Page Views.
We periodically review and refine our methodology for monitoring, gathering, and counting Page Views on Yahoo! Properties. Based on this process, from time to time, we update our methodology to exclude from the count of Page Views interactions with our servers that we determine or believe are not the result of user visits to Yahoo! Properties.
Display Revenue. Display revenue for the year ended December 31, 2011 remained flat compared to 2010, due to growth in guaranteed and non-guaranteed advertising in the EMEA and Asia Pacific segments and increases in non-guaranteed advertising in the Americas offset by declines in Americas for guaranteed advertising. Display revenue for the year ended December 31, 2010 increased by 15 percent, compared to 2009. Increased advertising spending in display and a shift towards higher-yielding display inventory resulted in increased display revenue.
For the year ended December 31, 2011, Display Page Views decreased 2 percent and revenue per Display Page View increased 6 percent, compared to 2010. For the year ended December 31, 2010, Display Page Views decreased 2 percent and revenue per Display Page View increased 20 percent, compared to 2009 due to the increase in revenue as discussed above.
We expect display revenue to remain flat for the first quarter of 2012, compared to the first quarter of 2011, due to decreases in Americas display revenue primarily from reduced guaranteed display advertising offset by increases in display revenue in the EMEA and Asia Pacific segments.
Search Revenue. Search revenue for the year ended December 31, 2011 decreased by 41 percent, compared to 2010. Search revenue decreased primarily due to the required change in revenue presentation which began in the fourth quarter of 2010, the associated revenue share with Microsoft for the U.S. and Canada, and the loss of an Affiliate in the Asia Pacific segment. Search revenue for the year ended December 31, 2010 decreased by
40
7 percent, compared to 2009. Search revenue decreased primarily due to the required change in revenue presentation in the fourth quarter of 2010 to reflect the revenue share with Microsoft for transitioned markets and the impact of discontinuing our paid inclusion search product in the fourth quarter of 2009 as part of our advertising quality initiatives. The decreases for the year ended December 31, 2010 were offset, in part, by the impact of foreign exchange fluctuations in the Asia Pacific segment and a new Affiliate in the Asia Pacific segment added in the fourth quarter of 2009.
For the year ended December 31, 2011, Search Page Views decreased 1 percent and revenue per Search Page View decreased 41 percent, compared to 2010. The decline in revenue per Search Page View in 2011 compared to 2010 was due to the decline in search revenue as discussed above. For the year ended December 31, 2010, Search Page Views decreased 1 percent and revenue per Search Page View decreased 6 percent, compared to 2009. The decline in revenue per Search Page View in 2010 compared to 2009 was due to the decline in search revenue as discussed above.
We expect search revenue for the first quarter of 2012 to remain flat compared to the first quarter of 2011 due to increases in Americas search revenue offset by decreases in EMEA search revenue primarily from decreased Affiliate revenue.
Other Revenue. Other revenue includes listings-based services revenue, transaction revenue and fees revenue. Other revenue for the year ended December 31, 2011 decreased by 4 percent, compared to 2010. The decrease can be attributable to changes in certain of our broadband access partnerships, our shift from a fee-paying user structure to other fee structures, and to the divestiture of certain business lines during the year ended December 31, 2010. In addition, revenue from other premium services declined year-over-year as we continue to outsource various offerings to commercial partners.
Other revenue for the year ended December 31, 2010 decreased by 16 percent, compared to 2009. The decrease can be attributable to changes in certain of our broadband access partnerships, our shift from a fee-paying user structure to other fee structures, and to the divestiture of certain business lines during the year ended December 31, 2010. In addition, revenue from other premium services declined year-over-year as we continue to outsource various offerings to commercial partners.
We expect other revenue to remain flat for the first quarter of 2012, compared to the first quarter of 2011 due to decreases in certain of our broadband access partnerships offset by increases in certain of our royalty revenues.
Costs and Expenses. Operating costs and expenses consist of cost of revenue, sales and marketing, product development, general and administrative, amortization of intangible assets, and restructuring charges, net. Cost of revenue consists of TAC, Internet connection charges, and other expenses associated with the production and usage of Yahoo! Properties, including amortization of acquired intellectual property rights and developed technology.
Operating costs and expenses were as follows (dollars in thousands):
| Years Ended December 31, | 2009-2010 | 2010-2011 | ||||||||||||||||||||||||||||||||||
| Dollar Change |
Percent |
Dollar Change |
Percent |
|||||||||||||||||||||||||||||||||
| 2009 | (1) | 2010 | (1) | 2011 | (1) | |||||||||||||||||||||||||||||||
| Cost of revenue(2) |
$ | 2,871,746 | 44 | % | $ | 2,627,545 | 42 | % | $ | 1,502,650 | 30 | % | $ | (244,201 | ) | (9)% | $ | (1,124,895 | ) | (43)% | ||||||||||||||||
| Sales and marketing |
$ | 1,245,350 | 19 | % | $ | 1,264,491 | 20 | % | $ | 1,122,302 | 23 | % | $ | 19,141 | 2% | $ | (142,189 | ) | (11)% | |||||||||||||||||
| Product development |
$ | 1,210,168 | 19 | % | $ | 1,082,176 | 17 | % | $ | 1,005,090 | 20 | % | $ | (127,992 | ) | (11)% | $ | (77,086 | ) | (7)% | ||||||||||||||||
| General and administrative |
$ | 580,352 | 9 | % | $ | 488,332 | 8 | % | $ | 495,804 | 10 | % | $ | (92,020 | ) | (16)% | $ | 7,472 | 2% | |||||||||||||||||
| Amortization of intangibles(2) |
$ | 39,106 | 1 | % | $ | 31,626 | 1 | % | $ | 33,592 | 1 | % | $ | (7,480 | ) | (19)% | $ | 1,966 | 6% | |||||||||||||||||
| Restructuring charges, net |
$ | 126,901 | 2 | % | $ | 57,957 | 1 | % | $ | 24,420 | 0 | % | $ | (68,944 | ) | (54)% | $ | (33,537 | ) | (58)% | ||||||||||||||||
| (1) | Percent of total revenue. |
41
| (2) | For the years ended December 31, 2009, 2010, and 2011, cost of revenue included amortization expense of $145 million, $96 million, and $84 million, respectively, relating to acquired intellectual property rights and developed technology. |
Stock-based compensation expense was allocated as follows (in thousands):
| Years Ended December 31, | ||||||||||||
| 2009 | 2010 | 2011 | ||||||||||
| Cost of revenue |
$ | 10,759 | $ | 3,275 | $ | 3,489 | ||||||
| Sales and marketing |
141,537 | 71,154 | 65,120 | |||||||||
| Product development |
205,971 | 106,665 | 89,587 | |||||||||
| General and administrative |
79,820 | 42,384 | 45,762 | |||||||||
| Restructuring expense accelerations (reversals), net |
11,062 | (4,211 | ) | 214 | ||||||||
|
|
|
|
|
|
|
|||||||
| Total stock-based compensation expense |
$ | 449,149 | $ | 219,267 | $ | 204,172 | ||||||
|
|
|
|
|
|
|
|||||||
See Note 1The Company and Summary of Significant Accounting Policies and Note 11Employee Benefits in the Notes to the consolidated financial statements, as well as our Critical Accounting Policies and Estimates, for additional information about stock-based compensation expense.
TAC. TAC consist of payments made to third-party entities that have integrated our advertising offerings into their Websites or other offerings and payments made to companies that direct consumer and business traffic to Yahoo! Properties. We enter into agreements of varying duration that involve TAC. There are generally two economic structures of the Affiliate agreements: fixed payments based on a guaranteed minimum amount of traffic delivered, which often carry reciprocal performance guarantees from the Affiliate, or variable payments based on a percentage of our revenue or based on a certain metric, such as number of searches or paid clicks. We expense TAC under two different methods. Agreements with fixed payments are expensed ratably over the term the fixed payment covers, and agreements based on a percentage of revenue, number of searches, or other metrics are expensed based on the volume of the underlying activity or revenue multiplied by the agreed-upon price or rate.
Compensation, Information Technology, Depreciation and Amortization, and Facilities Expenses. Compensation expense consists primarily of salary, bonuses, commissions, and stock-based compensation expense. Information and technology expense includes telecom usage charges and data center operating costs. Depreciation and amortization expense consists primarily of depreciation of server equipment and information technology assets and amortization of developed or acquired technology and intellectual property rights. Facilities expense consists primarily of building maintenance costs, rent expense, and utilities.
The changes in operating costs and expenses for the year ended December 31, 2011 compared to the year ended December 31, 2010 are comprised of the following (in thousands):
| Compensation | Information Technology |
Depreciation and Amortization |
TAC | Facilities | Other | Total | ||||||||||||||||||||||
| Cost of revenue |
$ | (9,782 | ) | $ | 14,451 | $ | (30,332 | ) | $ | (1,133,050 | ) | $ | (632 | ) | $ | 34,450 | $ | (1,124,895 | ) | |||||||||
| Sales and marketing |
(32,501 | ) | (399 | ) | (1,804 | ) | | (5,317 | ) | (102,168 | ) | (142,189 | ) | |||||||||||||||
| Product development |
(71,914 | ) | 72 | 10,560 | | (3,693 | ) | (12,111 | ) | (77,086 | ) | |||||||||||||||||
| General and administrative |
13,361 | (633 | ) | (10,920 | ) | | 17,548 | (11,884 | ) | 7,472 | ||||||||||||||||||
| Amortization of intangibles |
| | 1,966 | | | | 1,966 | |||||||||||||||||||||
| Restructuring charges, net |
| | | | | (33,537 | ) | (33,537 | ) | |||||||||||||||||||
|
|
|
|
|
|
|
|
|
|
|
|
|
|
|
|||||||||||||||
| Total |
$ | (100,836 | ) | $ | 13,491 | $ | (30,530 | ) | $ | (1,133,050 | ) | $ | 7,906 | $ | (125,250 | ) | $ | (1,368,269 | ) | |||||||||
|
|
|
|
|
|
|
|
|
|
|
|
|
|
|
|||||||||||||||
42
The changes in operating costs and expenses for the year ended December 31, 2010 compared to the year ended December 31, 2009 are comprised of the following (in thousands):
| Compensation | Information Technology |
Depreciation and Amortization |
TAC | Facilities | Other | Total | ||||||||||||||||||||||
| Cost of revenue |
$ | (26,404 | ) | $ | (69,357 | ) | $ | (79,220 | ) | $ | (41,403 | ) | $ | 1,780 | $ | (29,597 | ) | $ | (244,201 | ) | ||||||||
| Sales and marketing |
950 | (2,129 | ) | (740 | ) | | (10,519 | ) | 31,579 | 19,141 | ||||||||||||||||||
| Product development |
(142,980 | ) | 12,516 | 6,509 | | (15,376 | ) | 11,339 | (127,992 | ) | ||||||||||||||||||
| General and administrative |
(36,943 | ) | (293 | ) | (1,526 | ) | | 7,628 | (60,886 | ) | (92,020 | ) | ||||||||||||||||
| Amortization of intangibles |
| | (7,480 | ) | | | | (7,480 | ) | |||||||||||||||||||
| Restructuring charges, net |
| | | | | (68,944 | ) | (68,944 | ) | |||||||||||||||||||
|
|
|
|
|
|
|
|
|
|
|
|
|
|
|
|||||||||||||||
| Total |
$ | (205,377 | ) | $ | (59,263 | ) | $ | (82,457 | ) | $ | (41,403 | ) | $ | (16,487 | ) | $ | (116,509 | ) | $ | (521,496 | ) | |||||||
|
|
|
|
|
|
|
|
|
|
|
|
|
|
|
|||||||||||||||
Compensation Expense. Total compensation expense decreased $101 million for the year ended December 31, 2011, compared to 2010. Excluding the impact of Microsoft reimbursements, compensation expense for the year ended December 31, 2011 decreased $150 million compared to 2010, primarily due to decreased stock-based compensation expense and the capitalization of otherwise expensed compensation costs in product development associated with increased efforts in the development of our technology platform and specific products. The decrease in stock-based compensation expense is primarily due to increased cancellations for stock options and increased forfeitures for stock-based awards in the year ended December 31, 2011, compared to 2010. The decline in compensation expense was offset by decreased Microsoft reimbursements of $49 million during the year ended December 31, 2011, compared to 2010. The decrease in Microsoft reimbursements for the year ended December 31, 2011 was due to the transition of paid search to Microsoft platforms.
Total compensation expense decreased $205 million for the year ended December 31, 2010, compared to 2009. Excluding the impact of Microsoft reimbursements, compensation expense decreased $86 million compared to 2009. The decrease was primarily driven by a decrease in stock-based compensation expense and the capitalization of otherwise expensed compensation costs in product development. The decrease in stock-based compensation expense is due to recently granted stock-based compensation awards having a lower grant date fair value than stock-based compensation awards currently vesting. The decline in stock-based compensation was offset by increased salaries and wages from increased average headcount, primarily in the product development and sales and marketing functions. The decline in compensation expense was offset by increased Microsoft reimbursements of $119 million during the year ended December 31, 2010, for which there were no similar reimbursements 2009.
Information Technology Expenses. Information technology expenses increased $13 million for the year ended December 31, 2011, compared to 2010. Excluding the impact of Microsoft reimbursements, information technology expense for the year ended December 31, 2011 increased $9 million compared to 2010, due to increased data center operating costs. Information technology expense was impacted by decreased reimbursements from Microsoft of $4 million for the year ended December 31, 2011, compared to 2010.
Information technology expenses decreased $59 million for the year ended December 31, 2010, compared to 2009. Excluding the impact of Microsoft reimbursements, information technology expense for the year ended December 31, 2010 increased $36 million compared to 2009. The decline for the year ended December 31, 2010 was primarily due to reimbursements recorded from Microsoft for information technology costs, for which there were no similar reimbursements in 2009. For the year ended December 31, 2010, the net impact of the reimbursements by Microsoft for our cost of running search was a reduction in information technology expense of $95 million compared to 2009.
Depreciation and Amortization Expenses. Depreciation and amortization expenses decreased $31 million for the year ended December 31, 2011, compared to 2010. Excluding the impact of Microsoft reimbursements,
43
depreciation and amortization expense decreased $34 million for year ended December 31, 2011, compared to 2010. The decrease was primarily driven by a decrease in depreciation and amortization expense for fully depreciated or amortized assets acquired in prior years. The decline in depreciation and amortization expense was offset by decreased Microsoft reimbursements of $4 million during the year ended December 31, 2011, compared to 2010.
Depreciation and amortization expenses decreased $82 million for the year ended December 31, 2010, compared to 2009. Excluding the impact of Microsoft reimbursements, depreciation and amortization expense decreased $56 million for year ended December 31, 2010, compared to 2009. The decline was primarily due to decreased amortization expense for intangible assets associated with divested business lines as well as fully amortized intangible assets acquired in prior years. The decrease in depreciation and amortization expenses was offset by increased Microsoft reimbursements of $26 million during the year ended December 31, 2010, for which there were no similar reimbursements in 2009.
TAC. TAC decreased $1,133 million and $41 million for the years ended December 31, 2011 and December 31, 2010, respectively, compared to 2010 and 2009, respectively. The decrease year-over-year in both years is primarily due to the change in the recording of TAC in the fourth quarter of 2010 due to the Search Agreement with Microsoft as we no longer incur TAC for transitioned markets. We now receive an 88 percent revenue share in the transitioned markets as Microsoft is the primary obligor to the advertisers. In addition, the decrease in TAC for the year ended December 31, 2011, compared to 2010, was due to the loss of an Affiliate in the Asia Pacific region during late 2010. The decrease for the year ended December 31, 2010, compared to 2009, was offset by increases in TAC due to a new Affiliate in the Asia Pacific segment added in the fourth quarter of 2009 as well as increases in revenue from Affiliate sites.
Facilities and Other Expenses. Facilities and other expenses decreased $117 million year ended December 31, 2011, compared to 2010. Excluding the impact of Microsoft reimbursements, facilities and other expenses decreased $161 million, primarily due to decreases in marketing-related expenses. Marketing-related expenses decreased during the year ended December 31, 2011 compared to 2010 due to the launch of various 2010 marketing campaigns, including our global branding campaign, for which there were no similar campaigns in 2011. The decline in facilities and other expenses was offset by decreased Microsoft reimbursements of $44 million during the year ended December 31, 2011, compared to 2010. The decrease in Microsoft reimbursements for the year ended December 31, 2011 was due to the transition of paid search to Microsoft platforms.
Facilities and other expenses decreased $133 million for the year ended December 31, 2010, compared to 2009. Excluding the impact of Microsoft reimbursements, facilities and other expenses decreased $61 million. The decrease is mainly due to a reduction in restructuring charges of $69 million, a reduction in third-party service-provider expenses of $45 million, and decreases in legal settlements of $21 million, offset by increases in marketing expenses of $33 million. For the year ended December 31, 2010, we recorded total cost reimbursements from Microsoft of $93 million for other costs, for which there were no similar reimbursements in 2009. For the year ended December 31, 2010, the net impact of the reimbursements by Microsoft for our cost of running search and transition costs incurred in 2009 was a reduction in facilities and other expenses of $72 million compared to 2009. Third-party service-provider expenses decreased primarily due to lower advisory and consulting costs. Marketing-related expenses increased during the year ended December 31, 2010 compared to 2009 due to additional 2010 marketing campaigns including our global branding campaign.
We currently expect our operating costs to increase for the first quarter of 2012, compared to the same period of 2011, reflecting our planned reinvestments in the business and the integration of interclick, inc.
44
Restructuring Charges, Net. For the years ended December 31, 2009, 2010, and 2011, restructuring charges, net was comprised of the following (in thousands):
| Years Ended December 31, | ||||||||||||
| 2009 | 2010 | 2011 | ||||||||||
| Employee severance pay and related costs |
$ | 48,696 | $ | 39,652 | $ | 12,965 | ||||||
| Non-cancelable lease, contract terminations, and other charges |
59,285 | 19,737 | 10,251 | |||||||||
| Other non-cash charges |
7,858 | 2,779 | 990 | |||||||||
|
|
|
|
|
|
|
|||||||
| Sub-total before accelerations (reversals) of stock-based compensation expense |
115,839 | 62,168 | 24,206 | |||||||||
| Accelerations (reversals) of stock-based compensation expense |
11,062 | (4,211 | ) | 214 | ||||||||
|
|
|
|
|
|
|
|||||||
| Restructuring charges, net |
$ | 126,901 | $ | 57,957 | $ | 24,420 | ||||||
|
|
|
|
|
|
|
|||||||
Q408 Restructuring Plan. During the fourth quarter of 2008, we implemented certain cost reduction initiatives, including a workforce reduction and consolidation of certain real estate facilities. We began to consolidate and exit selected facilities beginning in the fourth quarter of 2008 and continued this process through the second quarter of 2010. We vacated and ceased use of the facilities identified under the plan. Non-cancelable lease costs were determined based on the present value of remaining lease payments reduced by estimated sublease income. Present value computations use discount rates based on published Treasury risk-free interest rates, adjusted for our credit spread, which is consistent with observable credit spreads of companies with similar credit standing. The cost of exiting and terminating our facility leases was determined by referring to the contractual terms of the agreements, by evaluating the current real estate market conditions, and, where applicable, by referring to amounts in negotiation. Our ability to generate the estimated amounts of sublease income, as well as to terminate lease obligations at the estimated amounts, is dependent upon the commercial real estate market conditions in certain geographies at the time we negotiate the lease termination and sublease arrangements with third parties. These amounts represent our best estimate of the obligations we expect to incur and could be subject to adjustment as market conditions change. The fair value measurement of the liability related to exited facilities involves the use of certain significant unobservable inputs and therefore falls within level 3 of the fair value hierarchy established by accounting guidance (described in Note 8Investments in the Notes to the consolidated financial statements). The remaining lease obligations will be settled over the remaining lease terms which expire through fiscal 2017 and will be adjusted for changes in estimates or the impact of sublease contracts.
During the year ended December 31, 2009, we incurred total pre-tax cash charges for severance, facility, and other restructuring costs of approximately $57 million related to the Q408 restructuring plan, net of reversal for adjustments to original estimates totaling $8 million. In addition to the pre-tax cash charges, we recorded a non-cash charge of approximately $8 million related to the write-off of leasehold improvements furniture and fixtures for exited facilities. Of the $65 million in restructuring charges, net recorded in the year ended December 31, 2009 related to the Q408 restructuring plan, $63 million related to the Americas segment and $2 million related to the EMEA segment. During the year ended December 31, 2010, we incurred total pre-tax cash charges for severance, facility, and other restructuring costs of approximately $19 million related to the Q408 restructuring plan in connection with the continued implementation of these initiatives, net of reversal for adjustments to original estimates totaling $6 million. Of the $19 million in restructuring charges, net recorded in the year ended December 31, 2010 related to the Q408 restructuring plan, $18 million related to the Americas segment and $1 million related to the EMEA segment. During the year ended December 31, 2011, we incurred total pre-tax cash charges for severance, facility, and other restructuring costs of approximately $6 million related to the Q408 restructuring plan, net of reversal for adjustments to original estimates totaling $2 million. Of the $6 million in restructuring charges, net recorded in the year ended December 31, 2011 related to the Q408 restructuring plan, $5 million related to the Americas segment and approximately $1 million related to the EMEA segment. As of December 31, 2011, the aggregate outstanding restructuring liability related to the Q408 restructuring plan was $33 million, most of which relates to the non cancelable lease costs that we expect to pay over the terms of the related obligations, which end by the second quarter of 2017.
45
Q209 Restructuring Plan. During the second quarter of 2009, we implemented new cost reduction initiatives to further reduce our worldwide workforce by approximately 5 percent. The restructuring plan involved reallocating resources to align with our strategic priorities including investing resources in some areas, reducing resources in others, and eliminating some areas of our business that did not support our strategic priorities. During the year ended December 31, 2009, we incurred total pre-tax cash charges of approximately $35 million in severance and other costs related to the Q209 restructuring plan. The pre-tax charges were offset by an $8 million credit related to non-cash stock-based compensation expense reversals for unvested stock awards that were forfeited. Of the $27 million in restructuring charges, net recorded in the year ended December 31, 2009 related to the Q209 restructuring plan, $19 million related to the Americas segment, $7 million related to the EMEA segment, and $1 million related to the Asia Pacific segment. During the year ended December 31, 2010, we incurred insignificant charges related to the Q209 restructuring plan. The plan was completed during the fourth quarter of 2010.
Q409 Restructuring Charges. During the fourth quarter of 2009, we decided to close one of our EMEA facilities and began implementation of a workforce realignment at the facility to focus resources on our strategic initiatives. We exited the facility in the third quarter of 2010. During the year ended December 31, 2009, we incurred total pre-tax cash charges of approximately $16 million in severance and other costs related to this realignment. In connection with the strategic realignment efforts, a U.S. executive of one of our acquired businesses departed. We incurred $19 million of non-cash stock-based compensation expense for the acceleration of certain of the executives stock-based awards pursuant to the acquisition agreements. Of the $35 million in restructuring charges, recorded in the year ended December 31, 2009, $18 million related to the Americas segment, $16 million related to the EMEA segment, and $1 million related to the Asia Pacific segment. During the year ended December 31, 2010, we incurred total pre-tax cash charges of $2 million in severance, facility and other costs related to the Q409 restructuring charges, entirely related to the EMEA segment. During the year ended December 31, 2011 we recorded a net reversal of approximately $2 million for adjustments to the original estimates in severance and other costs related to the Q409 restructuring charges, entirely related to the EMEA segment. The workforce realignment was completed during the second quarter of 2011.
Q410 Restructuring Plan. During the fourth quarter of 2010, we began implementation of a worldwide workforce reduction to align resources with our product strategy. We incurred total pre-tax cash charges of approximately $41 million in severance and other costs related to this workforce reduction in the fourth quarter of 2010. The pre-tax cash charges were offset by a $4 million credit related to non-cash stock-based compensation expense reversals for unvested stock awards that were forfeited. Of the $37 million in net restructuring charges recorded in 2010, $21 million related to the Americas segment, $14 million related to the EMEA segment, and $2 million related to the Asia Pacific segment. During the year ended December 31, 2011, we recorded a net reversal of $3 million for adjustments to original estimates in severance and other costs related to the Q410 restructuring plan, the majority of which related to the Americas segment. As of December 31, 2011, the aggregate outstanding restructuring liability related to the Q410 restructuring plan was $4 million which we expect to substantially pay out by the end of the fourth quarter of 2012.
Q111 Restructuring Plan. During the first quarter of 2011, we began implementation of a workforce realignment and consolidation of certain data centers to further reduce our cost structure and improve efficiency. During the year ended December 31, 2011, we incurred total pre-tax cash charges of approximately $13 million in severance and other related costs related to the Q111 restructuring plan, net of reversal for adjustments to original estimates totaling $1 million. The pre-tax cash charges were offset by a $1 million credit related to non-cash stock-based compensation expense reversals for unvested stock awards that were forfeited. Of the $12 million in net restructuring charges recorded in 2011, $11 million related to the Americas segment, $1 million related to the EMEA segment and insignificant charges related to the Asia Pacific segment. As of December 31, 2011, the aggregate outstanding restructuring liability related to the Q111 restructuring plan was $3 million which we expect to substantially pay out by the end of the fourth quarter of 2012.
Q411 Restructuring Plan. During the fourth quarter of 2011, we implemented a further workforce realignment and consolidation of certain real estate facilities to focus resources as part of our ongoing strategic review. We began to consolidate and exit selected facilities in the fourth quarter of 2011 and expect to continue this process
46
through the second quarter of 2012. During the year ended December 31, 2011, we incurred total pre-tax cash charges of approximately $9 million in severance, facility and other related costs related to the Q411 restructuring plan. In addition to the pre-tax cash charges, we recorded a non-cash charge of approximately $2 million, the majority of which related to non-cash stock-based compensation expense for the acceleration of certain executives stock awards. Of the $11 million in net restructuring charges recorded in the fourth quarter of 2011, $9 million related to the Americas segment, $1 million related to the EMEA segment and $1 million related to the Asia Pacific segment. As of December 31, 2011, the aggregate outstanding restructuring liability related to the Q411 restructuring plan was $9 million which we expect to substantially pay out by the end of the fourth quarter of 2012.
In addition to the charges described above, we currently expect to incur future charges of approximately $16 million to $21 million primarily related to non-cancelable operating costs and accretion related to exited facilities identified as part of the Q408 restructuring plan. Of the total future charges, $15 million to $20 million relate to the Americas segment, $1 million relates to the EMEA segment, and no charges relate to the Asia Pacific segment. The future charges are expected to be recorded through 2017. See Note 15Restructuring charges, net in the Notes to the consolidated financial statements for additional information.
Other Income, Net. Other income, net was as follows (in thousands):
| Years Ended December 31, | 2009-2010 Dollar Change |
2010-2011 Dollar Change |
||||||||||||||||||
| 2009 | 2010 | 2011 | ||||||||||||||||||
| Interest and investment income |
$ | 22,116 | $ | 23,062 | $ | 18,920 | $ | 946 | $ | (4,142 | ) | |||||||||
| Gain on sales of marketable equity securities |
164,851 | | | (164,851 | ) | | ||||||||||||||
| Gain on sale of Zimbra, Inc. |
| 66,130 | | 66,130 | (66,130 | ) | ||||||||||||||
| Gain on sale of HotJobs |
| 186,345 | | 186,345 | (186,345 | ) | ||||||||||||||
| Other |
561 | 22,332 | 8,255 | 21,771 | (14,077 | ) | ||||||||||||||
|
|
|
|
|
|
|
|
|
|
|
|||||||||||
| Total other income, net |
$ | 187,528 | $ | 297,869 | $ | 27,175 | $ | 110,341 | $ | (270,694 | ) | |||||||||
|
|
|
|
|
|
|
|
|
|
|
|||||||||||
Interest and investment income consists of income earned from cash in bank accounts and investments made in marketable debt securities and money market funds.
In February 2010, we sold Zimbra, Inc., for net proceeds of $100 million and recorded a pre-tax gain of $66 million. In August 2010, we sold HotJobs for net proceeds of $225 million and recorded a pre-tax gain of $186 million. Other consists of foreign exchange gains and losses due to re-measurement of monetary assets and liabilities denominated in non-functional currencies, gains/losses from sales or impairments of marketable debt securities and/or investments in privately-held companies, and other non-operating items.
Other income, net may fluctuate in future periods due to changes in our average investment balances, changes in interest and foreign exchange rates, changes in the fair value of foreign currency forward contracts, realized gains and losses on investments, and impairments of investments.
47
Income Taxes. The provision for income taxes for the year ended December 31, 2011 differs from the amount computed by applying the federal statutory income tax rate to income before provision for income taxes and earnings in equity interests as follows (dollars in thousands):
| Years Ended December 31, | ||||||||||||||||||||||||
| 2009 | (1) | 2010 | (1) | 2011 | (1) | |||||||||||||||||||
| Income tax at the U.S. federal statutory rate of 35 percent |
$ | 200,976 | 35% | $ | 374,638 | 35% | $ | 289,630 | 35% | |||||||||||||||
| State income taxes, net of federal benefit |
(4,549 | ) | (1)% | 54,268 | 5% | 4,627 | 1% | |||||||||||||||||
| Change in valuation allowance |
13,521 | 2% | (1,315 | ) | | (5,975 | ) | (1)% | ||||||||||||||||
| Stock-based compensation expense |
28,322 | 5% | 4,404 | | 18,213 | 2% | ||||||||||||||||||
| Research tax credits |
(11,046 | ) | (2)% | (10,345 | ) | (1)% | (10,499 | ) | (1)% | |||||||||||||||
| Effect of non-U.S. operations |
20,126 | 4% | (17,344 | ) | (2)% | (42,806 | ) | (5)% | ||||||||||||||||
| Resolution with tax authorities |
| | (159,168 | ) | (14)% | (14,685 | ) | (2)% | ||||||||||||||||
| Tax gain in excess of book gain from sales of Zimbra, Inc. and HotJobs due to basis differences |
| | 23,184 | 2% | | | ||||||||||||||||||
| Tax restructuring |
(25,583 | ) | (4)% | (43,361 | ) | (4)% | | | ||||||||||||||||
| Other |
(2,446 | ) | (1)% | (3,438 | ) | | 3,262 | | ||||||||||||||||
|
|
|
|
|
|
|
|
|
|
|
|
|
|||||||||||||
| Provision for income taxes |
$ | 219,321 | 38% | $ | 221,523 | 21% | $ | 241,767 | 29% | |||||||||||||||
|
|
|
|
|
|
|
|
|
|
|
|
|
|||||||||||||
| (1) | Percent of income before income taxes and earnings in equity interests. |
The 2011 differences above are further explained as follows:
| | State taxes were higher in 2010 due to a reduction of deferred tax assets associated with an effective tax rate reduction in California that started in 2011. |
| | Stock-based compensation increases our effective tax rate to the extent that stock-based compensation expense is recorded in our financial statements is non-deductible for tax purposes. This primarily occurs with regard to options granted outside the U.S. |
| | Our effective tax rate in all periods is the result of the mix of income earned in various tax jurisdictions that apply a broad range of income tax rates. In 2011, we received tax rulings in foreign jurisdictions that provided favorable tax treatments. |
| | In 2010, we had a favorable resolution of certain issues in an IRS examination of our 2005 and 2006 U.S. federal income tax returns resulting in a reduction of reserves for tax uncertainties and the availability of capital loss carryforwards to offset the tax on the gain from the sales of Zimbra, Inc. and HotJobs. In 2011, we reached agreements with certain state tax authorities in connection with adjustments to income tax returns for years prior to 2009. |
| | During 2010, in connection with tax restructuring activities, we reached a formal agreement with the IRS through a pre-filing agreement to treat certain intercompany bad debts as deductible business expenses on the 2009 federal income tax return. |
Our gross amount of unrecognized tax benefits as of December 31, 2011 is $533 million, of which $394 million is recorded on the consolidated balance sheets. The gross unrecognized tax benefits as of December 31, 2011 decreased by $64 million from the recorded balance as of December 31, 2010 due to favorable settlements of tax audits in 2011. Since there can be no assurance as to the outcome of tax audits currently in progress, it is reasonably possible that over the next twelve-month period we may experience an increase or decrease in our unrecognized tax benefits. It is not possible to determine either the magnitude or the range of any increase or decrease at this time.
During the last quarter of 2011, we commenced discussions with the IRS Appeals Division to settle the contested adjustments for certain intercompany transfer pricing matters from the 2005 and 2006 income tax examination. While no agreement has been reached, the discussions are proceeding. If the matter is resolved on the basis that
48
is currently being discussed with the IRS, then the settlement will not cause us to have tax exposure beyond what has already been provided. In addition, our 2007 and 2008 U.S. income tax returns are still under IRS examination.
As of December 31, 2011, we were also under audit by the California Franchise Tax Board for our 2005 and 2006 tax returns. We believe our existing reserves for all tax matters are adequate.
We are in various stages of examination and appeal in connection with our taxes in foreign jurisdictions, which generally span tax years 2005 through 2010. It is difficult to determine when these examinations will be settled or what their final outcomes will be. We believe that we have adequately provided for any reasonably foreseeable adjustment and that any settlement will not have a material adverse effect on our consolidated financial position, results of operations, or cash flows.
Earnings in Equity Interests. Earnings in equity interests for the year ended December 31, 2011 were approximately $477 million, compared to $396 million and $250 million for 2010 and 2009, respectively. Earnings in equity interests increased during the year ended December 31, 2011 compared to 2010 due primarily to Yahoo Japan and Alibaba Groups continued improved financial performance and the recognition of a dilution gain of $25 million, net of tax in third quarter of 2011, related to our ownership interest in Alibaba Group offset by $33 million in non-cash losses related to the impairment of assets held by Yahoo Japan. Earnings in equity interests increased during the year ended December 31, 2010 compared to 2009 due primarily to Yahoo Japans improved financial performance and the impact of foreign currency exchange rate fluctuations. See Note 4Investments in Equity Interests in the Notes to the consolidated financial statements for additional information.
Noncontrolling Interests. Noncontrolling interests represent the noncontrolling holders percentage share of income or losses from the subsidiaries in which we hold a majority, but less than 100 percent, ownership interest and the results of which are consolidated in our consolidated financial statements. Noncontrolling interests were approximately $14 million in 2011, compared to $13 million and $7 million in 2010 and 2009, respectively. Noncontrolling interests recorded in 2011, 2010, and 2009, were mainly related to the Yahoo! 7 venture in Australia.
Business Segment Results
We manage our business geographically. The primary areas of measurement and decision making are the Americas, EMEA (Europe, Middle East and Africa) and Asia Pacific. Management relies on an internal reporting process that provides revenue ex-TAC, which is defined as revenue less TAC, direct costs excluding TAC by segment, and consolidated income from operations for making decisions related to the evaluation of the financial performance of, and allocating resources to, our segments.
49
Summarized information by segment was as follows (dollars in thousands):
| Years Ended December 31, | 2009-2010 % Change |
2010-2011 % Change |
||||||||||||||||||
| 2009 | 2010 | 2011 | ||||||||||||||||||
| Revenue by segment: |
||||||||||||||||||||
| Americas |
$ | 4,852,331 | $ | 4,425,457 | $ | 3,302,989 | (9)% | (25)% | ||||||||||||
| EMEA |
598,300 | 579,145 | 629,383 | (3)% | 9% | |||||||||||||||
| Asia Pacific |
1,009,684 | 1,320,049 | 1,051,827 | 31% | (20)% | |||||||||||||||
|
|
|
|
|
|
|
|||||||||||||||
| Total revenue |
$ | 6,460,315 | $ | 6,324,651 | $ | 4,984,199 | (2)% | (21)% | ||||||||||||
| TAC by segment: |
||||||||||||||||||||
| Americas |
$ | 1,195,579 | $ | 957,607 | $ | 160,110 | (20)% | (83)% | ||||||||||||
| EMEA |
207,844 | 210,261 | 221,916 | 1% | 6% | |||||||||||||||
| Asia Pacific |
374,403 | 568,554 | 221,345 | 52% | (61)% | |||||||||||||||
|
|
|
|
|
|
|
|||||||||||||||
| Total TAC |
$ | 1,777,826 | $ | 1,736,422 | $ | 603,371 | (2)% | (65)% | ||||||||||||
| Revenue ex-TAC by segment: |
||||||||||||||||||||
| Americas |
$ | 3,656,752 | $ | 3,467,850 | $ | 3,142,879 | (5)% | (9)% | ||||||||||||
| EMEA |
390,456 | 368,884 | 407,467 | (6)% | 10% | |||||||||||||||
| Asia Pacific |
635,281 | 751,495 | 830,482 | 18% | 11% | |||||||||||||||
|
|
|
|
|
|
|
|||||||||||||||
| Total revenue ex-TAC |
$ | 4,682,489 | $ | 4,588,229 | $ | 4,380,828 | (2)% | (5)% | ||||||||||||
| Direct costs by segment(1): |
||||||||||||||||||||
| Americas |
620,690 | 568,017 | 560,016 | (8)% | (1)% | |||||||||||||||
| EMEA |
115,778 | 118,954 | 135,266 | 3% | 14% | |||||||||||||||
| Asia Pacific |
138,739 | 146,657 | 194,394 | 6% | 33% | |||||||||||||||
| Global operating costs(2)(3) |
2,116,747 | 2,044,246 | 1,836,569 | (3)% | (10)% | |||||||||||||||
| Restructuring charges, net |
126,901 | 57,957 | 24,420 | (54)% | (58)% | |||||||||||||||
| Depreciation and amortization |
738,855 | 656,396 | 625,864 | (11)% | (5)% | |||||||||||||||
| Stock-based compensation expense |
438,087 | 223,478 | 203,958 | (49)% | (9)% | |||||||||||||||
|
|
|
|
|
|
|
|||||||||||||||
| Income from operations |
$ | 386,692 | $ | 772,524 | $ | 800,341 | 100% | 4% | ||||||||||||
|
|
|
|
|
|
|
|||||||||||||||
| (1) | Direct costs for each segment include cost of revenue (excluding TAC) and other operating expenses that are directly attributable to the segment such as employee compensation expense (excluding stock-based compensation expense), local sales and marketing expenses, and facilities expenses. Beginning in the fourth quarter of 2010, we no longer include TAC in segment direct costs. For comparison purposes, prior period amounts have been revised to conform to the current presentation. |
| (2) | Global operating costs include product development, service engineering and operations, marketing, customer advocacy, general and administrative, and other corporate expenses that are managed on a global basis and that are not directly attributable to any particular segment. |
| (3) | The net cost reimbursements from Microsoft are primarily included in global operating costs for the years ended December 31, 2010 and 2011. |
Americas. Americas revenue ex-TAC for the year ended December 31, 2011 decreased $325 million, or 9 percent, compared to 2010. Our year-over-year decrease in revenue ex-TAC was primarily due to a decline in search, display, and other revenue. Search revenue ex-TAC decreased due to the revenue share with Microsoft associated with the Search Agreement as well as declines in our Affiliate search revenue as a result of the Microsoft transition. Display revenue ex-TAC decreased due to declines in guaranteed advertising. Other revenue decreased due to changes in certain of our broadband access partnerships, a shift from a fee-paying user structure to other fee structures, and the divestiture of certain business lines during the year ended December 31, 2010. For the year ended December 31, 2011, direct costs attributable to the Americas segment decreased $8 million, or 1 percent, compared to 2010. The decrease is primarily due to lower compensation costs offset slightly by higher content costs.
50
Americas revenue ex-TAC for the year ended December 31, 2010 decreased $189 million, or 5 percent, compared to 2009. Our year-over-year decrease in revenue ex-TAC was a result of a decline in our search advertising business and our fee-based services, partially offset by an increase in our display advertising business. Search revenue ex-TAC decreased due to the revenue share with Microsoft associated with the Search Agreement and the impact of discontinuing our paid inclusion search product in late 2009 as part of our advertising quality initiatives. These decreases were offset by an increase in display revenue ex-TAC driven by increased advertising spending and a shift towards higher-yielding display inventory by our customers. For the year ended December 31, 2010, direct costs attributable to the Americas segment decreased $53 million, or 8 percent, compared to 2009. The decrease is primarily due to lower costs for other costs of revenue including credit card costs and content costs.
Revenue ex-TAC in the Americas accounted for approximately 72 percent of total revenue ex-TAC for the year ended December 31, 2011, compared to 76 percent and 78 percent in 2010 and 2009, respectively.
EMEA. EMEA revenue ex-TAC for the year ended December 31, 2011 increased $39 million, or 10 percent, compared to 2010. Our year-over-year increase in revenue ex-TAC was primarily driven by increases in our display advertising business and the favorable effects of foreign currency exchange rate fluctuations. For the year ended December 31, 2011, direct costs attributable to the EMEA segment increased $16 million, or 14 percent, compared to 2010. The increase is primarily due to higher compensation costs driven by higher headcount and an increase in content costs.
EMEA revenue ex-TAC for the year ended December 31, 2010 decreased $22 million, or 6 percent, compared to 2009. Our year-over-year decrease in revenue ex-TAC was a result of a decline in our search advertising business and our fee-based services, partially offset by an increase in our display advertising business. Search revenue ex-TAC decreased primarily due to traffic quality initiatives. The decrease in fees revenue is primarily attributed to changes in certain broadband access partnerships. For the year ended December 31, 2010, direct costs attributable to the EMEA segment increased $3 million, or 3 percent, compared to 2009. The increase is primarily driven by an increase in content costs, offset by decreases in marketing expenses.
Revenue ex-TAC in EMEA accounted for approximately 9 percent of total revenue ex-TAC for the year ended December 31, 2011, compared to 8 percent for both 2010 and 2009, respectively.
Asia Pacific. Asia Pacific revenue ex-TAC for the year ended December 31, 2011 increased $79 million, or 11 percent, compared to 2010. The increase in Asia Pacific revenue ex-TAC were primarily driven by an increase in our display advertising business, fee-based services and the favorable effects of foreign currency exchange rate fluctuations. For the year ended December 31, 2011, direct costs attributable to the Asia Pacific segment increased $48 million, or 33 percent, compared to 2010. The increase is primarily due to higher compensation costs driven by higher headcount and an increase in other cost of revenue.
Asia Pacific revenue ex-TAC for the year ended December 31, 2010 increased $116 million, or 18 percent, compared to 2009. The increase in Asia Pacific revenue ex-TAC were primarily driven by a new Affiliate in the Asia Pacific segment added in the fourth quarter of 2009 and the favorable effects of foreign currency exchange rate fluctuations. For the year ended December 31, 2010, direct costs attributable to the Asia Pacific segment increased $8 million, or 6 percent, compared to 2009. The increase is primarily due to compensation costs driven by higher average headcount as well as increased content costs.
Revenue ex-TAC in Asia Pacific accounted for approximately 19 percent of total revenue ex-TAC for the year ended December 31, 2011, compared to 16 percent and 14 percent in 2010 and 2009, respectively.
Our international operations expose us to foreign currency exchange rate fluctuations. Revenue ex-TAC and related expenses generated from our international subsidiaries are generally denominated in the currencies of the local countries. Primary currencies include Australian dollars, British pounds, Euros, Japanese Yen, Korean won,
51
and Taiwan dollars. The statements of income of our international operations are translated into U.S. dollars at exchange rates indicative of market rates during each applicable period. To the extent the U.S. dollar strengthens against foreign currencies, the translation of these foreign currency-denominated transactions results in reduced consolidated revenue and operating expenses. Conversely, our consolidated revenue and operating expenses will increase if the U.S. dollar weakens against foreign currencies. Using the foreign currency exchange rates from the year ended December 31, 2010, revenue ex-TAC for the Americas segment for the year ended December 31, 2011 would have been lower than we reported by $6 million, revenue ex-TAC for the EMEA segment would have been lower than we reported by $16 million, and revenue ex-TAC for the Asia Pacific segment would have been lower than we reported by $59 million. Using the foreign currency exchange rates from the year ended December 31, 2010, direct costs for the Americas segment for the year ended December 31, 2011 would have been lower than we reported by $2 million, direct costs for the EMEA segment would have been lower than we reported by $5 million, and direct costs for the Asia Pacific segment would have been lower than we reported by $15 million.
Transactions
Significant acquisitions, strategic investments, dispositions, and other transactions completed in the last three years include the following:
| | May 2009Sold our Gmarket shares for net proceeds of $120 million. |
| | July 2009Entered into a binding letter agreement with Microsoft to negotiate and execute a Search and Advertising Services and Sales Agreement and a License Agreement. |
| | September 2009Sold our direct investment in Alibaba.com for net proceeds of $145 million. |
| | November 2009Acquired Maktoob, a leading online portal in the Middle East, for a total purchase price of $164 million. |
| | December 2009Entered into the Search Agreement and a License Agreement with Microsoft which provides for Microsoft to be the exclusive algorithmic and paid search services provider on Yahoo! Properties and non-exclusive provider of such services on Affiliate sites and for Yahoo! to be the exclusive worldwide relationship sales force for Yahoo!s and Microsofts premium search advertisers. |
| | February 2010The Search Agreement became effective and we sold Zimbra, Inc. for net proceeds of $100 million. |
| | August 2010Sold HotJobs for net proceeds of $225 million. |
| | December 2011Acquired interclick, inc., a technology that enables Yahoo! to upgrade our data targeting capabilities and optimization technologies. We also acquired a team that has expertise in selling audiences against premium content. Total purchase price was $259 million. |
See Note 3Acquisitions and Note 4Investments in Equity Interests in the Notes to the consolidated financial statements for additional information relating to these and other transactions.
We expect to continue to evaluate possible acquisitions of, or strategic investments in, businesses, products, and technologies that are complementary to our business, which acquisitions and investments may require the use of cash.
52
Liquidity and Capital Resources
As of and for each of the three years ended December 31, 2011 (dollars in thousands):
| 2009 | 2010 | 2011 | ||||||||||
| Cash and cash equivalents |
$ | 1,275,430 | $ | 1,526,427 | $ | 1,562,390 | ||||||
| Short-term marketable debt securities |
2,015,655 | 1,357,661 | 493,189 | |||||||||
| Long-term marketable debt securities |
1,226,919 | 744,594 | 474,338 | |||||||||
|
|
|
|
|
|
|
|||||||
| Total cash, cash equivalents, and marketable debt securities |
$ | 4,518,004 | $ | 3,628,682 | $ | 2,529,917 | ||||||
|
|
|
|
|
|
|
|||||||
| Percentage of total assets |
30 | % | 24 | % | 17 | % | ||||||
|
|
|
|
|
|
|
|||||||
| Cash Flow Highlights |
2009 | 2010 | 2011 | |||||||||
| Net cash provided by operating activities |
$ | 1,310,346 | $ | 1,240,190 | $ | 1,323,806 | ||||||
| Net cash (used in) provided by investing activities |
$ | (2,419,238 | ) | $ | 509,915 | $ | 202,362 | |||||
| Net cash provided by (used in) financing activities |
$ | 34,597 | $ | (1,501,706 | ) | $ | (1,455,958 | ) | ||||
Our operating activities for each year in the three years ended December 31, 2011 have generated adequate cash to meet our operating needs. As of December 31, 2011, we had cash, cash equivalents, and marketable debt securities totaling $2.5 billion, compared to $3.6 billion as of December 31, 2010. The decrease is mainly due to share repurchases we made during 2011. During the year ended December 31, 2011, we repurchased 110 million shares for $1,619 million.
During the year ended December 31, 2011, we generated $1,324 million of cash from operating activities, net proceeds from sales and maturities of marketable debt securities of $1,117 million, and $156 million from the issuance of common stock as a result of the exercise of employee stock options and employee stock purchases. This was offset by a net $593 million in capital expenditures, a net $324 million for acquisitions, $1,619 million used in the direct repurchase of common stock, and $45 million in tax withholding payments related to net share settlements of restricted stock units and tax withholding-related reacquisition of shares of restricted stock.
During the year ended December 31, 2010, we generated $1,240 million of cash from operating activities, net proceeds from sales and maturities of marketable debt securities of $1,097 million, proceeds from the sales of divested businesses of $325 million, and $167 million from the issuance of common stock as a result of the exercise of employee stock options and employee stock purchases. This was offset by a net $714 million in capital expenditures, a net $157 million for acquisitions, $1,749 million used in the direct repurchase of common stock, and $49 million in tax withholding payments related to net share settlements of restricted stock units.
We have accrued U.S. federal income taxes on the earnings of our foreign subsidiaries except to the extent the earnings are considered indefinitely reinvested outside the U.S. As of December 31, 2011, approximately $3.2 billion of earnings held by our foreign subsidiaries and a corporate joint venture are designated as indefinitely reinvested outside the U.S. Our foreign subsidiaries held $1.2 billion of our total $2.5 billion of cash, cash equivalents and marketable debt securities as of December 31, 2011. If required for our operations in the U.S., most of the cash held abroad could be repatriated to the U.S. but, under current law, would be subject to U.S. federal income taxes (subject to an adjustment for foreign tax credits). Currently, we do not anticipate a need to repatriate these funds for use in our U.S. operations.
We invest excess cash predominantly in marketable debt securities, money market funds, and time deposits that are liquid, highly rated, and the majority of which have effective maturities of less than one year. Our marketable debt and equity securities are classified as available-for-sale and are reported at fair value, with unrealized gains and losses, net of tax, recorded in accumulated other comprehensive income. Realized gains or losses and declines in value judged to be other-than-temporary, if any, on available-for-sale securities are reported in other income, net. The fair value for securities is determined based on quoted market prices of the historical underlying security or from readily available pricing sources for the identical underlying securities that may not be actively traded as of the valuation date. As of December 31, 2011, certain of our marketable debt securities had a fair
53
value below cost due primarily to the changes in market rates of interest and yields on these securities. We evaluate these investments periodically for possible other-than-temporary impairment. We have no current requirement or intent to sell these securities. We expect to recover up to (or beyond) the initial cost of the investment. We monitor our exposure to European markets, and as of December 31, 2011 we do not have any material direct exposure to European sovereign debt securities. We invest a portion of excess operating cash in money market funds denominated in Euros and British pounds, and through some of these funds we may have immaterial indirect exposure to high-credit quality European sovereign debt securities.
We expect to continue to generate positive cash flow from operations in 2012. We use cash generated by operations as our primary source of liquidity because we believe that internally generated cash flows are sufficient to support our business operations and capital expenditures. We believe that existing cash, cash equivalents, and investments in marketable debt securities, together with any cash generated from operations will be sufficient to meet normal operating requirements including capital expenditures for the next twelve months. However, we may sell additional equity, or debt securities, or obtain credit facilities to further enhance our liquidity position, and the sale of additional equity securities could result in dilution to our stockholders.
See Note 8Investments in the Notes to the consolidated financial statements for additional information.
Cash flow changes
Cash provided by operating activities is driven by our net income, adjusted for non-cash items, working capital changes, dividends received from equity investees, and non-operating gains from sales of investments, assets and other. Non-cash adjustments include depreciation, amortization of intangible assets, stock-based compensation expense, non-cash restructuring charges, tax benefits from stock-based awards, excess tax benefits from stock-based awards, deferred income taxes, and earnings in equity interests. Cash provided by operating activities was higher than net income in the year ended December 31, 2011 mainly due to non-cash items included in net income. Cash provided by operating activities was slightly lower than net income in the year ended December 31, 2010 due to non-cash items included in net income and changes in working capital, including lower collections on accounts receivable, higher tax payments made, and Microsoft reimbursements not yet received as cash.
Cash used in investing activities is primarily attributable to capital expenditures, purchases, sales and maturities of marketable debt securities, purchases of intangible assets, as well as acquisitions including our strategic investments. Our capital expenditures totaled $434 million in 2009, $714 million in 2010, and $593 million in 2011. Our capital expenditures have been primarily used for purchases and internal development of software to support our offerings and our increased number of users as well as the build out of our owned and operated data centers. We invested a net $324 million in acquisitions in 2011, compared to $157 million and $195 million in 2010 and 2009, respectively. Acquisition investments in 2011 included the cash outlay for our acquisition of interclick, inc. In 2011 and 2010, we received net proceeds from sales, maturities, and purchases of marketable debt securities of $1,117 million and $1,097 million, respectively. In 2009, we utilized $2,027 million for net purchases of marketable debt securities. In 2010, we received net proceeds from the sales of divested businesses of $325 million and in 2009 we received proceeds of $265 million from the sales of marketable equity securities for which there were no similar transactions in 2011.
Cash used in financing activities is driven by stock repurchases offset by employee stock option exercises and employee stock purchases. Our cash proceeds from employee option exercises and employee stock purchases were $156 million in 2011, compared to $167 million and $113 million in 2010 and 2009, respectively.
During the year ended December 31, 2011, we used $1,619 million in the direct repurchase of 110 million shares of common stock at an average price of $14.75 per share and $45 million for tax withholding payments related to net share settlements of restricted stock units. During the year ended December 31, 2010, we used $1,749 million in the direct repurchase of 119 million shares of common stock at an average price of $14.68 per share and
54
$49 million for tax withholding payments related to net share settlements of restricted stock units and tax withholding-related reacquisition of shares of restricted stock. During the year ended December 31, 2009, we used $113 million in the direct repurchase of 7 million shares of common stock at an average price of $15.31 per share and $73 million for tax withholding payments related to net share settlements of restricted stock units and tax withholding-related reacquisition of shares of restricted stock.
In 2011, 2010, and 2009, $71 million, $131 million, and $108 million, respectively, of excess tax benefits from stock-based awards for options exercised in current and prior periods were included as a source of cash flows from financing activities. These excess tax benefits represent the reduction in income taxes otherwise payable during the period, attributable to the actual gross tax benefits in excess of the expected tax benefits for options exercised in current and prior periods. We have accumulated excess tax deductions relating to stock options exercised prior to January 1, 2006 available to reduce income taxes otherwise payable. To the extent such deductions reduce income taxes payable in the current year, they are reported as financing activities in the consolidated statements of cash flows. See Note 11Employee Benefits in the Notes to the consolidated financial statements for additional information.
Stock repurchases
On June 24, 2010, our Board of Directors approved a stock repurchase program, which expires in June 2013, pursuant to which we are authorized to repurchase up to $3 billion of our outstanding shares of common stock from time to time. The repurchases may take place in the open market or in privately negotiated transactions, including derivative transactions, and may be made under a Rule 10b5-1 plan.
During the year ended December 31, 2011, 110 million shares were repurchased under the June 2010 program for a total of $1,619 million at an average price of $14.75 per share. As of December 31, 2011, the June 2010 program had remaining authorized purchase capacity of $605 million.
During the year ended December 31, 2011, we repurchased and retired 82 million shares, resulting in reductions of $82 thousand in common stock, $643 million in additional paid-in capital, and $559 million in retained earnings. Treasury stock is accounted for under the cost method.
Capital expenditures
Capital expenditures are generally comprised of purchases of computer hardware, software, server equipment, furniture and fixtures, and real estate. Capital expenditures, net were $593 million in 2011, compared to $714 million in 2010 and $434 million in 2009. Our capital expenditures in 2012 are expected to be flat to down compared to 2011.
Contractual obligations and commitments
The following table presents certain payments due under contractual obligations with minimum firm commitments as of December 31, 2011 (in millions):
| Payments Due by Period | ||||||||||||||||||||
| Total | Due in 2012 |
Due in 2013-2014 |
Due in 2015-2016 |
Thereafter | ||||||||||||||||
| Operating lease obligations(1) |
$ | 581 | $ | 158 | $ | 235 | $ | 122 | $ | 66 | ||||||||||
| Capital lease obligation(2) |
64 | 9 | 16 | 16 | 23 | |||||||||||||||
| Affiliate commitments(3) |
166 | 91 | 75 | | | |||||||||||||||
| Non-cancelable obligations(4) |
228 | 110 | 86 | 12 | 20 | |||||||||||||||
| Uncertain tax positions, including interest and penalties(5) |
408 | | | | 408 | |||||||||||||||
|
|
|
|
|
|
|
|
|
|
|
|||||||||||
| Total contractual obligations |
$ | 1,447 | $ | 368 | $ | 412 | $ | 150 | $ | 517 | ||||||||||
|
|
|
|
|
|
|
|
|
|
|
|||||||||||
55
| (1) | We have entered into various non-cancelable operating lease agreements for our offices throughout the Americas, EMEA, and Asia Pacific regions with original lease periods up to 13 years, expiring between 2011 and 2022. See Note 12Commitments and Contingencies in the Notes to the consolidated financial statements for additional information. |
| (2) | During the year ended December 31, 2008, we entered into an 11 year lease agreement for a data center in the western U.S. Of the total expected minimum lease commitment of $105 million, $21 million was classified as an operating lease for real estate and $84 million was classified as a capital lease for equipment. |
| (3) | We are obligated to make minimum payments under contracts to provide sponsored search and/or display advertising services to our Affiliates, which represent TAC. |
| (4) | We are obligated to make payments under various arrangements with vendors and other business partners, principally for marketing, bandwidth, and content arrangements. |
| (5) | As of December 31, 2011, unrecognized tax benefits and potential interest and penalties resulted in accrued liabilities of $408 million, classified as deferred and other long-term tax liabilities, net on our consolidated balance sheets. As of December 31, 2011, the settlement period for the $408 million long-term income tax liabilities cannot be determined; however, the liabilities are not expected to result in cash payments or become due within the next twelve months. |
Intellectual Property Rights. We are committed to make certain payments under various intellectual property arrangements of up to $34 million through 2023.
Other Commitments. In the ordinary course of business, we may provide indemnifications of varying scope and terms to customers, vendors, lessors, joint venture and business partners, purchasers of assets or subsidiaries and other parties with respect to certain matters, including, but not limited to, losses arising out of our breach of agreements or representations and warranties made by us, services to be provided by us, intellectual property infringement claims made by third parties or, with respect to the sale of assets or a subsidiary, matters related to our conduct of the business and tax matters prior to the sale. In addition, we have entered into indemnification agreements with our directors and certain of our officers that will require us, among other things, to indemnify them against certain liabilities that may arise by reason of their status or service as directors or officers. We have also agreed to indemnify certain former officers, directors, and employees of acquired companies in connection with the acquisition of such companies. We maintain director and officer insurance, which may cover certain liabilities arising from our obligation to indemnify our directors and officers and former directors and officers of acquired companies, in certain circumstances. It is not possible to determine the aggregate maximum potential loss under these indemnification agreements due to the limited history of prior indemnification claims and the unique facts and circumstances involved in each particular agreement. Such indemnification agreements might not be subject to maximum loss clauses. Historically, we have not incurred material costs as a result of obligations under these agreements and we have not accrued any liabilities related to such indemnification obligations in our consolidated financial statements.
As of December 31, 2011, we did not have any relationships with unconsolidated entities or financial partnerships, such as entities often referred to as structured finance or special purpose entities, which would have been established for the purpose of facilitating off-balance sheet arrangements or other contractually narrow or limited purposes. In addition, as of December 31, 2011, we had no off-balance sheet arrangements that have, or are reasonably likely to have, a current or future material effect on our consolidated financial condition, results of operations, liquidity, capital expenditures, or capital resources.
Critical Accounting Policies and Estimates
Our discussion and analysis of our financial condition and results of operations is based upon our consolidated financial statements, which have been prepared in accordance with U.S. GAAP. The preparation of these consolidated financial statements requires us to make estimates, judgments, and assumptions that affect the reported amounts of assets, liabilities, revenue and expenses, and the related disclosure of contingent assets and
56
liabilities. We base our estimates on historical experience and on various other assumptions that we believe are reasonable under the circumstances, the results of which form the basis for making judgments about the carrying values of assets and liabilities that are not readily apparent from other sources. Actual results may differ from these estimates.
An accounting policy is considered to be critical if it requires an accounting estimate to be made based on assumptions about matters that are highly uncertain at the time the estimate is made, and if different estimates that reasonably could have been used, or changes in the accounting estimate that are reasonably likely to occur, could materially impact the consolidated financial statements. We believe that the following critical accounting policies reflect the more significant estimates and assumptions used in the preparation of the consolidated financial statements.
Management has discussed the development and selection of these critical accounting estimates with the Audit Committee of our Board, and the Audit Committee has reviewed the disclosure below. In addition, there are other items within our financial statements that require estimation, but are not deemed critical as defined above. Changes in estimates used in these and other items could have a material impact on our consolidated financial statements.
Revenue Recognition. Our revenue is generated from display, search, and other. Display revenue is generated from the display of graphical advertisements and search revenue is generated from the display of text-based links to an advertisers Website and from revenue sharing arrangements with partners for search technology and services. Other revenue consists of listings-based services revenue, transaction revenue, and fees revenue. While the majority of our revenue transactions contain standard business terms and conditions, there are certain transactions that contain non-standard business terms and conditions. In addition, we enter into certain sales transactions that involve multiple elements (arrangements with more than one deliverable). We also enter into arrangements to purchase goods and/or services from certain customers. As a result, significant contract interpretation is sometimes required to determine the appropriate accounting for these transactions including: (1) whether an arrangement exists; (2) whether fees are fixed or determinable; (3) how the arrangement consideration should be allocated among potential multiple elements; (4) establishing selling prices for deliverables considering multiple factors; (5) when to recognize revenue on the deliverables; (6) whether all elements of the arrangement have been delivered; (7) whether the arrangement should be reported gross as a principal versus net as an agent; (8) whether we receive a separately identifiable benefit from the purchase arrangements with certain customers for which we can reasonably estimate fair value; and (9) whether the consideration received from a vendor should be characterized as revenue or a reimbursement of costs incurred. In addition, our revenue recognition policy requires an assessment as to whether collection is reasonably assured, which inherently requires us to evaluate the creditworthiness of our customers. Changes in judgments on these assumptions and estimates could materially impact the timing or amount of revenue recognition.
Income Taxes. Significant judgment is required in evaluating our uncertain tax positions and determining our provision for income taxes. See Note 9Income Taxes in the Notes to the consolidated financial statements for additional information. We establish reserves for tax-related uncertainties based on estimates of whether, and the extent to which, additional taxes will be due. These reserves are established when we believe that certain positions might be challenged despite our belief that our tax return positions are in accordance with applicable tax laws. We adjust these reserves in light of changing facts and circumstances, such as the closing of a tax audit, new tax legislation, or the change of an estimate based on new information. To the extent that the final tax outcome of these matters is different than the amounts recorded, such differences will affect the provision for income taxes in the period in which such determination is made. The provision for income taxes includes the effect of reserve provisions and changes to reserves that are considered appropriate, as well as the related net interest and penalties.
We record a valuation allowance against certain of our deferred income tax assets if it is more likely than not that those assets will not be realized. In evaluating our ability to realize our deferred income tax assets we consider all available positive and negative evidence, including our operating results, ongoing tax planning, and forecasts of
57
future taxable income on a jurisdiction by jurisdiction basis. In the event we were to determine that we would be able to realize these deferred income tax assets in the future, we would make an adjustment to the valuation allowance, which would reduce the provision for income taxes.
Goodwill. Goodwill is not amortized, but is tested for impairment on an annual basis and between annual tests in certain circumstances. The performance of the goodwill impairment test involves a two-step process. The first step involves comparing the fair value of our reporting units to their carrying values, including goodwill. If the carrying value of the reporting unit exceeds its fair value, the second step of the test is performed by comparing the carrying value of the goodwill in the reporting unit to its implied fair value. An impairment charge is recognized for the excess of the carrying value of goodwill over its implied fair value.
Our reporting units are based on geography, either at the operating segment level or one level below operating segments. The fair values of our reporting units are estimated using an average of a market approach and an income approach as this combination is deemed to be the most indicative of our fair value in an orderly transaction between market participants and is consistent with the methodology used for the goodwill impairment test in prior years. In addition, we ensure that the fair values estimated under these two approaches are comparable with each other. Under the market approach, we utilize publicly-traded comparable company information to determine revenue and earnings multiples that are used to value our reporting units adjusted for an estimated control premium. Under the income approach, we determine fair value based on estimated future cash flows of each reporting unit discounted by an estimated weighted-average cost of capital, reflecting the overall level of inherent risk of a reporting unit and the rate of return an outside investor would expect to earn. Determining the fair value of a reporting unit is judgmental in nature and requires the use of significant estimates and assumptions, including selection of market comparables, estimated future cash flows, and discount rates. These components are discussed below:
| | Market comparables |
We select comparable companies in the specific regions in which our reporting units operate based on similarity of type of business, primarily those involved in online advertising, relative size, financial profile, and other characteristics of those companies compared to our reporting units. Trailing and forward revenue and earnings multiples derived from these comparable companies are applied to financial metrics of each reporting unit to determine their estimated fair values, adjusted for an estimated control premium.
| | Estimated future cash flows |
We base cash flow projections for each reporting unit using a five-year forecast of cash flows and a terminal value based on the Perpetuity Growth Model. The five-year forecast and related assumptions were derived from the most recent annual financial forecast for which the planning process commenced in our fourth quarter. Key assumptions in estimating future cash flows include, among other items, revenue and operating expense growth rates, terminal value growth rate, and capital expenditure and working capital levels.
| | Discount rates |
We employ a Weighted Average Cost of Capital (WACC) approach to determine the discount rates used in our cash flow projections. The determination of the discount rates for each reporting unit includes factors such as the risk-free rate of return and the return an outside investor would expect to earn based on the overall level of inherent risk. The determination of expected returns includes consideration of the beta (a measure of risk) of traded securities of comparable companies and risk premiums of reporting units based on international cost of capital methods.
The sum of the fair values of our reporting units is reconciled to our market capitalization after considering an estimated control premium.
We conducted our annual goodwill impairment test as of October 31, 2011 and determined that the fair values of our reporting units exceeded their carrying values and therefore goodwill in those reporting units was not impaired.
58
Significant management judgment is involved in determining these estimates and assumptions. Changes in these estimates and assumptions could materially affect the determination of fair value for each reporting unit which could trigger future impairment.
Long-lived Assets. We amortize long-lived assets over their estimated useful lives. Identifiable long-lived assets are reviewed for impairment whenever events or changes in circumstances indicate that the carrying value may not be recoverable. Determination of recoverability is based on the lowest level of identifiable estimated undiscounted future cash flows resulting from use of the asset and its eventual disposition. Measurement of any impairment loss is based on the excess of the carrying value of the asset over its fair value. Fair value is determined based on the lowest level of identifiable estimated future cash flows using discount rates determined by our management to be commensurate with the risk inherent in our business model. Our estimates of future cash flows attributable to our long-lived assets require significant judgment based on our historical and anticipated results and are subject to many factors. Different assumptions and judgments could materially affect estimated future cash flows relating to our long-lived assets which could trigger impairment. No impairments of long-lived assets were identified during any of the periods presented.
Investments in Equity Interests. We account for investments in the common stock of entities in which we have the ability to exercise significant influence but do not own a majority equity interest or otherwise control using the equity method. In accounting for these investments we record our proportionate share of the entities net income or loss, one quarter in arrears.
We review our investments in equity interests for impairment whenever events or changes in business circumstances indicate that the carrying value of the investment may not be fully recoverable. Investments identified as having an indication of impairment are subject to further analysis to determine if the impairment is other-than-temporary and this analysis requires estimating the fair value of the investment. The determination of fair value of the investment involves considering factors such as the stock prices of public companies in which we have an equity investment, current economic and market conditions, the operating performance of the companies, including current earnings trends and forecasted cash flows, and other company and industry specific information. The fair value determination, particularly for investments in privately-held companies, requires significant judgment to determine appropriate estimates and assumptions. Changes in these estimates and assumptions could affect the calculation of the fair value of the investments and the determination of whether any identified impairment is other-than-temporary.
Stock-Based Compensation Expense. We recognize stock-based compensation expense net of an estimated forfeiture rate and therefore only recognize compensation expense for those shares expected to vest over the service period of the award. Calculating stock-based compensation expense requires the input of highly subjective assumptions, including the expected term of the stock-based options, stock price volatility, and the pre-vesting award forfeiture rate. We estimate the expected life of options granted based on historical exercise patterns, which we believe are representative of future behavior. We estimate the volatility of our common stock on the date of grant based on the implied volatility of publicly traded options on our common stock, with a term of one year or greater. We believe that implied volatility calculated based on actively traded options on our common stock is a better indicator of expected volatility and future stock price trends than historical volatility.
Therefore, expected volatility for the year ended December 31, 2011 was based on a market-based implied volatility. The assumptions used in calculating the fair value of stock-based awards represent our best estimates, but these estimates involve inherent uncertainties and the application of management judgment. As a result, if factors change and we use different assumptions, our stock-based compensation expense could be materially different in the future. In addition, we are required to estimate the expected pre-vesting award forfeiture rate, as well as the probability that performance conditions that affect the vesting of certain awards will be achieved, and only recognize expense for those shares expected to vest. We estimate this forfeiture rate based on historical experience of our stock-based awards that are granted and cancelled before vesting. If our actual forfeiture rate is materially different from our original estimates, the stock-based compensation expense could be significantly
59
different from what we have recorded in the current period. Changes in the estimated forfeiture rate can have a significant effect on reported stock-based compensation expense, as the effect of adjusting the forfeiture rate for all current and previously recognized expense for unvested awards is recognized in the period the forfeiture estimate is changed. In addition, because many of our stock-based awards have vesting schedules of two or three years cliff vests, a significant change in our actual or expected forfeiture experience will result in the adjustment of stock-based compensation which was recorded in prior years for all unvested awards. If the actual forfeiture rate is higher than the estimated forfeiture rate, then an adjustment will be made to increase the estimated forfeiture rate, which will result in a decrease to the expense recognized in the consolidated financial statements. If the actual forfeiture rate is lower than the estimated forfeiture rate, then an adjustment will be made to lower the estimated forfeiture rate, which will result in an increase to the expense recognized in the consolidated financial statements. See Note 11Employee Benefits in the Notes to the consolidated financial statements for additional information.
Recent Accounting Pronouncements
See Note 1The Company and Summary of Significant Accounting Policies in the Notes to the consolidated financial statements, which is incorporated herein by reference.
| Item 7A. | Quantitative and Qualitative Disclosures About Market Risk |
We are exposed to financial market risks, including changes in currency exchange rates and interest rates and changes in the market values of our investments.
Interest Rate Exposure. Our exposure to market risk for changes in interest rates relates primarily to our cash and marketable debt securities portfolio. We invest excess cash in money market funds, time deposits, and liquid debt instruments of the U.S. and foreign governments and their agencies, U.S. municipalities, and high-credit corporate issuers which are classified as marketable debt securities and cash equivalents.
Investments in fixed rate and floating rate interest earning instruments carry a degree of interest rate risk. Fixed rate securities may have their fair market value adversely impacted due to a rise in interest rates, while floating rate securities may produce less income than expected if interest rates fall. Due in part to these factors, our future investment income may fall short of expectations due to changes in interest rates or we may suffer losses in principal if forced to sell securities that have declined in market value due to changes in interest rates. As of December 31, 2011 and 2010, we had investments in short-term marketable debt securities of approximately $493 million and $1.4 billion, respectively. Such investments had a weighted-average yield of less than 1 percent for both periods. As of December 31, 2011 and 2010, we had investments in long-term marketable debt securities of approximately $474 million and $745 million, respectively. Such investments had a weighted average yield of less than 1 percent for 2011 and approximately 1 percent for 2010. A hypothetical 100 basis point increase in interest rates would result in a $7 million and $14 million decrease in the fair value of our available-for-sale debt securities as of December 31, 2011 and 2010, respectively.
Foreign Currency Exposure. Our foreign currency exposure continues to increase as we grow internationally. The objective of our foreign exchange risk management program is to identify material foreign currency exposures and identify methods to manage these exposures to minimize the potential effects of currency fluctuations on our reported consolidated cash flows and results of operations.
Economic Exposure
We transact business in various foreign currencies and have significant international revenues, as well as costs denominated in foreign currencies. This exposes us to the risk of fluctuations in foreign currency exchange rates. Our objective is to identify material foreign currency exposures and to manage these exposures to minimize the potential effects of currency fluctuations on our reported consolidated cash flow and results of operations.
60
Transaction Exposure
Our exposure to foreign currency transaction gains and losses is the result of assets and liabilities, (including inter-company transactions) that are denominated in currencies other than the relevant entitys functional currency. In certain circumstances, changes in the functional currency value of these assets and liabilities create fluctuations in our reported consolidated financial position, cash flows and results of operations. We may enter into derivative instruments, such as foreign currency forward contracts or other instruments to minimize the short-term foreign currency fluctuations on such assets and liabilities. The gains and losses on the forward contracts may not offset any or more than a portion of the transaction gains and losses on certain foreign currency receivables, investments and payables recognized in earnings. Transaction gains and losses on these foreign exchange contracts are recognized each period in other income, net included on the consolidated statements of income. During the years ended December 31, 2011, 2010, and 2009, we recorded net realized and unrealized foreign currency transaction gains of $9 million and $13 million, and a transaction loss of $1 million, respectively. As of December 31, 2011, we had an outstanding forward contract with a notional value equivalent of approximately $92 million, which will mature on April 30, 2012.
Translation Exposure
We are also exposed to foreign exchange rate fluctuations as we convert the financial statements of our foreign subsidiaries and our investments in equity interests into U.S. dollars in consolidation. If there is a change in foreign currency exchange rates, the conversion of the foreign subsidiaries financial statements into U.S. dollars results in a gain or loss which is recorded as a component of accumulated other comprehensive income which is part of stockholders equity.
Revenue ex-TAC and related expenses generated from our international subsidiaries are generally denominated in the currencies of the local countries. Primary currencies include Australian dollars, British pounds, Euros, Japanese Yen, Korean won, and Taiwan dollars. The statements of income of our international operations are translated into U.S. dollars at exchange rates indicative of market rates during each applicable period. To the extent the U.S. dollar strengthens against foreign currencies, the translation of these foreign currency-denominated transactions results in reduced consolidated revenue and operating expenses. Conversely, our consolidated revenue and operating expenses will increase if the U.S. dollar weakens against foreign currencies. Using the foreign currency exchange rates from the year ended December 31, 2010, revenue ex-TAC for the Americas segment for the year ended December 31, 2011 would have been lower than we reported by $6 million, revenue ex-TAC for the EMEA segment would have been lower than we reported by $16 million, and revenue ex-TAC for the Asia Pacific segment would have been lower than we reported by $59 million. Using the foreign currency exchange rates from the year ended December 31, 2010, direct costs for the Americas segment for the year ended December 31, 2011 would have been lower than we reported by $2 million, direct costs for the EMEA segment would have been lower than we reported by $5 million, and direct costs for the Asia Pacific segment would have been lower than we reported by $15 million.
Investment Exposure. We are exposed to investment risk as it relates to changes in the market value of our investments. We have investments in marketable debt securities and equity instruments of public and private companies.
Our cash and marketable debt securities investment policy and strategy attempts primarily to preserve capital and meet liquidity requirements. A large portion of our cash is managed by external managers within the guidelines of our investment policy. We protect and preserve invested funds by limiting default, market, and reinvestment risk. To achieve this objective, we maintain our portfolio of cash and cash equivalents and short-term and long-term investments in a variety of liquid fixed income securities, including both government and corporate obligations and money market funds. As of December 31, 2011 and 2010, net unrealized gains and losses on these investments were not material.
61
We invest in equity instruments of public companies for business and strategic purposes and have classified these securities as available-for-sale or investment in equity interests. These investments may be subject to significant fluctuations in fair value due to the volatility of the stock market and the industries in which these companies participate. Our investments in available-for-sale equity securities were immaterial as of December 31, 2011 and 2010, respectively. Our realized gains and losses from the sale of available-for-sale equity securities were not material in 2011 and 2010, respectively.
62
| Item 8. | Financial Statements and Supplementary Data |
| Page | ||||
| Index to Consolidated Financial Statements |
||||
| Consolidated Financial Statements: |
||||
| 64 | ||||
| Consolidated Statements of Income for each of the three years in the period ended December 31, 2011 |
65 | |||
| Consolidated Balance Sheets as of December 31, 2010 and 2011 |
66 | |||
| 67 | ||||
| 68 | ||||
| 70 | ||||
| Financial Statement Schedules: |
||||
| 114 | ||||
| All other schedules are omitted because they are not applicable or the required information is shown in the Consolidated Financial Statements or Notes thereto |
||||
| Supplementary Financial Data: |
||||
| Selected Quarterly Financial Data (unaudited) for the two years ended December 31, 2011 |
115 | |||
63
Report of Independent Registered Public Accounting Firm
To the Board of Directors and Stockholders of Yahoo! Inc.:
In our opinion, the consolidated financial statements listed in the accompanying index present fairly, in all material respects, the financial position of Yahoo! Inc. and its subsidiaries at December 31, 2010 and December 31, 2011, and the results of their operations and their cash flows for each of the three years in the period ended December 31, 2011 in conformity with accounting principles generally accepted in the United States of America. In addition, in our opinion, the financial statement schedule listed in the accompanying index presents fairly, in all material respects, the information set forth therein when read in conjunction with the related consolidated financial statements. Also in our opinion, the Company maintained, in all material respects, effective internal control over financial reporting as of December 31, 2011, based on criteria established in Internal ControlIntegrated Framework issued by the Committee of Sponsoring Organizations of the Treadway Commission (COSO). The Companys management is responsible for these financial statements and financial statement schedule, for maintaining effective internal control over financial reporting and for its assessment of the effectiveness of internal control over financial reporting, included in Managements Report on Internal Control Over Financial Reporting appearing under Item 9A. Our responsibility is to express opinions on these financial statements, on the financial statement schedule, and on the Companys internal control over financial reporting based on our integrated audits. We conducted our audits in accordance with the standards of the Public Company Accounting Oversight Board (United States). Those standards require that we plan and perform the audits to obtain reasonable assurance about whether the financial statements are free of material misstatement and whether effective internal control over financial reporting was maintained in all material respects. Our audits of the financial statements included examining, on a test basis, evidence supporting the amounts and disclosures in the financial statements, assessing the accounting principles used and significant estimates made by management, and evaluating the overall financial statement presentation. Our audit of internal control over financial reporting included obtaining an understanding of internal control over financial reporting, assessing the risk that a material weakness exists, and testing and evaluating the design and operating effectiveness of internal control based on the assessed risk. Our audits also included performing such other procedures as we considered necessary in the circumstances. We believe that our audits provide a reasonable basis for our opinions.
A companys internal control over financial reporting is a process designed to provide reasonable assurance regarding the reliability of financial reporting and the preparation of financial statements for external purposes in accordance with generally accepted accounting principles. A companys internal control over financial reporting includes those policies and procedures that (i) pertain to the maintenance of records that, in reasonable detail, accurately and fairly reflect the transactions and dispositions of the assets of the company; (ii) provide reasonable assurance that transactions are recorded as necessary to permit preparation of financial statements in accordance with generally accepted accounting principles, and that receipts and expenditures of the company are being made only in accordance with authorizations of management and directors of the company; and (iii) provide reasonable assurance regarding prevention or timely detection of unauthorized acquisition, use, or disposition of the companys assets that could have a material effect on the financial statements.
Because of its inherent limitations, internal control over financial reporting may not prevent or detect misstatements. Also, projections of any evaluation of effectiveness to future periods are subject to the risk that controls may become inadequate because of changes in conditions, or that the degree of compliance with the policies or procedures may deteriorate.
/s/ PricewaterhouseCoopers LLP
San Jose, California
February 29, 2012
64
Consolidated Statements of Income
| Years Ended December 31, | ||||||||||||
| 2009 | 2010 | 2011 | ||||||||||
| (In thousands, except per share amounts) | ||||||||||||
| Revenue |
$ | 6,460,315 | $ | 6,324,651 | $ | 4,984,199 | ||||||
| Cost of revenue |
2,871,746 | 2,627,545 | 1,502,650 | |||||||||
|
|
|
|
|
|
|
|||||||
| Gross profit |
3,588,569 | 3,697,106 | 3,481,549 | |||||||||
|
|
|
|
|
|
|
|||||||
| Operating expenses: |
||||||||||||
| Sales and marketing |
1,245,350 | 1,264,491 | 1,122,302 | |||||||||
| Product development |
1,210,168 | 1,082,176 | 1,005,090 | |||||||||
| General and administrative |
580,352 | 488,332 | 495,804 | |||||||||
| Amortization of intangibles |
39,106 | 31,626 | 33,592 | |||||||||
| Restructuring charges, net |
126,901 | 57,957 | 24,420 | |||||||||
|
|
|
|
|
|
|
|||||||
| Total operating expenses |
3,201,877 | 2,924,582 | 2,681,208 | |||||||||
|
|
|
|
|
|
|
|||||||
| Income from operations |
386,692 | 772,524 | 800,341 | |||||||||
| Other income, net |
187,528 | 297,869 | 27,175 | |||||||||
|
|
|
|
|
|
|
|||||||
| Income before income taxes and earnings in equity interests |
574,220 | 1,070,393 | 827,516 | |||||||||
| Provision for income taxes |
(219,321 | ) | (221,523 | ) | (241,767 | ) | ||||||
| Earnings in equity interests |
250,390 | 395,758 | 476,920 | |||||||||
|
|
|
|
|
|
|
|||||||
| Net income |
605,289 | 1,244,628 | 1,062,669 | |||||||||
| Less: Net income attributable to noncontrolling interests |
(7,297 | ) | (12,965 | ) | (13,842 | ) | ||||||
|
|
|
|
|
|
|
|||||||
| Net income attributable to Yahoo! Inc. |
$ | 597,992 | $ | 1,231,663 | $ | 1,048,827 | ||||||
|
|
|
|
|
|
|
|||||||
| Net income attributable to Yahoo! Inc. common stockholders per sharebasic |
$ | 0.43 | $ | 0.91 | $ | 0.82 | ||||||
|
|
|
|
|
|
|
|||||||
| Net income attributable to Yahoo! Inc. common stockholders per sharediluted |
$ | 0.42 | $ | 0.90 | $ | 0.82 | ||||||
|
|
|
|
|
|
|
|||||||
| Shares used in per share calculationbasic |
1,397,652 | 1,354,118 | 1,274,240 | |||||||||
|
|
|
|
|
|
|
|||||||
| Shares used in per share calculationdiluted |
1,415,658 | 1,364,612 | 1,282,282 | |||||||||
|
|
|
|
|
|
|
|||||||
| Stock-based compensation expense by function: |
||||||||||||
| Cost of revenue |
$ | 10,759 | $ | 3,275 | $ | 3,489 | ||||||
| Sales and marketing |
141,537 | 71,154 | 65,120 | |||||||||
| Product development |
205,971 | 106,665 | 89,587 | |||||||||
| General and administrative |
79,820 | 42,384 | 45,762 | |||||||||
| Restructuring expense accelerations (reversals), net |
11,062 | (4,211 | ) | 214 | ||||||||
The accompanying notes are an integral part of these consolidated financial statements.
65
Consolidated Balance Sheets
| December 31, | ||||||||
| 2010 | 2011 | |||||||
| (In thousands, except par values) | ||||||||
| ASSETS | ||||||||
| Current assets: |
||||||||
| Cash and cash equivalents |
$ | 1,526,427 | $ | 1,562,390 | ||||
| Short-term marketable debt securities |
1,357,661 | 493,189 | ||||||
| Accounts receivable, net of allowance of $22,975 and $30,142 as of December 31, 2010 and 2011, respectively |
1,028,900 | 1,037,474 | ||||||
| Prepaid expenses and other current assets |
432,560 | 359,483 | ||||||
|
|
|
|
|
|||||
| Total current assets |
4,345,548 | 3,452,536 | ||||||
| Long-term marketable debt securities |
744,594 | 474,338 | ||||||
| Property and equipment, net |
1,653,422 | 1,730,888 | ||||||
| Goodwill |
3,681,645 | 3,900,752 | ||||||
| Intangible assets, net |
255,870 | 254,600 | ||||||
| Other long-term assets |
235,136 | 220,628 | ||||||
| Investments in equity interests |
4,011,889 | 4,749,044 | ||||||
|
|
|
|
|
|||||
| Total assets |
$ | 14,928,104 | $ | 14,782,786 | ||||
|
|
|
|
|
|||||
| LIABILITIES AND EQUITY | ||||||||
| Current liabilities: |
||||||||
| Accounts payable |
$ | 162,424 | $ | 166,595 | ||||
| Accrued expenses and other current liabilities |
1,208,792 | 846,044 | ||||||
| Deferred revenue |
254,656 | 194,722 | ||||||
|
|
|
|
|
|||||
| Total current liabilities |
1,625,872 | 1,207,361 | ||||||
| Long-term deferred revenue |
56,365 | 43,639 | ||||||
| Capital lease and other long-term liabilities |
142,799 | 134,905 | ||||||
| Deferred and other long-term tax liabilities, net |
506,658 | 815,534 | ||||||
|
|
|
|
|
|||||
| Total liabilities |
2,331,694 | 2,201,439 | ||||||
| Commitments and contingencies (Note 12) |
| | ||||||
| Yahoo! Inc. stockholders equity: |
||||||||
| Preferred stock, $0.001 par value; 10,000 shares authorized; none issued or outstanding |
| | ||||||
| Common stock, $0.001 par value; 5,000,000 shares authorized; 1,308,836 shares issued and 1,308,836 shares outstanding as of December 31, 2010 and 1,217,481 shares issued and 1,190,006 shares outstanding as of December 31, 2011 |
1,306 | 1,242 | ||||||
| Additional paid-in capital |
10,109,913 | 9,825,899 | ||||||
| Treasury stock at cost, zero shares as of December 31, 2010 and 27,475 shares as of December 31, 2011 |
| (416,237 | ) | |||||
| Retained earnings |
1,942,656 | 2,432,294 | ||||||
| Accumulated other comprehensive income |
504,254 | 697,869 | ||||||
|
|
|
|
|
|||||
| Total Yahoo! Inc. stockholders equity |
12,558,129 | 12,541,067 | ||||||
| Noncontrolling interests |
38,281 | 40,280 | ||||||
|
|
|
|
|
|||||
| Total equity |
12,596,410 | 12,581,347 | ||||||
|
|
|
|
|
|||||
| Total liabilities and equity |
$ | 14,928,104 | $ | 14,782,786 | ||||
|
|
|
|
|
|||||
The accompanying notes are an integral part of these consolidated financial statements.
66
Consolidated Statements of Cash Flows
| Years Ended December 31, | ||||||||||||
| 2009 | 2010 | 2011 | ||||||||||
| (In thousands) | ||||||||||||
| CASH FLOWS FROM OPERATING ACTIVITIES: |
||||||||||||
| Net income |
$ | 605,289 | $ | 1,244,628 | $ | 1,062,669 | ||||||
| Adjustments to reconcile net income to net cash provided by operating activities: |
||||||||||||
| Depreciation |
554,546 | 555,216 | 530,516 | |||||||||
| Amortization of intangible assets |
184,309 | 127,293 | 117,723 | |||||||||
| Stock-based compensation expense, net |
449,149 | 219,267 | 204,172 | |||||||||
| Non-cash restructuring charges |
7,301 | 2,813 | 990 | |||||||||
| Tax benefits from stock-based awards |
6,860 | 43,119 | 33,497 | |||||||||
| Excess tax benefits from stock-based awards |
(108,487 | ) | (131,061 | ) | (70,680 | ) | ||||||
| Deferred income taxes |
(90,562 | ) | 112,582 | 70,392 | ||||||||
| Earnings in equity interests |
(250,390 | ) | (395,758 | ) | (476,920 | ) | ||||||
| Dividends received from equity investees |
27,628 | 60,918 | 75,391 | |||||||||
| (Gain) loss from sales of investments, assets, and other, net |
(160,634 | ) | (222,347 | ) | 4,405 | |||||||
| Changes in assets and liabilities, net of effects of acquisitions: |
||||||||||||
| Accounts receivable, net |
81,959 | (31,419 | ) | 38,100 | ||||||||
| Prepaid expenses and other |
21,585 | (168,183 | ) | 97,849 | ||||||||
| Accounts payable |
(19,684 | ) | 23,593 | (316 | ) | |||||||
| Accrued expenses and other liabilities |
106,096 | (74,505 | ) | (290,070 | ) | |||||||
| Deferred revenue |
(104,619 | ) | (125,966 | ) | (73,912 | ) | ||||||
|
|
|
|
|
|
|
|||||||
| Net cash provided by operating activities |
1,310,346 | 1,240,190 | 1,323,806 | |||||||||
|
|
|
|
|
|
|
|||||||
| CASH FLOWS FROM INVESTING ACTIVITIES: |
||||||||||||
| Acquisition of property and equipment, net |
(433,795 | ) | (714,078 | ) | (593,294 | ) | ||||||
| Purchases of marketable debt securities |
(5,048,462 | ) | (2,502,652 | ) | (1,708,530 | ) | ||||||
| Proceeds from sales of marketable debt securities |
136,538 | 1,525,330 | 1,508,948 | |||||||||
| Proceeds from maturities of marketable debt securities |
2,884,926 | 2,074,592 | 1,316,197 | |||||||||
| Proceeds from sales of marketable equity securities |
265,194 | | | |||||||||
| Acquisitions, net of cash acquired |
(195,106 | ) | (157,442 | ) | (323,830 | ) | ||||||
| Purchases of intangible assets |
(32,185 | ) | (21,443 | ) | (11,819 | ) | ||||||
| Proceeds from sales of divested businesses |
| 325,000 | | |||||||||
| Proceeds from the sale of investments |
| | 21,271 | |||||||||
| Other investing activities, net |
3,652 | (19,392 | ) | (6,581 | ) | |||||||
|
|
|
|
|
|
|
|||||||
| Net cash (used in) provided by investing activities |
(2,419,238 | ) | 509,915 | 202,362 | ||||||||
|
|
|
|
|
|
|
|||||||
| CASH FLOWS FROM FINANCING ACTIVITIES: |
||||||||||||
| Proceeds from issuance of common stock |
112,673 | 167,388 | 156,226 | |||||||||
| Repurchases of common stock |
(113,444 | ) | (1,749,311 | ) | (1,618,741 | ) | ||||||
| Excess tax benefits from stock-based awards |
108,487 | 131,061 | 70,680 | |||||||||
| Tax withholdings related to net share settlements of restricted stock awards and restricted stock units |
(73,119 | ) | (48,700 | ) | (44,761 | ) | ||||||
| Other financing activities, net |
| (2,144 | ) | (19,362 | ) | |||||||
|
|
|
|
|
|
|
|||||||
| Net cash provided by (used in) financing activities |
34,597 | (1,501,706 | ) | (1,455,958 | ) | |||||||
|
|
|
|
|
|
|
|||||||
| Effect of exchange rate changes on cash and cash equivalents |
57,429 | 2,598 | (34,247 | ) | ||||||||
| Net change in cash and cash equivalents |
(1,016,866 | ) | 250,997 | 35,963 | ||||||||
| Cash and cash equivalents at beginning of year |
2,292,296 | 1,275,430 | 1,526,427 | |||||||||
|
|
|
|
|
|
|
|||||||
| Cash and cash equivalents at end of year |
$ | 1,275,430 | $ | 1,526,427 | $ | 1,562,390 | ||||||
|
|
|
|
|
|
|
|||||||
The accompanying notes are an integral part of these consolidated financial statements.
67
Consolidated Statements of Stockholders Equity
| Years Ended December 31, | ||||||||||||
| 2009 | 2010 | 2011 | ||||||||||
| (In thousands) | ||||||||||||
| Common stock |
||||||||||||
| Balance, beginning of year |
$ | 1,595 | $ | 1,410 | $ | 1,306 | ||||||
| Common stock issued (retired), net |
(185 | ) | (104 | ) | (64 | ) | ||||||
|
|
|
|
|
|
|
|||||||
| Balance, end of year |
1,410 | 1,306 | 1,242 | |||||||||
|
|
|
|
|
|
|
|||||||
| Additional paid-in capital |
||||||||||||
| Balance, beginning of year |
11,643,635 | 10,640,367 | 10,109,913 | |||||||||
| Common stock and stock-based awards issued |
112,654 | 167,368 | 156,211 | |||||||||
| Stock-based compensation expense |
463,469 | 235,558 | 226,270 | |||||||||
| Tax benefits from stock-based awards |
6,860 | 43,119 | 33,497 | |||||||||
| Tax withholdings related to net share settlements of restricted stock units |
(68,344 | ) | (48,600 | ) | (44,593 | ) | ||||||
| Retirement of treasury stock |
(1,516,895 | ) | (977,970 | ) | (643,401 | ) | ||||||
| Other |
(1,012 | ) | 50,071 | (11,998 | ) | |||||||
|
|
|
|
|
|
|
|||||||
| Balance, end of year |
10,640,367 | 10,109,913 | 9,825,899 | |||||||||
|
|
|
|
|
|
|
|||||||
| Treasury stock |
||||||||||||
| Balance, beginning of year |
(5,267,484 | ) | (117,331 | ) | | |||||||
| Repurchases of common stock |
(113,444 | ) | (1,749,311 | ) | (1,618,741 | ) | ||||||
| Tax withholdings related to net share settlements of restricted stock awards |
(4,780 | ) | (100 | ) | (168 | ) | ||||||
| Retirement of treasury stock |
5,268,377 | 1,866,742 | 1,202,672 | |||||||||
|
|
|
|
|
|
|
|||||||
| Balance, end of year |
(117,331 | ) | | (416,237 | ) | |||||||
|
|
|
|
|
|
|
|||||||
| Retained earnings |
||||||||||||
| Balance, beginning of year |
4,752,920 | 1,599,638 | 1,942,656 | |||||||||
| Net income attributable to Yahoo! Inc. |
597,992 | 1,231,663 | 1,048,827 | |||||||||
| Retirement of treasury stock |
(3,751,274 | ) | (888,645 | ) | (559,189 | ) | ||||||
|
|
|
|
|
|
|
|||||||
| Balance, end of year |
1,599,638 | 1,942,656 | 2,432,294 | |||||||||
|
|
|
|
|
|
|
|||||||
| Accumulated other comprehensive income |
||||||||||||
| Balance, beginning of year |
120,276 | 369,236 | 504,254 | |||||||||
| Net change in unrealized (losses) gains on available-for-sale securities, net of tax |
(1,936 | ) | 3,813 | (16,272 | ) | |||||||
| Foreign currency translation adjustment, net of tax |
250,896 | 131,205 | 209,887 | |||||||||
|
|
|
|
|
|
|
|||||||
| Balance, end of year |
369,236 | 504,254 | 697,869 | |||||||||
|
|
|
|
|
|
|
|||||||
| Total Yahoo! Inc. stockholders equity |
$ | 12,493,320 | $ | 12,558,129 | $ | 12,541,067 | ||||||
|
|
|
|
|
|
|
|||||||
The accompanying notes are an integral part of these consolidated financial statements.
68
Yahoo! Inc.
Consolidated Statements of Stockholders Equity(Continued)
| Years Ended December 31, | ||||||||||||
| 2009 | 2010 | 2011 | ||||||||||
| (In thousands) | ||||||||||||
| Comprehensive income |
||||||||||||
| Net income |
$ | 605,289 | $ | 1,244,628 | $ | 1,062,669 | ||||||
| Other comprehensive income (loss): |
||||||||||||
| Unrealized (losses) gains on available-for-sale securities, net of taxes of $10,276, $(1,214), and $8,518 for 2009, 2010, and 2011, respectively |
(9,652 | ) | 3,987 | (17,244 | ) | |||||||
| Reclassification adjustment for realized gains (losses) included in net income, net of taxes of $(10,060), $116, and $(648) for 2009, 2010, and 2011, respectively |
7,716 | (174 | ) | 972 | ||||||||
|
|
|
|
|
|
|
|||||||
| Net change in unrealized (losses) gains on available-for-sale securities, net of tax |
(1,936 | ) | 3,813 | (16,272 | ) | |||||||
| Foreign currency translation adjustment, net of tax |
250,896 | 131,205 | 209,887 | |||||||||
|
|
|
|
|
|
|
|||||||
| Other comprehensive income |
248,960 | 135,018 | 193,615 | |||||||||
|
|
|
|
|
|
|
|||||||
| Comprehensive income |
854,249 | 1,379,646 | 1,256,284 | |||||||||
| Less: Comprehensive income attributable to noncontrolling interests |
(7,297 | ) | (12,965 | ) | (13,842 | ) | ||||||
|
|
|
|
|
|
|
|||||||
| Comprehensive income attributable to Yahoo! Inc. |
$ | 846,952 | $ | 1,366,681 | $ | 1,242,442 | ||||||
|
|
|
|
|
|
|
|||||||
| Number of Outstanding Shares | ||||||||||||
| (In thousands) | ||||||||||||
| Common stock |
||||||||||||
| Balance, beginning of year |
1,391,560 | 1,406,075 | 1,308,836 | |||||||||
| Common stock and restricted stock issued |
22,227 | 21,946 | 18,371 | |||||||||
| Repurchases of common stock |
(7,409 | ) | (119,179 | ) | (109,716 | ) | ||||||
| Tax withholdings related to net share settlements of restricted stock awards |
(303 | ) | (6 | ) | (10 | ) | ||||||
|
|
|
|
|
|
|
|||||||
| Balance, end of year |
1,406,075 | 1,308,836 | 1,217,481 | |||||||||
|
|
|
|
|
|
|
|||||||
The accompanying notes are an integral part of these consolidated financial statements.
69
Notes to Consolidated Financial Statements
Note 1 THE COMPANY AND SUMMARY OF SIGNIFICANT ACCOUNTING POLICIES
The Company. Yahoo! Inc., together with its consolidated subsidiaries (Yahoo!, the Company, we, or us), is a premier digital media company. Through its proprietary technology and insights, Yahoo! delivers personalized digital content and experiences, across devices and around the globe, to vast audiences. The Company provides engaging and innovative canvases for advertisers to connect with their target audiences using its unique blend of Science + Art + Scale. The Company provides online properties and services (Yahoo! Properties) to users as well as a range of marketing services designed to reach and connect with those users on Yahoo! and through a distribution network of third-party entities (Affiliates). These Affiliates integrate the Companys advertising offerings into their Websites or other offerings (those Websites and other offerings, Affiliate sites).
Basis of Presentation. The consolidated financial statements include the accounts of Yahoo! Inc. and its majority-owned or otherwise controlled subsidiaries. All significant intercompany accounts and transactions have been eliminated. Investments in entities in which the Company can exercise significant influence, but does not own a majority equity interest or otherwise control, are accounted for using the equity method and are included as investments in equity interests on the consolidated balance sheets. The Company has included the results of operations of acquired companies from the date of acquisition. Certain prior year amounts have been reclassified to conform to the current year presentation.
The preparation of consolidated financial statements in conformity with generally accepted accounting principles (GAAP) in the United States (U.S.) requires management to make estimates, judgments, and assumptions that affect the reported amounts of assets, liabilities, revenue, and expenses and the related disclosure of contingent assets and liabilities. On an ongoing basis, the Company evaluates its estimates, including those related to revenue, the useful lives of long-lived assets including property and equipment and intangible assets, investment fair values, stock-based compensation, goodwill, income taxes, contingencies, and restructuring charges. The Company bases its estimates of the carrying value of certain assets and liabilities on historical experience and on various other assumptions that are believed to be reasonable under the circumstances, when these carrying values are not readily available from other sources. Actual results may differ from these estimates.
Revenue Recognition. In October 2009, the Financial Accounting Standards Board (FASB) amended the accounting standard for multiple deliverable revenue arrangements, which provided updated guidance on whether multiple deliverables exist, how deliverables in an arrangement should be separated, and how consideration should be allocated. This standard eliminates the use of the residual method and requires arrangement consideration to be allocated based on the relative selling price for each deliverable. The selling price for each arrangement deliverable can be established based on vendor specific objective evidence (VSOE) or third-party evidence (TPE) if VSOE is not available. The new standard provides additional flexibility to utilize an estimate of selling price (ESP) if neither VSOE nor TPE is available.
The Company elected to early adopt this accounting standard on January 1, 2010 on a prospective basis for applicable transactions originating or materially modified after December 31, 2009. The adoption of this standard did not have a significant impact on the Companys revenue recognition for multiple deliverable arrangements. Upon adoption, the selling prices for certain custom advertising solutions may use the best estimate of selling price as provided under the new standard. The adoption of this standard did not have a material impact on the Companys consolidated financial position, cash flows, or results of operations for the year ended December 31, 2010.
In all cases, revenue is recognized only when the price is fixed or determinable, persuasive evidence of an arrangement exists, the service is performed, and collectability of the related fee is reasonably assured. The Companys arrangements generally do not include a provision for cancellation, termination, or refunds that would significantly impact revenue recognition.
70
Revenue is generated from several offerings including the display of graphical advertisements (display advertising), the display of other text-based links to advertisers Websites (search advertising), and other sources.
The Company recognizes revenue from display advertising on Yahoo! Properties and Affiliate sites as impressions are delivered. Impressions are delivered when an advertisement appears in pages viewed by users. Arrangements for these services generally have terms of up to one year and in some cases the terms may be up to three years. For display advertising on Affiliate sites, the Company pays Affiliates for the revenue generated from the display of these advertisements on the Affiliate sites. Traffic acquisition costs (TAC) are payments made to third-party entities that have integrated the Companys advertising offerings into their Websites or other offerings and payments made to companies that direct consumer and business traffic to Yahoo! Properties. The display revenue derived from these arrangements that involve traffic supplied by Affiliates is reported gross of the TAC paid to Affiliates as the Company is the primary obligor to the advertisers who are the customers of the display advertising service.
From time-to-time, the Company may offer customized display advertising solutions to advertisers. These customized display advertising solutions combine the Companys standard display advertising with customized content, customer insights, and campaign analysis. Due to the unique nature of these products, the Company may not be able to establish selling prices based on historical stand-alone sales or third-party evidence; therefore, the Company may use its best estimate to establish selling prices. The Company establishes best estimates within a range of selling prices considering multiple factors including, but not limited to, class of advertiser, size of transaction, seasonality, margin objectives, observed pricing trends, available online inventory, industry pricing strategies, and market conditions. The Company believes the use of the best estimates of selling price allows revenue recognition in a manner consistent with the underlying economics of the transaction.
The Company recognizes revenue from search advertising on Yahoo! Properties and Affiliate sites. Search revenue is recognized based on click-throughs. A click-through occurs when a user clicks on an advertisers search result listing. The Company has entered into a Search and Advertising Services and Sales Agreement (the Search Agreement) with Microsoft, which provides for Microsoft to be the exclusive algorithmic and paid search services provider on Yahoo! Properties and non-exclusive provider of such services on Affiliate sites. In the transitioned markets, the Company reports as revenue the 88 percent share of revenue generated from Microsofts services on Yahoo! Properties and Affiliate sites, as the Company is not the primary obligor in the arrangement with the advertisers. See Note 16Search Agreement with Microsoft Corporation for a description of the Search Agreement with Microsoft.
In the non-transitioned markets, the Company pays Affiliates TAC for the revenue generated from the search advertisements on the Affiliates Websites. The revenue derived from these arrangements is reported gross of the TAC paid to Affiliates, as the Company continues to be the primary obligor to the advertisers. The Company also generates search revenue from a revenue sharing arrangement with Yahoo Japan for search technology and services and records the related revenue as it is earned.
Other revenue includes listings-based services revenue, transaction revenue, and fees revenue. Listings-based services revenue is generated from a variety of consumer and business listings-based services, including classified advertising such as Yahoo! Autos and other services. The Company recognizes listings-based services revenue when the services are performed. Transaction revenue is generated from facilitating commercial transactions through Yahoo! Properties, principally from Yahoo! Small Business, Yahoo! Travel, and Yahoo! Shopping. The Company recognizes transaction revenue when there is evidence that qualifying transactions have occurred (for example, when travel arrangements are booked through Yahoo! Travel). Fees revenue consists of revenue generated from a variety of consumer and business fee-based services, including Internet broadband services, royalties received from joint venture partners, primarily for the use of Yahoo!s brand, and premium mail, as well as services for small businesses. The Company recognizes fees revenue when the services are performed.
71
The Company accounts for cash consideration given to customers, for which it does not receive a separately identifiable benefit or cannot reasonably estimate fair value, as a reduction of revenue rather than as an expense. Cash consideration received in an arrangement with a provider may require consideration of classification of amounts received as revenue or a reimbursement of costs incurred.
Current deferred revenue is comprised of contractual billings in excess of recognized revenue and payments received in advance of revenue recognition. Long-term deferred revenue includes amounts received from customers for which services will not be delivered within the next 12 months.
Restructuring Charges. The Company has developed and implemented restructuring initiatives to improve efficiencies across the organization, reduce operating expenses, and better align its resources to market conditions. As a result of these plans, the Company has recorded restructuring charges comprised principally of employee severance and associated termination costs related to the reduction of its workforce, office closures, losses on subleases, and contract termination costs. Liabilities for costs associated with an exit or disposal activity are recognized when the liability is incurred, as opposed to when management commits to an exit plan. In addition, (i) liabilities associated with exit and disposal activities are measured at fair value; (ii) one-time termination benefits are expensed at the date the entity notifies the employee, unless the employee must provide future service, in which case the benefits are expensed ratably over the future service period; and (iii) costs to terminate a contract before the end of its term are recognized when the entity terminates the contract in accordance with the contract terms. In addition, a portion of the Companys restructuring costs related to international employees whose termination benefits are recognized when the amount of such termination benefits becomes estimable and payment is probable.
These restructuring initiatives require management to make estimates in several areas including: (i) realizable values of assets made redundant, obsolete, or excessive; (ii) expenses for severance and other employee separation costs; and (iii) the ability to generate sublease income and to terminate lease obligations at the estimated amounts.
Allowance for Doubtful Accounts. The Company records its allowance for doubtful accounts based upon its assessment of various factors. The Company considers historical experience, the age of the accounts receivable balances, the credit quality of its customers, current economic conditions, and other factors that may affect customers ability to pay to determine the level of allowance required.
TAC. TAC consists of payments made to third-party entities that have integrated the Companys advertising offerings into their Websites or other offerings and payments made to companies that direct consumer and business traffic to Yahoo! Properties. The Company enters into agreements of varying duration that involve TAC. There are generally two economic structures of the Affiliate agreements: fixed payments based on a guaranteed minimum amount of traffic delivered, which often carry reciprocal performance guarantees from the Affiliate or variable payments based on a percentage of the Companys revenue or based on a certain metric, such as the number of searches or paid clicks. The Company expenses, as cost of revenue, TAC under two different methods. Agreements with fixed payments are expensed ratably over the term the fixed payment covers. Agreements based on a percentage of revenue, number of searches, or other metrics are expensed based on the volume of the underlying activity or revenue multiplied by the agreed-upon price or rate.
Product Development. Product development expenses consist primarily of compensation related expenses (including stock-based compensation expense) incurred for research and development, the development of, enhancements to, and maintenance and operation of Yahoo! Properties, advertising products, technology platforms, and infrastructure. Depreciation expense, third-party technology and development expense, and other operating costs are also included in product development.
Advertising Costs. Advertising production costs are recorded as expense the first time an advertisement appears. Costs of communicating advertising are recorded as expense as advertising space or airtime is used. All other advertising costs are expensed as incurred. Advertising expense totaled approximately $197 million, $237 million, and $148 million for 2009, 2010, and 2011, respectively.
72
Stock-Based Compensation Expense. The Company recognizes stock-based compensation expense net of an estimated forfeiture rate and therefore only recognizes compensation costs for those shares expected to vest over the service period of the award. Stock-based awards are valued based on the grant date fair value of these awards; the Company records stock-based compensation expense on a straight-line basis over the requisite service period, generally one to four years.
Calculating stock-based compensation expense requires the input of highly subjective assumptions, including the expected term of the stock options, stock price volatility, and the pre-vesting forfeiture rate of stock awards. The Company estimates the expected life of options granted based on historical exercise patterns, which the Company believes are representative of future behavior. The Company estimates the volatility of its common stock on the date of grant based on the implied volatility of publicly traded options on its common stock, with a term of one year or greater. The Company believes that implied volatility calculated based on actively traded options on its common stock is a better indicator of expected volatility and future stock price trends than historical volatility. The assumptions used in calculating the fair value of stock-based awards represent the Companys best estimates, but these estimates involve inherent uncertainties and the application of management judgment. As a result, if factors change and the Company uses different assumptions, the Companys stock-based compensation expense could be materially different in the future. In addition, the Company is required to estimate the expected pre-vesting award forfeiture rate, as well as the probability that performance conditions that affect the vesting of certain awards will be achieved, and only recognizes expense for those shares expected to vest. The Company estimates the forfeiture rate based on historical experience of the Companys stock-based awards that are granted and cancelled before vesting. If the Companys actual forfeiture rate is materially different from the Companys original estimate, the stock-based compensation expense could be significantly different from what the Company has recorded in the current period. Changes in the estimated forfeiture rate can have a significant effect on reported stock-based compensation expense, as the effect of adjusting the forfeiture rate for all current and previously recognized expense for unvested awards is recognized in the period the forfeiture estimate is changed. If the actual forfeiture rate is higher than the estimated forfeiture rate, then an adjustment will be made to increase the estimated forfeiture rate, which will result in a decrease to the expense recognized in the financial statements. If the actual forfeiture rate is lower than the estimated forfeiture rate, then an adjustment will be made to lower the estimated forfeiture rate, which will result in an increase to the expense recognized in the financial statements. See Note 11Employee Benefits for additional information.
The Company uses the with and without approach in determining the order in which tax attributes are utilized. As a result, the Company only recognizes a tax benefit from stock-based awards in additional paid-in capital if an incremental tax benefit is realized after all other tax attributes currently available to the Company have been utilized. When tax deductions from stock-based awards are less than the cumulative book compensation expense, the tax effect of the resulting difference (shortfall) is charged first to additional paid-in capital to the extent of the Companys pool of windfall tax benefits with any remainder recognized in income tax expense. The Company has determined that it has a sufficient windfall pool available through the end of 2011. In addition, the Company accounts for the indirect effects of stock-based awards on other tax attributes, such as the research tax credit, through the statement of income.
Operating and Capital Leases. The Company leases office space and data centers under operating leases and certain data center equipment under a capital lease agreement with original lease periods up to 13 years. Assets acquired under capital leases are amortized over the shorter of the remaining lease term or its estimated useful life which is generally 10 to 15 years. Certain of the lease agreements contain rent holidays and rent escalation provisions. For purposes of recognizing these lease incentives on a straight-line basis over the term of the lease, the Company uses the date of initial possession to begin amortization. Lease renewal periods are considered on a lease-by-lease basis and are generally not included in the period of straight-line recognition. For each of the years ended December 31, 2009, 2010 and 2011, the Company expensed $5 million of interest, which approximates the cash payments made for interest. As of December 31, 2010 and 2011, the Company had net lease commitments included in capital lease and other long-term liabilities in the consolidated balance sheets of $40 million and $41 million, respectively.
73
Income Taxes. Deferred income taxes are determined based on the differences between the financial reporting and tax bases of assets and liabilities and are measured using the currently enacted tax rates and laws. The Company records a valuation allowance against particular deferred income tax assets if it is more likely than not that those assets will not be realized. The provision for income taxes comprises the Companys current tax liability and change in deferred income tax assets and liabilities.
Significant judgment is required in evaluating the Companys uncertain tax positions and determining its provision for income taxes. The Company establishes reserves for tax-related uncertainties based on estimates of whether, and the extent to which, additional taxes will be due. These reserves are established when the Company believes that certain positions might be challenged despite its belief that its tax return positions are in accordance with applicable tax laws. The Company adjusts these reserves in light of changing facts and circumstances, such as the closing of a tax audit, new tax legislation, or the change of an estimate. To the extent that the final tax outcome of these matters is different than the amounts recorded, such differences will affect the provision for income taxes in the period in which such determination is made. The provision for income taxes includes the effect of reserve provisions and changes to reserves that are considered appropriate, as well as the related net interest and penalties. Income taxes paid were $114 million, $232 million, and $96 million in the years ended December 31, 2009, 2010, and 2011, respectively. Interest paid was not material in any of the years presented. See Note 9Income Taxes for additional information.
Comprehensive Income. Comprehensive income consists of two components, net income and other comprehensive income (loss). Other comprehensive income (loss) refers to gains and losses that are recorded as an element of stockholders equity but are excluded from net income. The Companys other comprehensive income (loss) is comprised of foreign currency translation adjustments and unrealized gains and losses on marketable debt and equity securities categorized as available-for-sale, as well as the Companys share of its equity investees other comprehensive income.
Cash and Cash Equivalents, Short- and Long-Term Marketable Debt and Equity Securities. The Company invests its excess cash in money market funds, time deposits, and liquid debt instruments of the U.S. and foreign governments and their agencies, U.S. municipalities, and high-credit corporate issuers which are classified as marketable debt securities and cash equivalents. All investments with an original maturity of three months or less are considered cash equivalents. Investments with maturities of less than 12 months from the balance sheet date are classified as current assets. Investments with maturities greater than 12 months from the balance sheet date are classified as long-term assets.
The Companys marketable debt and equity securities are classified as available-for-sale and are reported at fair value, with unrealized gains and losses, net of tax, recorded in accumulated other comprehensive income (loss). Realized gains or losses and declines in value judged to be other-than-temporary, if any, on available-for-sale securities are reported in other income, net. The Company evaluates the investments periodically for possible other-than-temporary impairment. A decline of fair value below amortized costs of debt securities is considered an other-than-temporary impairment if the Company has the intent to sell the security or it is more likely than not that the Company will be required to sell the security before recovery of the entire amortized cost basis. In those instances, an impairment charge equal to the difference between the fair value and the amortized cost basis is recognized in earnings. Regardless of the Companys intent or requirement to sell a debt security, an impairment is considered other-than-temporary if the Company does not expect to recover the entire amortized cost basis; in those instances, a credit loss equal to the difference between the present value of the cash flows expected to be collected based on credit risk and the amortized cost basis of the debt security is recognized in earnings. The Company has no current requirement or intent to sell its debt securities as of December 31, 2011. The Company expects to recover up to (or beyond) the initial cost of investment for securities held. When assessing other-than-temporary impairment of equity securities, the Company reviews factors such as the length of time and extent to which fair value has been below cost basis, the financial condition of the issuer, the Companys intent to hold the investment for a period of time which may be sufficient for an anticipated recovery in market value, and whether its cash flow needs may require the Company to sell the investment. If appropriate, the Company records
74
impairment charges equal to the amount that the carrying value of an equity security exceeds the estimated fair value of such security as of the evaluation date. In computing realized gains and losses on available-for-sale securities, the Company determines cost based on amounts paid, including direct costs such as commissions to acquire the security, using the specific identification method. During the year ended December 31, 2009, the Company recognized a gain of $42 million, net of tax, in connection with the sale of its investment in Gmarket. During the years ended December 31, 2010 and 2011, gross realized gains and losses on available-for-sale debt and equity securities were not material.
Concentration of Risk. Financial instruments that potentially subject the Company to significant concentration of credit risk consist primarily of cash, cash equivalents, marketable debt securities, accounts receivable, and derivative financial instruments. The primary focus of the Companys investment strategy is to preserve capital and meet liquidity requirements. A large portion of the Companys cash is managed by external managers within the guidelines of the Companys investment policy. The Companys investment policy addresses the level of credit exposure by limiting the concentration in any one corporate issuer or sector and establishing a minimum allowable credit rating. To manage the risk exposure, the Company maintains its portfolio of cash and cash equivalents and short-term and long-term investments in a variety of fixed income securities, including U.S. and foreign government, agency, municipal and highly rated corporate debt obligations and money market funds. Accounts receivable are typically unsecured and are derived from revenue earned from customers. The Company performs ongoing credit evaluations of its customers and maintains allowances for potential credit losses. Historically, such losses have been within managements expectations. As of December 31, 2010 and 2011, no one customer accounted for 10 percent or more of the accounts receivable balance and no one customer accounted for 10 percent or more of the Companys revenue for 2009, 2010, or 2011. Revenue under the Search Agreement represented more than 10 percent of the Companys revenue during 2011.
Property and Equipment. Buildings are stated at cost and depreciated using the straight-line method over the estimated useful lives of 25 years. Leasehold improvements are amortized over the lesser of their expected useful lives and the remaining lease term. Computers and equipment and furniture and fixtures are stated at cost and depreciated using the straight-line method over the estimated useful lives of the assets, generally two to five years.
Property and equipment to be held and used are reviewed for impairment whenever events or changes in circumstances indicate that the carrying value of the assets may not be recoverable. Determination of recoverability is based on the lowest level of identifiable estimated undiscounted future cash flows resulting from the use of the asset and its eventual disposition. Measurement of any impairment loss for long-lived assets that management expects to hold and use is based on the excess of the carrying value of the asset over its fair value. No impairments of such assets were identified during any of the periods presented.
Internal Use Software and Website Development Costs. The Company capitalized certain internal use software and Website development costs totaling approximately $90 million, $110 million, and $192 million during 2009, 2010, and 2011, respectively. The estimated useful life of costs capitalized is evaluated for each specific project and ranges from one to three years. During 2009, 2010, and 2011, the amortization of capitalized costs totaled approximately $128 million, $108 million, and $114 million, respectively. Capitalized internal use software and Website development costs are included in property and equipment, net. Included in the capitalized amounts above are $14 million, $16 million, and $22 million, respectively, of stock-based compensation expense in the years ended December 31, 2009, 2010, and 2011.
Goodwill. Goodwill represents the excess of the purchase price over the fair value of the net tangible and intangible assets acquired in a business combination. Goodwill is not amortized, but is tested for impairment on an annual basis and between annual tests in certain circumstances. The performance of the goodwill impairment test involves a two-step process. The first step involves comparing the fair value of the Companys reporting units to their carrying values, including goodwill. The Companys reporting units are based on geography, either at the operating segment level or one level below operating segments. The fair values of the reporting units are
75
estimated using an average of a market approach and an income approach as this combination is deemed to be the most indicative of the Companys fair value in an orderly transaction between market participants. In addition, the fair values estimated under these two approaches are validated against each other to ensure consistency. Under the market approach, the Company utilizes publicly-traded comparable company information, specific to the regions in which the reporting units operate, to determine revenue and earnings multiples that are used to value the reporting units adjusted for an estimated control premium. Under the income approach, the Company determines fair value based on estimated future cash flows of each reporting unit discounted by an estimated weighted-average cost of capital, which reflects the overall level of inherent risk of a reporting unit and the rate of return an outside investor would expect to earn. The cash flow projections for each reporting unit are based on a five-year forecast of cash flows, derived from the most recent annual financial forecast, and a terminal value based on the Perpetuity Growth Model. The sum of the fair values of the reporting units is reconciled to the Companys market capitalization adjusted for an estimated control premium. If the carrying value of the reporting unit exceeds its fair value, the second step of the goodwill impairment test is performed by comparing the carrying value of the goodwill in the reporting unit to its implied fair value. An impairment charge is recognized for the excess of the carrying value of goodwill over its implied fair value. The Company conducted its annual goodwill impairment test as of October 31, 2011 and determined that the fair values of its reporting units exceeded their carrying values and therefore goodwill in those reporting units was not impaired. See Note 5Goodwill for additional information.
Intangible Assets. Intangible assets are carried at cost and amortized over their estimated useful lives, generally on a straight-line basis over one to eight years. The Company reviews identifiable amortizable intangible assets to be held and used for impairment whenever events or changes in circumstances indicate that the carrying value of the assets may not be recoverable. Determination of recoverability is based on the lowest level of identifiable estimated undiscounted cash flows resulting from use of the asset and its eventual disposition. Measurement of any impairment loss is based on the excess of the carrying value of the asset over its fair value.
Investments in Equity Interests. Investments in the common stock of entities in which the Company can exercise significant influence but does not own a majority equity interest or otherwise control are accounted for using the equity method and are included as investments in equity interests on the consolidated balance sheets. The Company records its share of the results of these companies one quarter in arrears within earnings in equity interests on the consolidated statements of income. The Company reviews its investments for other-than-temporary impairment whenever events or changes in business circumstances indicate that the carrying value of the investment may not be fully recoverable. Investments identified as having an indication of impairment are subject to further analysis to determine if the impairment is other-than-temporary and this analysis requires estimating the fair value of the investment. The determination of fair value of the investment involves considering factors such as the stock prices of public companies in which the Company has an equity investment, current economic and market conditions, the operating performance of the companies including current earnings trends and forecasted cash flows, and other company and industry specific information.
Foreign Currency. The functional currency of the Companys international subsidiaries is evaluated on a case-by-case basis and is often the local currency. The financial statements of these subsidiaries are translated into U.S. dollars using period-end rates of exchange for assets and liabilities, historical rates of exchange for equity, and average rates of exchange for the period for revenue and expenses. Translation gains (losses) are recorded in accumulated other comprehensive income (loss) as a component of stockholders equity. In addition, the Company records translation gains (losses) related to its foreign equity method investments in accumulated other comprehensive income (loss). The Company records foreign currency transaction gains and losses, realized and unrealized in other income, net in the consolidated statements of income. The Company recorded $1 million of net losses in 2009 and $13 million and $9 million of net gains in 2010 and 2011, respectively.
Derivative Financial Instruments. The Company uses foreign currency forward contracts with financial institutions to reduce the risk that its cash flows and earnings will be adversely affected by foreign currency exchange rate fluctuations.
76
The derivative entered into by the Company has not been designated as an accounting hedge and instead is used as an economic hedge to partially offset the foreign currency exchange gains and losses generated by the re-measurement of a certain intercompany loan denominated in non-functional currency. The Company recognized this derivative instrument as a liability on the Companys consolidated balance sheets at fair value. Changes in the fair value of this derivative is recorded in other income, net on the Companys consolidated statements of income. The Companys foreign currency forward contract is not used for trading or speculative purposes.
The notional amount of the foreign currency forward contract was $92 million as of December 31, 2011. The fair value of the foreign currency forward contract was $3 million as of December 31, 2011 and was recorded as a loss of $3 million for the year ended December 31, 2011. The Company did not enter into any derivative instruments in fiscal years 2010 or 2009.
Recent Accounting Pronouncements
In June 2011, the Financial Accounting Standards Board (FASB) amended its guidance on the presentation of comprehensive income. Under the amended guidance, an entity has the option to present comprehensive income in either one continuous statement or two consecutive financial statements. A single statement must present the components of net income and total net income, the components of other comprehensive income and total other comprehensive income, and a total for comprehensive income. In a two-statement approach, an entity must present the components of net income and total net income in the first statement. That statement must be immediately followed by a financial statement that presents the components of other comprehensive income, a total for other comprehensive income, and a total for comprehensive income. The option under the current guidance that permits the presentation of components of other comprehensive income as part of the statement of changes in stockholders equity has been eliminated. The amendment becomes effective on January 1, 2012 and is applied retrospectively. Early adoption is permitted. This guidance will not have an impact on the Companys consolidated financial position, results of operations or cash flows as it is disclosure-only in nature.
In September 2011, the FASB issued a revised standard on testing for goodwill impairment. The revised standard allows an entity to first assess qualitatively whether it is necessary to perform step one of the two-step annual goodwill impairment test. An entity is required to perform step one only if the entity concludes that it is more likely than not that a reporting units fair value is less than its carrying amount, a likelihood of more than 50 percent. An entity can choose to perform the qualitative assessment on none, some, or all of its reporting units. Moreover, an entity can bypass the qualitative assessment for any reporting unit in any period and proceed directly to step one of the impairment test, and then perform the qualitative assessment in any subsequent period. The revised standard is effective for annual and interim goodwill impairment tests performed for fiscal years beginning after December 15, 2011 and early adoption is permitted. The Company does not believe this guidance will have any impact on its consolidated financial position, results of operations, or cash flows.
Note 2 BASIC AND DILUTED NET INCOME ATTRIBUTABLE TO YAHOO! COMMON STOCKHOLDERS PER SHARE
Basic and diluted net income attributable to Yahoo! common stockholders per share is computed using the weighted average number of common shares outstanding during the period, excluding net income attributable to participating securities (restricted stock awards granted under the Companys 1995 Stock Plan and restricted stock units granted under the 1996 Directors Stock Plan (the Directors Plan)). Diluted net income per share is computed using the weighted average number of common shares and, if dilutive, potential common shares outstanding during the period. Potential common shares are calculated using the treasury stock method and consist of unvested restricted stock and shares underlying unvested restricted stock units, the incremental common shares issuable upon the exercise of stock options, and shares to be purchased under the 1996 Employee Stock Purchase Plan, as amended and restated in June 2009 (the Employee Stock Purchase Plan). The Company calculates potential tax windfalls and shortfalls by including the impact of pro forma deferred tax assets.
77
The Company takes into account the effect on consolidated net income per share of dilutive securities of entities in which the Company holds equity interests that are accounted for using the equity method.
For 2009, 2010, and 2011, potentially dilutive securities representing approximately 122 million, 80 million, and 56 million shares of common stock, respectively, were excluded from the computation of diluted earnings per share for these periods because their effect would have been anti-dilutive.
The following table sets forth the computation of basic and diluted net income per share (in thousands, except per share amounts):
| Years Ended December 31, | ||||||||||||
| 2009 | 2010 | 2011 | ||||||||||
| Basic: |
||||||||||||
| Numerator: |
||||||||||||
| Net income attributable to Yahoo! Inc. |
$ | 597,992 | $ | 1,231,663 | $ | 1,048,827 | ||||||
| Less: Net income allocated to participating securities |
(552 | ) | (178 | ) | (15 | ) | ||||||
|
|
|
|
|
|
|
|||||||
| Net income attributable to Yahoo! Inc. common stockholdersbasic |
$ | 597,440 | $ | 1,231,485 | $ | 1,048,812 | ||||||
|
|
|
|
|
|
|
|||||||
| Denominator: |
||||||||||||
| Weighted average common shares |
1,397,652 | 1,354,118 | 1,274,240 | |||||||||
|
|
|
|
|
|
|
|||||||
| Net income attributable to Yahoo! Inc. common stockholders per sharebasic |
$ | 0.43 | $ | 0.91 | $ | 0.82 | ||||||
|
|
|
|
|
|
|
|||||||
| Diluted: |
||||||||||||
| Numerator: |
||||||||||||
| Net income attributable to Yahoo! Inc. |
$ | 597,992 | $ | 1,231,663 | $ | 1,048,827 | ||||||
| Less: Net income allocated to participating securities |
(54 | ) | (94 | ) | (14 | ) | ||||||
| Less: Effect of dilutive securities issued by equity investees |
(343 | ) | (2,928 | ) | (2,698 | ) | ||||||
|
|
|
|
|
|
|
|||||||
| Net income attributable to Yahoo! Inc. common stockholdersdiluted |
$ | 597,595 | $ | 1,228,641 | $ | 1,046,115 | ||||||
|
|
|
|
|
|
|
|||||||
| Denominator: |
||||||||||||
| Denominator for basic calculation |
1,397,652 | 1,354,118 | 1,274,240 | |||||||||
| Weighted average effect of Yahoo! Inc. dilutive securities: |
||||||||||||
| Restricted stock and restricted stock units |
10,371 | 5,169 | 5,347 | |||||||||
| Stock options and employee stock purchase plan |
7,635 | 5,325 | 2,695 | |||||||||
|
|
|
|
|
|
|
|||||||
| Denominator for diluted calculation |
1,415,658 | 1,364,612 | 1,282,282 | |||||||||
|
|
|
|
|
|
|
|||||||
| Net income attributable to Yahoo! Inc. common stockholders per sharediluted |
$ | 0.42 | $ | 0.90 | $ | 0.82 | ||||||
|
|
|
|
|
|
|
|||||||
Note 3 ACQUISITIONS
The following table summarizes significant acquisitions (including business combinations and asset acquisitions) completed during the three years ended December 31, 2011 (in millions):
| Purchase Price |
Goodwill | Amortizable Intangibles |
||||||||||
| 2009 |
||||||||||||
| Maktoob |
$ | 164 | $ | 141 | $ | 19 | ||||||
| Other acquisitions |
$ | 30 | $ | 16 | $ | 16 | ||||||
| 2010 |
||||||||||||
| All acquisitions |
$ | 159 | $ | 105 | $ | 50 | ||||||
| 2011 |
||||||||||||
| interclick |
$ | 259 | $ | 171 | $ | 79 | ||||||
| Other acquisitions |
$ | 72 | $ | 49 | $ | 26 | ||||||
78
Transactions completed in 2009
Maktoob. On November 11, 2009, the Company acquired Maktoob.com, Inc. (Maktoob), a leading online portal in the Middle East. The Company believed the acquisition of Maktoob would accelerate the Companys growth in the Middle East through Maktoobs existing strong position in the region and the ability to deliver users a compelling local experience by combining Maktoobs experienced team with Yahoo!s scalable technology and products. The purchase price exceeded the fair value of the net tangible and identifiable intangible assets acquired from Maktoob and as a result, the Company recorded goodwill in connection with this transaction. Under the terms of the agreement, the Company acquired all of the equity interests (including all outstanding options) in Maktoob. Maktoob stockholders and vested optionholders were paid in cash, and outstanding Maktoob unvested options were assumed. Assumed options are exercisable for shares of Yahoo! common stock.
The total purchase price of $164 million consisted of cash consideration. In connection with the acquisition, the Company issued stock-based awards valued at $1 million which was recognized as stock-based compensation expense over a period of up to two years.
The allocation of the purchase price of the assets acquired and liabilities assumed based on their fair values was as follows (in thousands):
| Cash acquired |
$ | 830 | ||
| Other tangible assets acquired |
6,219 | |||
| Amortizable intangible assets: |
||||
| Customer contracts and related relationships |
1,900 | |||
| Developed technology and patents |
13,100 | |||
| Trade name, trademark, and domain name |
4,400 | |||
| Goodwill |
140,958 | |||
|
|
|
|||
| Total assets acquired |
167,407 | |||
| Liabilities assumed |
(2,970 | ) | ||
|
|
|
|||
| Total |
$ | 164,437 | ||
|
|
|
The amortizable intangible assets have useful lives not exceeding five years and a weighted average useful life of five years. No amounts have been allocated to in-process research and development and $141 million has been allocated to goodwill. Goodwill represents the excess of the purchase price over the fair value of the net tangible and identifiable intangible assets acquired and is not deductible for tax purposes. The goodwill recorded in connection with this acquisition is included in the EMEA segment.
Other AcquisitionsBusiness Combinations. During the year ended December 31, 2009, the Company acquired two other companies, which were accounted for as business combinations. The total purchase price for these acquisitions was $30 million. The total cash consideration of $30 million less cash acquired of $2 million resulted in a net cash outlay of $28 million. Of the total purchase price, $16 million was allocated to goodwill, $16 million to amortizable intangible assets, $2 million to tangible assets, $2 million to cash acquired, and $6 million to net assumed liabilities. Goodwill represents the excess of the purchase price over the fair value of the net tangible and intangible assets acquired and is not deductible for tax purposes.
The Companys business combinations completed in 2009 did not have a material impact on the Companys consolidated financial statements, and therefore pro forma disclosures have not been presented.
Transactions completed in 2010
All AcquisitionsBusiness Combinations. During the year ended December 31, 2010, the Company acquired four companies, which were accounted for as business combinations. The total purchase price for these acquisitions was $159 million. The total cash consideration of $159 million less cash acquired of $2 million
79
resulted in a net cash outlay of $157 million. Of the total purchase price, $105 million was allocated to goodwill, $50 million to amortizable intangible assets, $27 million to tangible assets, $2 million to cash acquired, and $25 million to net assumed liabilities. Goodwill represents the excess of the purchase price over the fair value of the net tangible and intangible assets acquired and is not deductible for tax purposes.
The Companys business combinations completed in 2010 did not have a material impact on the Companys consolidated financial statements, and therefore pro forma disclosures have not been presented.
Transactions completed in 2011
interclick. On December 14, 2011, the Company completed the acquisition of interclick, inc. (interclick) through an all cash tender offer for all outstanding shares of common stock of interclick at $9.00 per share. With interclick, the Company acquired innovative data targeting capabilities, optimization technologies and new premium supply, as well as a team experienced in selling audiences across disparate sources of pooled supply. The purchase price exceeded the fair value of the net tangible and identifiable intangible assets acquired from interclick and, as a result, the Company recorded goodwill in connection with this transaction. Under the terms of the agreement, the Company acquired all of the equity interests (including all outstanding options) in interclick. interclick stockholders and vested optionholders were paid in cash, and outstanding interclick unvested options and restricted stock awards were assumed. Assumed options are exercisable for shares of Yahoo! common stock.
The total purchase price of $259 million consisted of cash consideration. In connection with the acquisition, the Company issued stock-based awards valued at $9 million which is being recognized as stock-based compensation expense as the awards vest over a period of up to 4 years.
The allocation of the purchase price of the assets acquired and liabilities assumed based on their fair values was as follows (in thousands):
| Cash acquired |
$ | 4,369 | ||
| Other tangible assets acquired |
72,943 | |||
| Amortizable intangible assets: |
||||
| Customer contracts and related relationships |
42,700 | |||
| Developed technology and patents |
35,600 | |||
| Trade name, trademark, and domain name |
600 | |||
| Goodwill |
170,929 | |||
|
|
|
|||
| Total assets acquired |
327,141 | |||
| Liabilities assumed |
(68,174 | ) | ||
|
|
|
|||
| Total |
$ | 258,967 | ||
|
|
|
The amortizable intangible assets have useful lives not exceeding six years and a weighted average useful life of five years. No amounts have been allocated to in-process research and development and $171 million has been allocated to goodwill. Goodwill represents the excess of the purchase price over the fair value of the net tangible and identifiable intangible assets acquired and is not deductible for tax purposes. The goodwill recorded in connection with this acquisition is included in the Americas segment.
Other AcquisitionsBusiness Combinations. During the year ended December 31, 2011, the Company acquired three other companies, which were accounted for as business combinations. The total purchase price for these acquisitions was $72 million. The total cash consideration of $72 million less cash acquired of $3 million resulted in a net cash outlay of $69 million. Of the total purchase price, $49 million was allocated to goodwill, $26 million to amortizable intangible assets, $3 million to cash acquired, and $6 million to net assumed liabilities. Goodwill represents the excess of the purchase price over the fair value of the net tangible and intangible assets acquired and is not deductible for tax purposes.
80
The Companys business combinations completed in 2011 did not have a material impact on the Companys consolidated financial statements, and therefore pro forma disclosures have not been presented.
Note 4 INVESTMENTS IN EQUITY INTERESTS
As of December 31, investments in equity interests consisted of the following (dollars in thousands):
| 2010 | 2011 | Percent Ownership |
||||||||||
| Alibaba Group |
$ | 2,280,602 | $ | 2,521,825 | 42 | % | ||||||
| Yahoo Japan |
1,731,287 | 2,219,946 | 35 | % | ||||||||
| Other |
| 7,273 | 35 | % | ||||||||
|
|
|
|
|
|||||||||
| Total |
$ | 4,011,889 | $ | 4,749,044 | ||||||||
|
|
|
|
|
|||||||||
Equity Investment in Alibaba Group. On October 23, 2005, the Company acquired approximately 46 percent of the outstanding common stock of Alibaba Group Holding Limited (Alibaba Group), which represented approximately 40 percent on a fully diluted basis, in exchange for $1.0 billion in cash, the contribution of the Companys China-based businesses, including 3721 Network Software Company Limited (Yahoo! China), and direct transaction costs of $8 million. Another investor in Alibaba Group is Softbank Corp., a Japanese corporation (Softbank). Alibaba Group is a privately-held company. Through its investment in Alibaba Group, the Company combined its search capabilities with Alibaba Groups leading online marketplace and online payment system and Alibaba Groups strong local presence, expertise, and vision in the China market. These factors contributed to a purchase price in excess of the Companys share of the fair value of Alibaba Groups net tangible and intangible assets acquired resulting in goodwill. As discussed below, following a restructuring in the ownership of Alibaba Groups online payment system business, Alipay.com Co., Ltd. (Alipay), and the termination of certain control agreements, Alipay was deconsolidated from Alibaba Group in the first quarter of 2011. Alibaba Group continues to receive payment processing services on preferential terms from Alipay and its subsidiaries in accordance with a long-term agreement. See Framework Agreement with Alibaba Group regarding Alipay below.
The investment in Alibaba Group is being accounted for using the equity method, and the total investment, including net tangible assets, identifiable intangible assets and goodwill, is classified as part of investments in equity interests on the Companys consolidated balance sheets. The Company records its share of the results of Alibaba Group and any related amortization expense, one quarter in arrears, within earnings in equity interests in the consolidated statements of income. The Company recorded a dilution gain of $25 million, net of tax of $15 million, in earnings in equity interests related to the dilution of the Companys ownership interest in Alibaba Group primarily as a result of option exercises and the sale of stock to Alibaba Group employees during its quarter ended June 30, 2011 at an average price higher than the Companys invested cost per share.
The Companys initial purchase price was based on acquiring a 40 percent equity interest in Alibaba Group on a fully diluted basis; however, the Company acquired a 46 percent interest based on outstanding shares. In allocating the initial excess of the carrying value of the investment in Alibaba Group over its proportionate share of the net assets of Alibaba Group, the Company allocated a portion of the excess to goodwill to account for the estimated reductions in the carrying value of the investment in Alibaba that may occur as the Companys equity interest is diluted to 40 percent based on specific events anticipated at the time. As of December 31, 2010 and 2011, the Companys ownership interest in Alibaba Group was approximately 43 percent and 42 percent, respectively.
81
As of December 31, 2011 the difference between the Companys carrying value of its investment in Alibaba Group and its proportionate share of the net assets of Alibaba Group is summarized as follows (in thousands):
| Carrying value of investment in Alibaba Group |
$ | 2,521,825 | ||
| Proportionate share of Alibaba Group stockholders equity |
1,843,970 | |||
|
|
|
|||
| Excess of carrying value of investment over proportionate share of Alibaba Groups stockholders equity(*) |
$ | 677,855 | ||
|
|
|
| (*) | The excess carrying value has been primarily assigned to goodwill. |
The amortizable intangible assets included in the excess carrying value have useful lives not exceeding seven years and a weighted average useful life of approximately five years. Goodwill is not deductible for tax purposes.
The following table presents Alibaba Groups U.S. GAAP financial information, as derived from the Alibaba Group financial statements (in thousands):
| Twelve Months Ended September 30, | ||||||||||||
| 2009 | 2010 | 2011 | ||||||||||
| Operating data(*): |
||||||||||||
| Revenue |
$ | 730,336 | $ | 1,298,229 | $ | 2,344,973 | ||||||
| Gross profit |
$ | 534,974 | $ | 986,455 | $ | 1,563,979 | ||||||
| (Loss) income from operations |
$ | (39,460 | ) | $ | (14,355 | ) | $ | 325,343 | ||||
| Net (loss) income |
$ | (19,932 | ) | $ | 42,463 | $ | 339,552 | |||||
| Net (loss) income attributable to Alibaba Group |
$ | (57,346 | ) | $ | (10,743 | ) | $ | 268,004 | ||||
| September 30, 2010 |
September 30, 2011 |
|||||||
| Balance sheet data(*): |
||||||||
| Current assets |
$ | 4,399,571 | $ | 3,491,753 | ||||
| Long-term assets |
$ | 2,436,976 | $ | 2,993,329 | ||||
| Current liabilities |
$ | 2,660,043 | $ | 1,562,840 | ||||
| Long-term liabilities |
$ | 58,679 | $ | 134,160 | ||||
| Non-voting participating redeemable securities |
$ | 860 | $ | 1,415 | ||||
| Noncontrolling interests |
$ | 338,419 | $ | 406,805 | ||||
| (*) | To expedite obtaining an essential regulatory license, the ownership of Alibaba Groups online payment business, Alipay, was restructured so that 100 percent of its outstanding shares are held by a Chinese domestic company, which is majority owned by Alibaba Groups chief executive officer, and certain control agreements were terminated which resulted in the deconsolidation of Alipay in the first quarter of 2011. Accordingly, the Alibaba Group consolidated financial statements as of and for the nine months ended September 30, 2011 do not include the results of Alipay, nor do they include the net assets of Alipay as of and for the nine months ended September 30, 2011. As of September 30, 2010, the consolidated current assets and current liabilities of Alibaba Group both include $1.6 billion of cash collected from purchasers and to be remitted to sellers. These amounts are no longer included in the consolidated balance sheet as of September 30, 2011. The impact of the deconsolidation of Alipay was not material to the Companys financial statements. |
Since acquiring its interest in Alibaba Group, the Company has recorded, in retained earnings, cumulative earnings in equity interests, net of tax, of $350 million and $440 million, respectively as of December 31, 2010 and 2011.
The Company also has commercial arrangements with Alibaba Group to provide technical, development, and advertising services. For the years ended December 31, 2010 and 2011, these transactions were not material.
82
Framework Agreement with Alibaba Group regarding Alipay. On July 29, 2011, the Company entered into a Framework Agreement (the Framework Agreement), with Alibaba Group, Softbank, Alipay, APN Ltd., a company organized under the laws of the Cayman Islands (IPCo), Zhejiang Alibaba E-Commerce Co., Ltd., a limited liability company organized under the laws of the Peoples Republic of China (HoldCo), Jack Ma Yun, Joseph C. Tsai and certain security holders of Alipay or HoldCo as joinder parties.
Alipay, formerly a subsidiary of Alibaba Group, is a subsidiary of HoldCo, which is majority owned by Mr. Ma. IPCo is a special purpose entity formed in connection with the Framework Agreement which at the time of consummation of the transactions under the Framework Agreement is owned by Mr. Ma and Mr. Tsai. The transactions under the Framework Agreement closed on December 14, 2011.
Pursuant to the terms of the Framework Agreement the parties have agreed, among other things, that:
(1) Upon a Liquidity Event (as defined below), HoldCo will pay to Alibaba Group 37.5 percent of the equity value of Alipay (the Liquidity Event Payment), less $500 million (i.e., the principal amount of the IPCo Promissory Note as described below). The Liquidity Event Payment plus $500 million must in the aggregate not be less than $2 billion and may not exceed $6 billion, subject to certain increases and additional payments if no Liquidity Event has occurred by the sixth anniversary of the consummation of the transactions (the closing). Liquidity Event means the earlier to occur of (a) a qualified initial public offering of Alipay, (b) a transfer of 37.5 percent or more of the securities of Alipay; or (c) a sale of all or substantially all of the assets of Alipay. If a Liquidity Event has not occurred by the tenth anniversary of the closing, Alibaba Group will have the right to cause HoldCo to effect a Liquidity Event, provided that the equity value or enterprise value of Alipay at such time exceeds $1 billion, and in such case, the $2 billion minimum amount described above will not apply to a Liquidity Event effected by means of a qualified initial public offering, a sale of all of the securities of Alipay, or a sale of all or substantially all of the assets of Alipay.
(2) Alibaba Group and Alipay have entered into a long-term agreement pursuant to which Alibaba Group will receive payment processing services on preferential terms from Alipay and its subsidiaries. The fees to be paid by Alibaba Group and its subsidiaries to Alipay for the services provided under such agreement take into account Alibaba Group and its subsidiaries status as large volume customers and will be approved on an annual basis by the directors of Alibaba Group designated by Yahoo! and Softbank.
(3) Alibaba Group has licensed to Alipay certain intellectual property and technology and perform certain software technology services for Alipay and in return Alipay pays to Alibaba Group a royalty and software technology services fee, which consists of an expense reimbursement and a 49.9 percent share of the consolidated pre-tax income of Alipay and its subsidiaries. This percentage will decrease upon certain dilutive equity issuances by Alipay and HoldCo; provided, however, such percentage will not be reduced below 30 percent. This agreement will terminate upon the earlier to occur of (a) such time as it may be required to be terminated by applicable regulatory authorities in connection with a qualified initial public offering by Alipay and (b) the date the Liquidity Event Payment, the IPCo Promissory Note (as defined below) and certain related payments have been paid in full.
(4) IPCo has issued to Alibaba Group a non-interest bearing promissory note in the principal amount of $500 million with a seven year maturity (the IPCo Promissory Note).
(5) The IPCo Promissory Note, the Liquidity Event Payment and certain other payments are secured by a pledge of 50,000,000 ordinary shares of Alibaba Group which have been contributed to IPCo by Mr. Ma and Mr. Tsai, as well as certain other collateral which may be pledged in the future.
(6) Yahoo!, Softbank, Alibaba Group, HoldCo, Mr. Ma and Mr. Tsai have entered into an agreement pursuant to which (a) the Alibaba Group board of directors ratified the actions taken by Alibaba Group in connection with the restructuring of the ownership of Alipay and the termination of certain control agreements which resulted in
83
the deconsolidation of Alipay; and (b) the Company, Softbank and Alibaba Group released claims against Alibaba Group, Alipay, HoldCo, Mr. Ma, Mr. Tsai and certain of their related parties (including Alibaba Groups directors in their capacity as such) from any and all claims and liabilities, subject to certain limitations, arising out of or based upon such actions.
The Company is evaluating the impact of the Framework Agreement on the Companys consolidated financial statements as the Company records its share of the results of Alibaba Group and any related amortization expense, one quarter in arrears, within earnings in equity interests in the consolidated statements of income.
Equity Investment in Alibaba.com Limited. As part of the IPO of Alibaba.com, the Company purchased an approximate 1 percent interest in the common stock of Alibaba.com. This investment was accounted for using the equity method, consistent with the Companys investment in Alibaba Group, which holds the controlling interest in Alibaba.com. In September 2009, the Company sold its direct investment in Alibaba.com for net proceeds of $145 million and recorded a pre-tax gain of $98 million in other income, net.
Equity Investment in Yahoo Japan. During April 1996, the Company signed a joint venture agreement with Softbank, which was amended in September 1997, whereby Yahoo Japan Corporation (Yahoo Japan) was formed. Yahoo Japan was formed to establish and manage a local version of Yahoo! in Japan.
The investment in Yahoo Japan is being accounted for using the equity method and the total investment, including net tangible assets, identifiable intangible assets and goodwill, is classified as part of the investments in equity interests balance on the Companys consolidated balance sheets. The Company records its share of the results of Yahoo Japan and any related amortization expense, one quarter in arrears, within earnings in equity interests in the consolidated statements of income.
The Company makes adjustments to the earnings in equity interests line in the consolidated statements of income for any differences between U.S. GAAP and accounting principles generally accepted in Japan (Japanese GAAP), the standards by which Yahoo Japans financial statements are prepared.
During the year ended December 31, 2011, the Company recorded $33 million in U.S. GAAP adjustments to Yahoo Japans net income to reflect the Companys 35 percent share of non-cash losses related to impairments of assets held by Yahoo Japan. The $33 million recorded during the year ended December 31, 2011 primarily includes $7 million related to the Companys share of a non-cash loss in connection with an impairment of assets held by Yahoo Japan in the second quarter of 2011 and a $26 million, U.S. GAAP adjustment to Yahoo Japans net income in the first quarter of 2011 to reflect the Companys share of an other-than-temporary impairment of a cost method investment of Yahoo Japan that resulted primarily from reductions in the projected operating results of the Yahoo Japan investee.
The fair value of the Companys approximate 35 percent ownership in the common stock of Yahoo Japan, based on the quoted stock price, was approximately $6 billion as of December 31, 2011.
As of December 31, 2010 and 2011, the Companys ownership interest in Yahoo Japan was approximately 35 percent. Prior to and during 2001, Yahoo Japan acquired the Companys equity interests in certain entities in Japan for total consideration of approximately $65 million, paid partially in shares of Yahoo Japan common stock and partially in cash. As a result of the acquisition, the Company increased its investment in Yahoo Japan, which resulted in approximately $41 million of goodwill. The carrying value of the Companys investment in Yahoo Japan differs from the amount of the underlying equity in net assets of Yahoo Japan primarily as a result of the goodwill resulting from these transactions. Goodwill is not deductible for tax purposes.
During the years ended December 31, 2009, 2010 and 2011, the Company received cash dividends from Yahoo Japan in the amounts of $26 million, $61 million, and $75 million, net of tax, respectively, which were recorded as reductions in the Companys investment in Yahoo Japan.
84
The following tables present summarized financial information derived from Yahoo Japans consolidated financial statements, which are prepared on the basis of Japanese GAAP. The Company has made adjustments to the Yahoo Japan financial information to address differences between Japanese GAAP and U.S. GAAP that materially impact the summarized financial information below. Due to these adjustments, the Yahoo Japan summarized financial information presented below is not materially different than such information presented on the basis of U.S. GAAP.
| Twelve Months Ended September 30, | ||||||||||||
| 2009 | 2010 | 2011 | ||||||||||
| Operating data: |
||||||||||||
| Revenue |
$ | 3,172,106 | $ | 3,563,989 | $ | 3,988,377 | ||||||
| Gross profit |
$ | 2,652,513 | $ | 2,882,992 | $ | 3,311,357 | ||||||
| Income from operations |
$ | 1,443,374 | $ | 1,679,221 | $ | 1,963,924 | ||||||
| Net income |
$ | 813,759 | $ | 981,388 | $ | 1,114,637 | ||||||
| Net income attributable to Yahoo Japan |
$ | 810,059 | $ | 975,715 | $ | 1,108,390 | ||||||
| September 30, | ||||||||
| 2010 | 2011 | |||||||
| Balance sheet data: |
||||||||
| Current assets |
$ | 2,332,325 | $ | 3,622,833 | ||||
| Long-term assets |
$ | 2,679,566 | $ | 2,907,062 | ||||
| Current liabilities |
$ | 938,985 | $ | 1,117,773 | ||||
| Long-term liabilities |
$ | 30,132 | $ | 36,009 | ||||
| Noncontrolling interests |
$ | 28,774 | $ | 31,102 | ||||
Since acquiring its equity interest in Yahoo Japan, the Company has recorded cumulative earnings in equity interests, net of dividends received and related taxes on dividends, of $1.5 billion and $1.9 billion as of December 31, 2010 and 2011, respectively.
Under technology and trademark license and other commercial arrangements with Yahoo Japan, the Company records revenue from Yahoo Japan based on a percentage of revenue earned by Yahoo Japan. The Company recorded revenue from Yahoo Japan of approximately $303 million, $308 million, and $287 million, respectively, for the years ended December 31, 2009, 2010, and 2011. As of December 31, 2010 and 2011, the Company had net receivable balances from Yahoo Japan of approximately $40 million and $42 million, respectively.
Note 5 GOODWILL
The changes in the carrying amount of goodwill for the years ended December 31, 2010 and 2011 were as follows (in thousands):
| Americas(1) | EMEA(2) | Asia Pacific(3) | Total | |||||||||||||
| Net balance as of January 1, 2010 |
$ | 2,626,115 | $ | 618,435 | $ | 395,823 | $ | 3,640,373 | ||||||||
| Acquisitions and other(4) |
44,386 | (1,098 | ) | (318 | ) | 42,970 | ||||||||||
| Foreign currency translation adjustments |
805 | (32,277 | ) | 29,774 | (1,698 | ) | ||||||||||
|
|
|
|
|
|
|
|
|
|||||||||
| Net balance as of December 31, 2010 |
$ | 2,671,306 | $ | 585,060 | $ | 425,279 | $ | 3,681,645 | ||||||||
| Acquisitions and other(5) |
197,654 | | 22,294 | 219,948 | ||||||||||||
| Foreign currency translation adjustments |
(2,595 | ) | (3,537 | ) | 5,291 | (841 | ) | |||||||||
|
|
|
|
|
|
|
|
|
|||||||||
| Net balance as of December 31, 2011 |
$ | 2,866,365 | $ | 581,523 | $ | 452,864 | $ | 3,900,752 | ||||||||
|
|
|
|
|
|
|
|
|
|||||||||
| (1) | Gross goodwill balances for the Americas segment were $2.6 billion as of January 1, 2010 and $2.9 billion as of December 31, 2011. |
85
| (2) | Gross goodwill balances for the EMEA segment were $1.1 billion as of both January 1, 2010 and December 31, 2011. The EMEA segment includes accumulated impairment losses of $488 million as of both January 1, 2010 and December 31, 2011. |
| (3) | Gross goodwill balances for the Asia Pacific (APAC) segment were $0.5 billion as of both January 1, 2010 and December 31, 2011. The APAC segment includes accumulated impairment losses of $64 million as of both January 1, 2010 and December 31, 2011. |
| (4) | Acquisitions and other for the year ended December 31, 2010 includes reductions of $19 million and $41 million, respectively, of goodwill in the Americas segment related to the sales of Zimbra, Inc. and HotJobs. |
| (5) | Acquisitions and other for the year ended December 31, 2011 includes additions of $198 million and $22 million, respectively, of goodwill in the Americas and Asia Pacific segments. |
Note 6 INTANGIBLE ASSETS, NET
The following table summarizes the Companys carrying amount of intangible assets, net (in thousands):
| December 31, 2010 | ||||||||||||
| Gross Carrying Amount |
Accumulated Amortization(*) |
Net | ||||||||||
| Customer, affiliate, and advertiser related relationships |
$ | 132,298 | $ | (70,194 | ) | $ | 62,104 | |||||
| Developed technology and patents |
393,036 | (225,139 | ) | 167,897 | ||||||||
| Trade names, trademarks, and domain names |
69,346 | (43,477 | ) | 25,869 | ||||||||
|
|
|
|
|
|
|
|||||||
| Total intangible assets, net |
$ | 594,680 | $ | (338,810 | ) | $ | 255,870 | |||||
|
|
|
|
|
|
|
|||||||
| December 31, 2011 | ||||||||||||
| Gross Carrying Amount |
Accumulated Amortization(*) |
Net | ||||||||||
| Customer, affiliate, and advertiser related relationships |
$ | 178,489 | $ | (84,806 | ) | $ | 93,683 | |||||
| Developed technology and patents |
376,561 | (238,893 | ) | 137,668 | ||||||||
| Trade names, trademarks, and domain names |
71,685 | (48,436 | ) | 23,249 | ||||||||
|
|
|
|
|
|
|
|||||||
| Total intangible assets, net |
$ | 626,735 | $ | (372,135 | ) | $ | 254,600 | |||||
|
|
|
|
|
|
|
|||||||
| (*) | Foreign currency translation adjustments, reflecting movement in the currencies of the underlying entities, totaled approximately $18 million as of both December 31, 2010 and 2011. |
The intangible assets have estimated useful lives as follows:
| | Customer, affiliate, and advertiser related relationshipstwo to eight years; |
| | Developed technology and patentsless than one year to eight years; and |
| | Trade names, trademarks, and domain namesone year to indefinite lived. |
The Company recognized amortization expense of intangible assets of approximately $184 million, $127 million, and $118 million for 2009, 2010, and 2011, respectively, including $145 million, $96 million, and $84 million, respectively, included in cost of revenue. Based on the current amount of intangibles subject to amortization, the estimated amortization expense for each of the succeeding years is as follows: 2012: $103 million; 2013: $62 million; 2014: $42 million; 2015: $22 million; 2016: $5 million; and cumulatively thereafter: $5 million.
86
Note 7 CONSOLIDATED FINANCIAL STATEMENT DETAILS
Other income, net
Other income, net for 2009, 2010, and 2011 were as follows (in thousands):
| Years Ended December 31, | ||||||||||||
| 2009 | 2010 | 2011 | ||||||||||
| Interest and investment income |
$ | 22,116 | $ | 23,062 | $ | 18,920 | ||||||
| Gain on sales of marketable equity securities |
164,851 | | | |||||||||
| Gain on sale of Zimbra, Inc. |
| 66,130 | | |||||||||
| Gain on sale of HotJobs |
| 186,345 | | |||||||||
| Other |
561 | 22,332 | 8,255 | |||||||||
|
|
|
|
|
|
|
|||||||
| Total other income, net |
$ | 187,528 | $ | 297,869 | $ | 27,175 | ||||||
|
|
|
|
|
|
|
|||||||
Interest and investment income consists of income earned from cash in bank accounts and investments made in marketable debt securities and money market funds.
Gains on sales of marketable equity securities include gains from sales of publicly traded companies. In May 2009, the Company sold all of its Gmarket shares for net proceeds of $120 million and recorded a pre-tax gain of $67 million. In September 2009, the Company sold its direct investment in Alibaba.com for net proceeds of $145 million and recorded a pre-tax gain of $98 million.
In February 2010, the Company sold Zimbra, Inc. for net proceeds of $100 million and recorded a pre-tax gain of $66 million. In August 2010, the Company sold HotJobs for net proceeds of $225 million and recorded a pre-tax gain of $186 million.
Other consists of foreign exchange gains and losses due to re-measurement of monetary assets and liabilities denominated in non-functional currencies, gains/losses from sales of marketable debt securities and/or investments in privately-held companies, changes in the fair value of the foreign currency forward contract, and other non-operating items.
Prepaid expenses and other current assets
As of December 31, prepaid expenses and other current assets consisted of the following (in thousands):
| 2010 | 2011 | |||||||
| Prepaid expenses |
$ | 61,964 | $ | 81,880 | ||||
| Deferred income taxes (Note 9) |
148,648 | 128,581 | ||||||
| Other receivables non-trade |
71,288 | 5,292 | ||||||
| Other |
150,660 | 143,730 | ||||||
|
|
|
|
|
|||||
| Total prepaid expenses and other current assets |
$ | 432,560 | $ | 359,483 | ||||
|
|
|
|
|
|||||
Property and equipment, net
As of December 31, property and equipment, net consisted of the following (in thousands):
| 2010 | 2011 | |||||||
| Land |
$ | 208,481 | $ | 217,970 | ||||
| Buildings |
494,065 | 611,033 | ||||||
| Leasehold improvements |
268,808 | 313,925 | ||||||
| Computers and equipment(1) |
1,884,670 | 2,015,481 | ||||||
| Furniture and fixtures |
68,082 | 74,357 | ||||||
| Assets not yet in use |
175,830 | 169,998 | ||||||
|
|
|
|
|
|||||
| 3,099,936 | 3,402,764 | |||||||
| Less: accumulated depreciation and amortization(2) |
(1,446,514 | ) | (1,671,876 | ) | ||||
|
|
|
|
|
|||||
| Total property and equipment, net |
$ | 1,653,422 | $ | 1,730,888 | ||||
|
|
|
|
|
|||||
87
| (1) | Includes data center equipment acquired under a capital lease of approximately $40 million and $41 million, respectively, as of December 31, 2010 and 2011. |
| (2) | Includes $9 million and $13 million of accumulated depreciation and $2 million and $4 million of accumulation amortization related to the capital lease as of December 31, 2010 and 2011, respectively. |
Other long-term assets
As of December 31, other long-term assets consisted of the following (in thousands):
| 2010 | 2011 | |||||||
| Deferred income taxes (Note 9) |
$ | 42,960 | $ | 42,392 | ||||
| Investments in privately-held companies |
45,013 | 30,846 | ||||||
| Investments in publicly-held companies |
1,469 | 783 | ||||||
| Other |
145,694 | 146,607 | ||||||
|
|
|
|
|
|||||
| Total other long-term assets |
$ | 235,136 | $ | 220,628 | ||||
|
|
|
|
|
|||||
Accrued expenses and other current liabilities
As of December 31, accrued expenses and other current liabilities consisted of the following (in thousands):
| 2010 | 2011 | |||||||
| Accrued content, connection, traffic acquisition, and other costs |
$ | 271,354 | $ | 140,147 | ||||
| Deferred income taxes (Note 9) |
1,923 | 1,812 | ||||||
| Accrued compensation and related expenses |
368,368 | 330,593 | ||||||
| Accrued taxes payable |
28,031 | 10,891 | ||||||
| Accrued professional service expenses |
66,803 | 70,769 | ||||||
| Accrued sales and marketing related expenses |
28,564 | 19,058 | ||||||
| Accrued restructuring costs |
58,125 | 27,453 | ||||||
| Current liability for uncertain tax contingencies |
111,997 | | ||||||
| Other |
273,627 | 245,321 | ||||||
|
|
|
|
|
|||||
| Total accrued expenses and other current liabilities |
$ | 1,208,792 | $ | 846,044 | ||||
|
|
|
|
|
|||||
Deferred and other long-term tax liabilities, net
As of December 31, deferred and other long-term tax liabilities, net consisted of the following (in thousands):
| 2010 | 2011 | |||||||
| Deferred income taxes |
$ | 199,011 | $ | 407,847 | ||||
| Long-term liability for uncertain tax contingencies(*) |
307,647 | 407,687 | ||||||
|
|
|
|
|
|||||
| Total deferred and other long-term tax liabilities, net (Note 9) |
$ | 506,658 | $ | 815,534 | ||||
|
|
|
|
|
|||||
| (*) | Includes interest and penalties. |
88
Accumulated other comprehensive income
As of December 31, the components of accumulated other comprehensive income were as follows (in thousands):
| 2010 | 2011 | |||||||
| Unrealized gains (losses) on available-for-sale securities, net of tax |
$ | 8,734 | $ | (7,538 | ) | |||
| Foreign currency translation, net of tax |
495,520 | 705,407 | ||||||
|
|
|
|
|
|||||
| Accumulated other comprehensive income |
$ | 504,254 | $ | 697,869 | ||||
|
|
|
|
|
|||||
Note 8 INVESTMENTS
The following tables summarize the investments in available-for-sale securities (in thousands):
| December 31, 2010 | ||||||||||||||||
| Gross Amortized Costs |
Gross Unrealized Gains |
Gross Unrealized Losses |
Estimated Fair Value |
|||||||||||||
| Government and agency securities |
$ | 1,353,064 | $ | 1,513 | $ | (514 | ) | $ | 1,354,063 | |||||||
| Municipal bonds |
6,609 | 8 | | 6,617 | ||||||||||||
| Corporate debt securities, commercial paper, and bank certificates of deposit |
740,043 | 1,608 | (76 | ) | 741,575 | |||||||||||
| Corporate equity securities |
2,597 | | (1,128 | ) | 1,469 | |||||||||||
|
|
|
|
|
|
|
|
|
|||||||||
| Total investments in available-for-sale securities |
$ | 2,102,313 | $ | 3,129 | $ | (1,718 | ) | $ | 2,103,724 | |||||||
|
|
|
|
|
|
|
|
|
|||||||||
| December 31, 2011 | ||||||||||||||||
| Gross Amortized Costs |
Gross Unrealized Gains |
Gross Unrealized Losses |
Estimated Fair Value |
|||||||||||||
| Government and agency securities |
$ | 599,582 | $ | 1,054 | $ | (172 | ) | $ | 600,464 | |||||||
| Corporate debt securities, commercial paper, and bank certificates of deposit |
366,264 | 1,025 | (226 | ) | 367,063 | |||||||||||
| Corporate equity securities |
2,761 | | (1,978 | ) | 783 | |||||||||||
|
|
|
|
|
|
|
|
|
|||||||||
| Total investments in available-for-sale securities |
$ | 968,607 | $ | 2,079 | $ | (2,376 | ) | $ | 968,310 | |||||||
|
|
|
|
|
|
|
|
|
|||||||||
| December 31, | ||||||||
| 2010 | 2011 | |||||||
| Reported as: |
||||||||
| Short-term marketable debt securities |
$ | 1,357,661 | $ | 493,189 | ||||
| Long-term marketable debt securities |
744,594 | 474,338 | ||||||
| Other assets |
1,469 | 783 | ||||||
|
|
|
|
|
|||||
| Total |
$ | 2,103,724 | $ | 968,310 | ||||
|
|
|
|
|
|||||
Available-for-sale securities included in cash and cash equivalents on the consolidated balance sheets are not included in the table above as the gross unrealized gains and losses were immaterial for both 2010 and 2011 as the carrying value approximates fair value because of the short maturity of those instruments.
89
The contractual maturities of available-for-sale marketable debt securities were as follows (in thousands):
| December 31, | ||||||||
| 2010 | 2011 | |||||||
| Due within one year |
$ | 1,357,661 | $ | 493,189 | ||||
| Due after one year through five years |
744,594 | 474,338 | ||||||
|
|
|
|
|
|||||
| Total available-for-sale marketable debt securities |
$ | 2,102,255 | $ | 967,527 | ||||
|
|
|
|
|
|||||
The following tables show all investments in an unrealized loss position for which an other-than-temporary impairment has not been recognized and the related gross unrealized losses and fair value, aggregated by investment category and length of time that individual securities have been in a continuous unrealized loss position (in thousands):
| December 31, 2010 | ||||||||||||||||||||||||
| Less than 12 Months | 12 Months or Greater | Total | ||||||||||||||||||||||
| Fair Value |
Unrealized Loss |
Fair Value |
Unrealized Loss |
Fair Value |
Unrealized Loss |
|||||||||||||||||||
| Government and agency securities |
$ | 539,287 | $ | (514 | ) | $ | | $ | | $ | 539,287 | $ | (514 | ) | ||||||||||
| Corporate debt securities, commercial paper, and bank certificates of deposit |
153,209 | (75 | ) | 6,006 | (1 | ) | 159,215 | (76 | ) | |||||||||||||||
| Corporate equity securities |
1,469 | (1,128 | ) | | | 1,469 | (1,128 | ) | ||||||||||||||||
|
|
|
|
|
|
|
|
|
|
|
|
|
|||||||||||||
| Total investments in available-for-sale securities |
$ | 693,965 | $ | (1,717 | ) | $ | 6,006 | $ | (1 | ) | $ | 699,971 | $ | (1,718 | ) | |||||||||
|
|
|
|
|
|
|
|
|
|
|
|
|
|||||||||||||
| December 31, 2011 | ||||||||||||||||||||||||
| Less than 12 Months | 12 Months or Greater | Total | ||||||||||||||||||||||
| Fair Value |
Unrealized Loss |
Fair Value |
Unrealized Loss |
Fair Value |
Unrealized Loss |
|||||||||||||||||||
| Government and agency securities |
$ | 138,755 | $ | (172 | ) | $ | | $ | | $ | 138,755 | $ | (172 | ) | ||||||||||
| Corporate debt securities, commercial paper, and bank certificates of deposit |
123,574 | (226 | ) | | | 123,574 | (226 | ) | ||||||||||||||||
| Corporate equity securities |
| | 783 | (1,978 | ) | 783 | (1,978 | ) | ||||||||||||||||
|
|
|
|
|
|
|
|
|
|
|
|
|
|||||||||||||
| Total investments in available-for-sale securities |
$ | 262,329 | $ | (398 | ) | $ | 783 | $ | (1,978 | ) | $ | 263,112 | $ | (2,376 | ) | |||||||||
|
|
|
|
|
|
|
|
|
|
|
|
|
|||||||||||||
The Companys investment portfolio consists of liquid high-quality fixed income government, agency, municipal, and corporate debt securities, money market funds, and time deposits with financial institutions.
Investments in both fixed rate and floating rate interest earning instruments carry a degree of interest rate risk. Fixed rate securities may have their fair market value adversely impacted due to a rise in interest rates, while floating rate securities may produce less income than expected if interest rates fall. Fixed income securities may have their fair market value adversely impacted due to a deterioration of the credit quality of the issuer. The longer the term of the securities, the more susceptible they are to changes in market rates. Investments are reviewed periodically to identify possible other-than-temporary impairment. The Company has no current requirement or intent to sell these securities. The Company expects to recover up to (or beyond) the initial cost of investment for securities held.
The FASBs authoritative guidance on fair value measurements establishes a framework for measuring fair value and requires disclosures about fair value measurements by establishing a hierarchy that prioritizes the inputs to
90
valuation techniques used to measure fair value. The hierarchy gives the highest priority to unadjusted quoted prices in active markets for identical assets or liabilities (Level 1 measurements) and lowest priority to unobservable inputs (Level 3 measurements). The three levels of the fair value hierarchy are described below:
Basis of Fair Value Measurement
| Level 1 |
Observable inputs that reflect quoted prices (unadjusted) for identical assets or liabilities in active markets. | |
| Level 2 |
Inputs reflect quoted prices for identical assets or liabilities in markets that are not active; quoted prices for similar assets or liabilities in active markets; inputs other than quoted prices that are observable for the asset or the liability; or inputs that are derived principally from or corroborated by observable market data by correlation or other means. | |
| Level 3 |
Unobservable inputs reflecting the Companys own assumptions incorporated in valuation techniques used to determine fair value. These assumptions are required to be consistent with market participant assumptions that are reasonably available. | |
The following table sets forth the financial assets, measured at fair value, by level within the fair value hierarchy as of December 31, 2010 (in thousands):
| Fair Value Measurements at Reporting Date Using | ||||||||||||
| Assets |
Level 1 | Level 2 | Total | |||||||||
| Money market funds(1) |
$ | 291,268 | $ | | $ | 291,268 | ||||||
| Available-for-sale securities: |
||||||||||||
| Government and agency securities(1) |
| 1,401,991 | 1,401,991 | |||||||||
| Municipal bonds(1) |
| 26,269 | 26,269 | |||||||||
| Commercial paper and bank certificates of deposit(1) |
| 218,485 | 218,485 | |||||||||
| Corporate debt securities(1) |
| 576,378 | 576,378 | |||||||||
|
|
|
|
|
|
|
|||||||
| Available-for-sale securities at fair value |
$ | 291,268 | $ | 2,223,123 | $ | 2,514,391 | ||||||
| Corporate equity securities(2) |
1,469 | | 1,469 | |||||||||
|
|
|
|
|
|
|
|||||||
| Total assets at fair value |
$ | 292,737 | $ | 2,223,123 | $ | 2,515,860 | ||||||
|
|
|
|
|
|
|
|||||||
| (1) | The money market funds, government and agency securities, municipal bonds, commercial paper and bank certificates of deposit, and corporate debt securities are classified as part of either cash and cash equivalents or investments in marketable debt securities in the consolidated balance sheet. |
| (2) | The corporate equity securities are classified as part of the other long-term assets in the consolidated balance sheet. |
The amount of cash and cash equivalents as of December 31, 2010 includes $1.1 billion in cash deposited with commercial banks, of which $425 million are time deposits.
91
The following table sets forth the financial assets and liabilities, measured at fair value, by level within the fair value hierarchy as of December 31, 2011 (in thousands):
| Fair Value Measurements at Reporting Date Using | ||||||||||||
| Assets |
Level 1 | Level 2 | Total | |||||||||
| Money market funds(1) |
$ | 418,338 | $ | | $ | 418,338 | ||||||
| Available-for-sale securities: |
||||||||||||
| Government and agency securities(1) |
| 617,316 | 617,316 | |||||||||
| Commercial paper and bank certificates of deposit(1) |
| 47,904 | 47,904 | |||||||||
| Corporate debt securities(1) |
| 318,805 | 318,805 | |||||||||
|
|
|
|
|
|
|
|||||||
| Available-for-sale securities at fair value |
$ | 418,338 | $ | 984,025 | $ | 1,402,363 | ||||||
| Corporate equity securities(2) |
783 | | 783 | |||||||||
| Liabilities |
||||||||||||
| Foreign currency derivative contracts(3) |
| (2,817 | ) | (2,817 | ) | |||||||
|
|
|
|
|
|
|
|||||||
| Total assets and liabilities at fair value |
$ | 419,121 | $ | 981,208 | $ | 1,400,329 | ||||||
|
|
|
|
|
|
|
|||||||
| (1) | The money market funds, government and agency securities, commercial paper and bank certificates of deposit, and corporate debt securities are classified as part of either cash and cash equivalents or investments in marketable debt securities in the consolidated balance sheet. |
| (2) | The corporate equity securities are classified as part of the other long-term assets in the consolidated balance sheet. |
| (3) | Foreign currency derivative contracts are classified as part of either other current assets or other current liabilities in the consolidated balance sheet. |
The amount of cash and cash equivalents as of December 31, 2011 includes $1.1 billion in cash deposited with commercial banks, of which $217 million are time deposits.
The fair values of the Companys Level 1 financial assets are based on quoted market prices of the identical underlying security. The fair values of the Companys Level 2 financial assets and liabilities are obtained from readily-available pricing sources for the identical underlying security that may not be actively traded. The Company utilizes a pricing service to assist in obtaining fair value pricing for the majority of its Level 2 investment portfolio. The Company conducts reviews on a quarterly basis to verify pricing, assess liquidity, and determine if significant inputs have changed that would impact the fair value hierarchy disclosure. During the year ended December 31, 2011, the Company did not make significant transfers between Level 1 and Level 2 assets. As of December 31, 2010 and December 31, 2011, the Company did not have any significant Level 3 financial assets.
Note 9 INCOME TAXES
The components of income before income taxes and earnings in equity interests are as follows (in thousands):
| Years Ended December 31, | ||||||||||||
| 2009 | 2010 | 2011 | ||||||||||
| United States |
$ | 387,212 | $ | 872,042 | $ | 533,262 | ||||||
| Foreign |
187,008 | 198,351 | 294,254 | |||||||||
|
|
|
|
|
|
|
|||||||
| Income before provision for income taxes and earnings in equity interests |
$ | 574,220 | $ | 1,070,393 | $ | 827,516 | ||||||
|
|
|
|
|
|
|
|||||||
92
The provision (benefit) for income taxes is composed of the following (in thousands):
| Years Ended December 31, | ||||||||||||
| 2009 | 2010 | 2011 | ||||||||||
| Current: |
||||||||||||
| United States federal |
$ | 191,845 | $ | 26,342 | $ | 141,922 | ||||||
| State |
51,662 | 39,258 | (11,037 | ) | ||||||||
| Foreign |
66,376 | 43,341 | 40,490 | |||||||||
|
|
|
|
|
|
|
|||||||
| Total current provision for income taxes |
309,883 | 108,941 | 171,375 | |||||||||
|
|
|
|
|
|
|
|||||||
| Deferred: |
||||||||||||
| United States federal |
(32,385 | ) | 67,621 | 77,012 | ||||||||
| State |
(58,660 | ) | 37,438 | (4,437 | ) | |||||||
| Foreign |
483 | 7,523 | (2,183 | ) | ||||||||
|
|
|
|
|
|
|
|||||||
| Total deferred (benefit) provision for income taxes |
(90,562 | ) | 112,582 | 70,392 | ||||||||
|
|
|
|
|
|
|
|||||||
| Provision for income taxes |
$ | 219,321 | $ | 221,523 | $ | 241,767 | ||||||
|
|
|
|
|
|
|
|||||||
The provision for income taxes differs from the amount computed by applying the federal statutory income tax rate to income before provision for income taxes and earnings in equity interests as follows (in thousands):
| Years Ended December 31, | ||||||||||||
| 2009 | 2010 | 2011 | ||||||||||
| Income tax at the U.S. federal statutory rate of 35 percent |
$ | 200,976 | $ | 374,638 | $ | 289,630 | ||||||
| State income taxes, net of federal benefit |
(4,549 | ) | 54,268 | 4,627 | ||||||||
| Change in valuation allowance |
13,521 | (1,315 | ) | (5,975 | ) | |||||||
| Stock-based compensation expense |
28,322 | 4,404 | 18,213 | |||||||||
| Research tax credits |
(11,046 | ) | (10,345 | ) | (10,499 | ) | ||||||
| Effect of non-U.S. operations |
20,126 | (17,344 | ) | (42,806 | ) | |||||||
| Resolution with tax authorities |
| (159,168 | ) | (14,685 | ) | |||||||
| Tax gain in excess of book gain from sales of Zimbra, Inc. and HotJobs due to basis differences |
| 23,184 | | |||||||||
| Tax restructuring |
(25,583 | ) | (43,361 | ) | | |||||||
| Other |
(2,446 | ) | (3,438 | ) | 3,262 | |||||||
|
|
|
|
|
|
|
|||||||
| Provision for income taxes |
$ | 219,321 | $ | 221,523 | $ | 241,767 | ||||||
|
|
|
|
|
|
|
|||||||
The 2011 differences above are further explained as follows:
| | State taxes were higher in 2010 due to a reduction of deferred tax assets associated with an effective tax rate reduction in California that started in 2011. |
| | Stock-based compensation increases the Companys effective tax rate to the extent that stock-based compensation expense is recorded in the Companys financial statements is non-deductible for tax purposes. This primarily occurs with regard to options granted outside the U.S. |
| | The Companys effective tax rate in all periods is the result of the mix of income earned in various tax jurisdictions that apply a broad range of income tax rates. In 2011, the Company received tax rulings in foreign jurisdictions that provided favorable tax treatments. |
| | In 2010, the Company had a favorable resolution of certain issues in an IRS examination of its 2005 and 2006 U.S. federal income tax returns resulting in a reduction of reserves for tax uncertainties and the availability of capital loss carryforwards to offset the tax on the gain from the sales of Zimbra, Inc. and HotJobs. In 2011, the Company reached agreements with certain state tax authorities in connection with adjustments to income tax returns for years prior to 2009. |
93
| | During 2010, in connection with tax restructuring activities, the Company reached a formal agreement with the IRS through a pre-filing agreement to treat certain intercompany bad debts as deductible business expenses on the 2009 federal income tax return. |
Deferred income taxes reflect the tax effects of temporary differences between the carrying amounts of assets and liabilities for financial reporting purposes and the amounts used for income tax purposes. The components of deferred income tax assets and liabilities are as follows (in thousands):
| December 31, | ||||||||
| 2010 | 2011 | |||||||
| Deferred income tax assets: |
||||||||
| Net operating loss and tax credit carryforwards |
$ | 152,138 | $ | 152,810 | ||||
| Stock-based compensation expense |
178,294 | 143,799 | ||||||
| Non-deductible reserves and expenses |
166,015 | 79,240 | ||||||
| Intangible assets |
9,283 | 6,632 | ||||||
|
|
|
|
|
|||||
| Gross deferred income tax assets |
505,730 | 382,481 | ||||||
| Valuation allowance |
(60,176 | ) | (53,140 | ) | ||||
|
|
|
|
|
|||||
| Deferred income tax assets |
$ | 445,554 | $ | 329,341 | ||||
|
|
|
|
|
|||||
| Deferred income tax liabilities: |
||||||||
| Unrealized investment gains |
$ | 3,192 | $ | 3,497 | ||||
| Purchased intangible assets |
(11,050 | ) | (36,127 | ) | ||||
| Investments in equity interests |
(447,022 | ) | (535,396 | ) | ||||
|
|
|
|
|
|||||
| Deferred income tax liabilities |
$ | (454,880 | ) | $ | (568,026 | ) | ||
|
|
|
|
|
|||||
| Net deferred income tax liabilities |
$ | (9,326 | ) | $ | (238,685 | ) | ||
|
|
|
|
|
|||||
As of December 31, 2011, the Companys federal and state net operating loss carryforwards for income tax purposes were approximately $175 million and $141 million, respectively. The federal and state net operating loss carryforwards are subject to various limitations under Section 382 of the Internal Revenue Code and applicable state tax law. If not utilized, the federal and state net operating loss carryforwards will begin to expire in 2021. The Companys federal and state research tax credit carryforwards for income tax purposes are approximately $70 million and $185 million, respectively. If not utilized, the federal research tax credit carryforwards will begin to expire in 2019. The state research tax credit can be carried forward indefinitely. Federal and state net operating loss and tax credit carryforwards that result from the exercise of employee stock options are not recorded on the Companys consolidated balance sheets. Federal and state net operating loss and tax credit carryforwards that result from the exercise of employee stock options are accounted for as a credit to additional paid-in capital if and when realized through a reduction in income taxes payable.
The Company has a valuation allowance of approximately $53 million as of December 31, 2011 against certain deferred income tax assets that are not more likely than not to be realized in future periods. In evaluating the Companys ability to realize its deferred income tax assets, the Company considers all available positive and negative evidence, including operating results, ongoing tax planning, and forecasts of future taxable income on a jurisdiction by jurisdiction basis. The valuation allowance as of December 31, 2011 relates primarily to foreign net operating loss and credit carryforwards that will reduce the provision for income taxes if and when recognized.
The Company provides U.S. income taxes on the earnings of foreign subsidiaries unless the subsidiaries earnings are considered indefinitely reinvested outside the U.S. As of December 31, 2011, U.S. income taxes were not provided for on a cumulative total of $3.2 billion of undistributed earnings for certain foreign subsidiaries and a corporate joint venture. If these earnings were to be repatriated, the Company would be subject to additional U.S. income taxes (subject to an adjustment for foreign tax credits). It is not practicable to determine the income tax liability that might be incurred if these earnings were to be repatriated.
94
The total amount of gross unrecognized tax benefits was $533 million as of December 31, 2011, of which up to $427 million would affect the Companys effective tax rate if realized. A reconciliation of the beginning and ending amount of unrecognized tax benefits in 2010 and 2011 is as follows (in thousands):
| 2010 | 2011 | |||||||
| Unrecognized tax benefits balance at January 1 |
$ | 893,475 | $ | 597,055 | ||||
| Gross increase for tax positions of prior years |
44,978 | 21,001 | ||||||
| Gross decrease for tax positions of prior years |
(370,363 | ) | (111,597 | ) | ||||
| Gross increase for tax positions of current year |
48,570 | 37,966 | ||||||
| Settlements |
(19,293 | ) | (9,617 | ) | ||||
| Lapse of statute of limitations |
(312 | ) | (1,946 | ) | ||||
|
|
|
|
|
|||||
| Unrecognized tax benefits balance at December 31 |
$ | 597,055 | $ | 532,862 | ||||
|
|
|
|
|
|||||
The total unrecognized tax benefits as of December 31, 2010 and 2011 include approximately $193 million and $139 million, respectively, of unrecognized tax benefits that have been netted against the related deferred tax assets. The remaining balances are recorded on the Companys consolidated balance sheets as follows (in thousands):
| December 31, | ||||||||
| 2010 | 2011 | |||||||
| Total unrecognized tax benefits balance |
$ | 597,055 | $ | 532,862 | ||||
| Amounts netted against related deferred tax assets |
(193,275 | ) | (139,258 | ) | ||||
|
|
|
|
|
|||||
| Unrecognized tax benefits recorded on consolidated balance sheets |
$ | 403,780 | $ | 393,604 | ||||
|
|
|
|
|
|||||
| Amounts classified as accrued expenses and other current liabilities |
$ | 111,997 | $ | | ||||
| Amounts classified as deferred and other long-term tax liabilities, net |
291,783 | 393,604 | ||||||
|
|
|
|
|
|||||
| Unrecognized tax benefits recorded on consolidated balance sheets |
$ | 403,780 | $ | 393,604 | ||||
|
|
|
|
|
|||||
The Company recognizes interest and/or penalties related to uncertain tax positions in income tax expense. To the extent accrued interest and penalties do not ultimately become payable, amounts accrued will be reduced and reflected as a reduction of the overall income tax provision in the period that such determination is made. During 2010 and 2011, interest and penalties recorded in the consolidated statements of income were an increase of $4 million and a decrease of $2 million, respectively. The amounts of accrued interest and penalties recorded on the consolidated balance sheets as of December 31, 2010 and 2011 were approximately $16 million and $14 million, respectively.
The Company files income tax returns in the U.S. federal jurisdiction and in many U.S. states and foreign jurisdictions. The tax years 1995 to 2010 remain open to examination by the major taxing jurisdictions in which the Company is subject to tax.
During the last quarter of 2011, the Company commenced discussions with the IRS Appeals Division to settle the contested adjustments for certain intercompany transfer pricing matters from the 2005 and 2006 income tax examination. While no agreement has been reached, the discussions are proceeding. If the matter is resolved on the basis that is currently being discussed with the IRS, then the settlement will not cause the Company to have tax exposure beyond what has already been provided. In addition, the Companys 2007 and 2008 U.S. income tax returns are still under IRS examination.
As of December 31, 2011, the Company was also under audit by the California Franchise Tax Board for its 2005 and 2006 tax returns. The Company believes its existing reserves for all tax matters are adequate.
The Company is in various stages of the examination and appeals process in connection with taxes in foreign jurisdictions and it is difficult to determine when these examinations will be settled. It is reasonably possible that over the next twelve-month period the Company may experience an increase or decrease in its unrecognized tax benefits. It is not possible to determine either the magnitude or the range of any increase or decrease at this time.
95
Note 10 STOCKHOLDERS EQUITY
The Board has the authority to issue up to 10 million shares of Preferred Stock and to determine the price, rights, preferences, privileges, and restrictions, including voting rights, of those shares without any further vote or action by the stockholders.
Stock Repurchases. The Company repurchases its common stock from time to time in part to reduce the dilutive effects of its stock options, awards, and employee stock purchase plan.
In October 2006, the Board authorized a stock repurchase program allowing the Company to repurchase up to $3 billion of its outstanding shares of common stock from time to time over the five-year period following its authorization, dependent on market conditions, stock price, and other factors. Under the program, repurchases could take place in the open market or in privately negotiated transactions, including derivative transactions, and could be made under a Rule 10b5-1 plan. The Company exhausted its authority to repurchase shares of the Companys common stock under this program in July 2010.
On June 24, 2010, the Board approved a new stock repurchase program. Under the new program, which expires in June 2013, the Company is authorized to repurchase up to $3 billion of its outstanding shares of common stock from time to time. The repurchases may take place in the open market or in privately negotiated transactions, including derivative transactions, and may be made under a Rule 10b5-1 plan.
Under the October 2006 program, in the year ended December 31, 2009, the Company repurchased 7 million shares of common stock directly at an average price of $15.31 per share, for total consideration of $113 million. During the year ended December 31, 2010, 63 million shares were repurchased under the October 2006 program for a total of $973 million, which exhausted the repurchase under the October 2006 program, and 56 million shares were repurchased under the June 2010 program for a total of $776 million, resulting in aggregate repurchases during the period of 119 million shares for a total of $1,749 million at an average price of $14.68 per share. During the year ended December 31, 2011, 110 million shares were repurchased under the June 2010 program for a total of $1,619 million at an average price of $14.75 per share. As of December 31, 2011, the June 2010 program had remaining authorized purchase capacity of $605 million.
During the year ended December 31, 2010, the Company had repurchased and retired 335 million shares, resulting in reductions of $0.3 million in common stock, $2.5 billion in additional paid-in capital, and $4.6 billion in retained earnings. During the year ended December 31, 2011, the Company has repurchased and retired 82 million shares, resulting in reductions of $82 thousand in common stock, $643 million in additional paid-in capital, and $559 million in retained earnings. Treasury stock is accounted for under the cost method.
Note 11 EMPLOYEE BENEFITS
Benefit Plans. The Company maintains the Yahoo! Inc. 401(k) Plan (the 401(k) Plan) for its full-time employees in the U.S. The 401(k) Plan allows employees of the Company to contribute up to the Internal Revenue Code prescribed maximum amount. Employees may elect to contribute from 1 to 50 percent of their annual compensation to the 401(k) Plan. The Company matches employee contributions at a rate of 25 percent, up to the IRS prescribed amount. For 2009, employee contributions were fully vested, whereas vesting in matching Company contributions occurred at a rate of 33 percent per year of employment. Beginning in 2010, both employee and employer contributions vest immediately upon contribution. During 2009, 2010, and 2011, the Companys contributions to the 401(k) Plan amounted to approximately $18 million, $21 million, and $20 million, respectively. The Company also contributed approximately $20 million, $23 million, and $24 million to its other retirement benefit plans outside of the U.S. for 2009, 2010, and 2011, respectively.
Stock Plans. The 1995 Stock Plan provides for the issuance of stock-based awards to employees, including executive officers, and consultants. The 1995 Stock Plan permits the granting of incentive stock options, non-statutory stock options, restricted stock, restricted stock units, stock appreciation rights, and dividend equivalents.
96
Options granted under the 1995 Stock Plan before May 19, 2005 generally expire 10 years after the grant date, and options granted after May 19, 2005 generally expire seven years after the grant date. Options generally become exercisable over a four-year period based on continued employment and vest either monthly, quarterly, semi-annually, or annually.
The 1995 Stock Plan permits the granting of restricted stock and restricted stock units (collectively referred to as restricted stock awards). The restricted stock award vesting criteria are generally the passing of time, meeting certain performance-based objectives, or a combination of both, and continued employment through the vesting period (which varies but generally does not exceed four years). Restricted stock award grants are generally measured at fair value on the date of grant based on the number of shares granted and the quoted price of the Companys common stock. Such value is recognized as an expense over the corresponding service period.
The 1995 Stock Plan provides for the issuance of a maximum of 754 million shares of which 109 million shares were still available for issuance as of December 31, 2011. Each share of the Companys common stock issued in settlement of full-value awards (which include all awards other than options and stock appreciation rights) granted on or after June 25, 2009 under the 1995 Stock Plan is counted as 1.75 shares against the 1995 Stock Plans share limit.
The Directors Plan provides for the grant of nonqualified stock options and restricted stock units to non-employee directors of the Company. The Directors Plan provides for the issuance of up to 8.8 million shares of the Companys common stock, of which approximately 5 million were still available for issuance as of December 31, 2011. Each share of the Companys common stock issued in settlement of restricted stock units granted after the 2006 annual meeting of shareholders under the Directors Plan is counted as 1.75 shares against the Directors Plans share limit.
Options granted under the Directors Plan before May 25, 2006 generally become exercisable, based on continued service as a director, for initial grants to new directors, in equal monthly installments over four years, and for annual grants, with 25 percent of such options vesting on the one year anniversary of the date of grant and the remaining options vesting in equal monthly installments over the remaining 36-month period thereafter. Such options generally expire seven to 10 years after the grant date. Options granted on or after May 25, 2006 become exercisable, based on continued service as a director, in equal quarterly installments over one year. Such options generally expire seven years after the grant date.
Restricted stock units granted under the Directors Plan generally vest in equal quarterly installments over a one-year period following the date of grant and, once vested, are generally payable in an equal number of shares of the Companys common stock on the earlier of the end of the one-year vesting period or the date the director ceases to be a member of the Board (subject to any deferral election that may be made by the director).
Non-employee directors are also permitted to elect an award of restricted stock units or a stock option under the Directors Plan in lieu of a cash payment of fees for serving as chairperson of a committee of the Board. Such stock options or restricted stock unit awards granted in lieu of cash for chairperson fees are fully vested on the grant date.
Employee Stock Purchase Plan. The Companys 1996 Employee Stock Purchase Plan (the Employee Stock Purchase Plan) allows employees to purchase shares of the Companys common stock through payroll deductions of up to 15 percent of their annual compensation subject to certain Internal Revenue Code limitations. The price of common stock purchased under the plan is equal to 85 percent of the lower of the fair market value of the common stock on the commencement date of each 24-month offering period or the specified purchase date.
The Employee Stock Purchase Plan provides for the issuance of a maximum of 75 million shares of common stock of which 25 million shares were available as of December 31, 2011. For the years ended December 31, 2009, 2010, and 2011, stock-based compensation expense related to the activity under the plan was $55 million,
97
$26 million, and $46 million, respectively. As of December 31, 2011, there was $46 million of unamortized stock-based compensation cost related to the Employee Stock Purchase Plan which will be recognized over a weighted average period of 1.3 years.
The Companys 1995 Stock Plan, the Directors Plan, and other stock-based award plans assumed through acquisitions are collectively referred to as the Plans. Stock option activity under the Companys Plans is summarized as follows (in thousands, except years and per share amounts):
| Shares | Weighted Average Exercise Price per Share |
Weighted Average Remaining Contractual Life (in years) |
Aggregate Intrinsic Value |
|||||||||||||
| Outstanding at December 31, 2010 |
80,976 | $ | 22.02 | 3.87 | $ | 147,887 | ||||||||||
| Options granted |
6,838 | $ | 16.30 | |||||||||||||
| Options assumed |
992 | $ | 8.07 | |||||||||||||
| Options exercised(1) |
(7,279 | ) | $ | 9.84 | ||||||||||||
| Options cancelled/forfeited |
(6,521 | ) | $ | 15.45 | ||||||||||||
| Options expired |
(12,567 | ) | $ | 28.70 | ||||||||||||
|
|
|
|
|
|||||||||||||
| Outstanding at December 31, 2011 |
62,439 | $ | 21.94 | 3.07 | $ | 80,211 | ||||||||||
|
|
|
|
|
|
|
|
|
|||||||||
| Vested and expected to vest at December 31, 2011(2) |
60,279 | $ | 21.98 | 2.97 | $ | 77,136 | ||||||||||
|
|
|
|
|
|
|
|
|
|||||||||
| Exercisable at December 31, 2011 |
45,396 | $ | 24.38 | 2.21 | $ | 49,840 | ||||||||||
|
|
|
|
|
|
|
|
|
|||||||||
| (1) | The Company issued new shares to satisfy stock option exercises. |
| (2) | The expected to vest options are the result of applying the pre-vesting forfeiture rate assumptions to total outstanding options. |
The weighted average grant date fair value of options granted in the years ended December 31, 2009, 2010, and 2011 was $5.59, $5.27, and $5.04 per share, respectively.
The aggregate intrinsic value in the table above represents the total pre-tax intrinsic value (the aggregate difference between the closing stock price of the Companys common stock on December 31, 2011 and the exercise price for in-the-money options) that would have been received by the option holders if all in-the-money options had been exercised on December 31, 2011.
The total intrinsic value of options exercised in the years ended December 31, 2009, 2010, and 2011 was $51 million, $49 million, and $46 million, respectively.
As of December 31, 2011, there was $67 million of unamortized stock-based compensation expense related to unvested stock options, which is expected to be recognized over a weighted average period of 2.0 years.
Cash received from option exercises and purchases of shares under the Employee Stock Purchase Plan for the year ended December 31, 2011 was $156 million.
The total net tax benefit attributable to stock options exercised in the year ended December 31, 2011 was $58 million.
98
The fair value of option grants is determined using the Black-Scholes option pricing model with the following weighted average assumptions:
| Stock Options | Purchase Plans(5) | |||||||||||||||||||||||
| Years Ended December 31, | Years Ended December 31, | |||||||||||||||||||||||
| 2009 | 2010 | 2011 | 2009 | 2010 | 2011 | |||||||||||||||||||
| Expected dividend yield(1) |
0.0 | % | 0.0 | % | 0.0 | % | 0.0 | % | 0.0 | % | 0.0 | % | ||||||||||||
| Risk-free interest rate(2) |
1.9 | % | 1.6 | % | 1.3 | % | 2.7 | % | 2.1 | % | 1.3 | % | ||||||||||||
| Expected volatility(3) |
45.8 | % | 34.7 | % | 36.9 | % | 63.2 | % | 60.5 | % | 35.6 | % | ||||||||||||
| Expected life (in years)(4) |
4.00 | 4.06 | 4.03 | 1.04 | 0.55 | 1.04 | ||||||||||||||||||
| (1) | The Company currently has no history or expectation of paying cash dividends on its common stock. |
| (2) | The risk-free interest rate is based on the U.S. Treasury yield for a term consistent with the expected term of the awards in effect at the time of grant. |
| (3) | The Company estimates the volatility of its common stock at the date of grant based on the implied volatility of publicly traded options on its common stock, with a term of one year or greater. |
| (4) | The expected life of stock options granted under the Plans is based on historical exercise patterns, which the Company believes are representative of future behavior. New grants issued by the Company had an expected life of 4 years in 2009, 4.5 years in 2010, and 4.25 years in 2011. Options assumed in acquisitions had expected lives of less than 4 years. The expected life of options granted under the Employee Stock Purchase Plan represents the amount of time remaining in the 24-month offering period. |
| (5) | Assumptions for the Employee Stock Purchase Plan relate to the annual average of the enrollment periods. Enrollment is currently permitted in May and November of each year. |
Restricted stock awards activity for the year ended December 31, 2011 is summarized as follows (in thousands, except per share amounts):
| Shares | Weighted Average Grant Date Fair Value |
|||||||
| Awarded and unvested at December 31, 2010 |
31,395 | $ | 17.99 | |||||
| Granted |
25,044 | $ | 15.83 | |||||
| Assumed |
466 | $ | 15.74 | |||||
| Vested |
(7,913 | ) | $ | 17.19 | ||||
| Forfeited |
(10,217 | ) | $ | 15.91 | ||||
|
|
|
|
|
|||||
| Awarded and unvested at December 31, 2011 |
38,775 | $ | 17.28 | |||||
|
|
|
|
|
|||||
As of December 31, 2011, there was $287 million of unamortized stock-based compensation cost related to unvested restricted stock awards, which is expected to be recognized over a weighted average period of 2.3 years. The total fair value of restricted stock awards vested during the years ended December 31, 2009, 2010, and 2011 was $375 million, $195 million, and $136 million, respectively.
During the year ended December 31, 2011, 7.9 million shares subject to previously granted restricted stock awards and restricted stock units vested. A majority of these vested restricted stock awards and restricted stock units were net share settled. The Company withheld 2.8 million shares based upon the Companys closing stock price on the vesting date to settle the employees minimum statutory obligation for the applicable income and other employment taxes. The Company then remitted cash to the appropriate taxing authorities.
Total payments for the employees tax obligations to the relevant taxing authorities were $45 million for the year ended December 31, 2011 and are reflected as a financing activity within the consolidated statements of cash flows. The payments were used for tax withholdings related to the net share settlements of restricted stock units.
99
The payments had the effect of share repurchases by the Company as they reduced the number of shares that would have otherwise been issued on the vesting date and were recorded as a reduction of additional paid-in capital.
In 2009, 2010, and 2011, $108 million, $131 million, and $71 million, respectively, of excess tax benefits from stock-based awards for options exercised in current and prior periods were included as a source of cash flows from financing activities. These excess tax benefits represent the reduction in income taxes otherwise payable during the period, attributable to the actual gross tax benefits in excess of the expected tax benefits for options exercised in current and prior periods. The Company has accumulated excess tax deductions relating to stock options exercised prior to January 1, 2006 available to reduce income taxes otherwise payable. To the extent such deductions reduce income taxes payable in the current year, they are reported as financing activities in the consolidated statements of cash flows.
Performance-Based Executive Incentive Restricted Stock Units. In February 2009 and February 2010, the Compensation Committee approved long-term performance-based incentive equity awards to senior officers, including two types of restricted stock units that vest based on the Companys achievement of certain performance goals. For both types of awards, the number of shares which ultimately vest will range from 0 percent to 200 percent of the target amount stated in each executives award agreement based on the performance of the Company relative to the applicable performance targets. The first type of award consists of restricted stock units which generally are scheduled to vest on the third anniversary of the grant date based on the Companys attainment of certain annual financial performance targets in each of the three fiscal years covered by the award as well as the executives continued employment through that vesting date. The annual financial performance targets are established at the beginning of each fiscal year and, accordingly, the portion (or tranche) of the award subject to each annual target is treated as a separate annual grant for accounting purposes. Based on the Companys relative attainment of the 2009 performance target, 75 percent of the target amount of the 2009 tranche shares will vest, provided the executive remains employed through the third anniversary of the initial grant date. Based on the Companys relative attainment of the 2010 performance target, 119 percent of the target amount of the 2010 tranches of the 2009 and 2010 awards will vest, provided the executive remains employed through the third anniversary of the initial grant date. Based on the Companys relative attainment of the 2011 performance target, 50 percent of the target amount of the 2011 tranches of the 2009 and 2010 awards will vest, provided the executive remains employed through the third anniversary of the initial grant date. The amount of stock-based compensation recorded for these restricted stock units will vary depending on the Companys attainment of the financial performance targets and each executives completion of the service period. The grant date fair values of the 2011 tranches of the 2009 and 2010 awards are $2 million and $3 million, respectively, and are being recognized as stock-based compensation expense over one-year and two-year remaining service periods, respectively. The second type of award consists of restricted stock units that generally were scheduled to vest following the third anniversary of the grant date depending on the Companys attainment of certain levels of total stockholder return relative to the returns for the NASDAQ 100 Index companies during that three-year period as well as the executives continued employment through that vesting date.
In February 2011, the Compensation Committee approved a long-term performance-based incentive equity award to senior officers in the form of restricted stock units that generally are scheduled to vest on the third anniversary of the grant date based on the Companys attainment of certain financial performance targets for 2011 as well as the executives continued employment through the vesting date. Based on the Companys relative attainment of the 2011 performance target, 50 percent of the target amount of these awards will vest, provided the executive remains employed through the third anniversary of the grant date. The grant date fair value of these restricted stock unit grants is $32 million and is being recognized as stock-based compensation expense over a three-year service period.
100
Note 12 COMMITMENTS AND CONTINGENCIES
Lease Commitments. The Company leases office space and data centers under operating and capital lease agreements with original lease periods up to 13 years which expire between 2011 and 2022.
In 2008, the Company entered into an 11-year lease agreement for a data center in the western U.S. Of the total expected minimum lease commitment of $105 million, $21 million was classified as an operating lease for real estate and $84 million was classified as a capital lease for equipment. As of December 31, 2011, the Company had total expected and remaining minimum lease commitments of approximately $79 million over the lease term. The Company has the option to renew this lease for up to an additional 10 years.
During the second quarter of 2010, the Company acquired certain office space for a total of $72 million ($7 million in cash and the assumption of $65 million in debt). In the first quarter of 2010, the property was reclassified from an operating lease to a capital lease as a result of a commitment to purchase the property. Accordingly, in the second quarter the Company reduced the capital lease obligation for the $7 million cash outlay and reclassified the remaining $65 million as assumed debt in its consolidated balance sheets.
Rent expense for all operating leases was approximately $90 million, $81 million, and $84 million for 2009, 2010, and 2011, respectively.
Many of the Companys leases contain one or more of the following options which the Company can exercise at the end of the initial lease term: (i) renewal of the lease for a defined number of years at the then fair market rental rate or at a slight discount to the fair market rental rate; (ii) purchase of the property at the then fair market value; or (iii) right of first offer to lease additional space that becomes available.
Gross and net lease commitments as of December 31, 2011 can be summarized as follows (in millions):
| Gross Operating Lease Commitments |
Sublease Income |
Net Operating Lease Commitments |
||||||||||
| Years ending December 31, |
||||||||||||
| 2012 |
$ | 158 | $ | (11 | ) | $ | 147 | |||||
| 2013 |
132 | (11 | ) | 121 | ||||||||
| 2014 |
103 | (10 | ) | 93 | ||||||||
| 2015 |
79 | (7 | ) | 72 | ||||||||
| 2016 |
43 | (1 | ) | 42 | ||||||||
| Due after 5 years |
66 | | 66 | |||||||||
|
|
|
|
|
|
|
|||||||
| Total gross and net lease commitments |
$ | 581 | $ | (40 | ) | $ | 541 | |||||
|
|
|
|
|
|
|
|||||||
| Capital Lease Commitment |
||||
| Years ending December 31, |
||||
| 2012 |
$ | 9 | ||
| 2013 |
8 | |||
| 2014 |
8 | |||
| 2015 |
8 | |||
| 2016 |
8 | |||
| Due after 5 years |
23 | |||
|
|
|
|||
| Gross lease commitment |
$ | 64 | ||
|
|
|
|||
| Less: interest |
(23 | ) | ||
|
|
|
|||
| Net lease commitment included in capital lease and other long-term liabilities |
$ | 41 | ||
|
|
|
|||
101
Affiliate Commitments. In connection with contracts to provide advertising services to Affiliates, the Company is obligated to make payments, which represent TAC, to its Affiliates. As of December 31, 2011, these commitments totaled $166 million, of which $91 million will be payable in 2012 and $75 million will be payable in 2013.
Non-cancelable Obligations. The Company is obligated to make payments under various non-cancelable arrangements with vendors and other business partners, principally for marketing, bandwidth, co-location, and content arrangements. As of December 31, 2011, these commitments totaled $228 million, of which $110 million will be payable in 2012, $66 million will be payable in 2013, $20 million will be payable in 2014, $6 million will be payable in 2015, $6 million will be payable in 2016, and $20 million will be payable thereafter.
Intellectual Property Rights. The Company is committed to make certain payments under various intellectual property arrangements of up to $34 million through 2023.
Other Commitments. In the ordinary course of business, the Company may provide indemnifications of varying scope and terms to customers, vendors, lessors, joint ventures and business partners, purchasers of assets or subsidiaries and other parties with respect to certain matters, including, but not limited to, losses arising out of the Companys breach of agreements or representations and warranties made by the Company, services to be provided by the Company, intellectual property infringement claims made by third parties or, with respect to the sale of assets or a subsidiary, matters related to the Companys conduct of the business and tax matters prior to the sale. In addition, the Company has entered into indemnification agreements with its directors and certain of its officers that will require the Company, among other things, to indemnify them against certain liabilities that may arise by reason of their status or service as directors or officers. The Company has also agreed to indemnify certain former officers, directors, and employees of acquired companies in connection with the acquisition of such companies. The Company maintains director and officer insurance, which may cover certain liabilities arising from its obligation to indemnify its directors and officers, and former directors and officers of acquired companies, in certain circumstances. It is not possible to determine the aggregate maximum potential loss under these indemnification agreements due to the limited history of prior indemnification claims and the unique facts and circumstances involved in each particular agreement. Such indemnification agreements might not be subject to maximum loss clauses. Historically, the Company has not incurred material costs as a result of obligations under these agreements and it has not accrued any liabilities related to such indemnification obligations in the Companys consolidated financial statements.
As of December 31, 2011, the Company did not have any relationships with unconsolidated entities or financial partnerships, such as entities often referred to as structured finance or special purpose entities, which would have been established for the purpose of facilitating off-balance sheet arrangements or other contractually narrow or limited purposes. As such, the Company is not exposed to any financing, liquidity, market, or credit risk that could arise if the Company had engaged in such relationships. In addition, the Company identified no variable interests currently held in entities for which it is the primary beneficiary.
See Note 16Search Agreement with Microsoft Corporation for a description of the Companys Search and Advertising Services and Sales Agreement (the Search Agreement) and License Agreement with Microsoft Corporation (Microsoft).
Contingencies. From time to time, third parties assert patent infringement claims against Yahoo!. Currently, the Company is engaged in lawsuits regarding patent issues and has been notified of other potential patent disputes. In addition, from time to time, the Company is subject to other legal proceedings and claims in the ordinary course of business, including claims of alleged infringement of trademarks, copyrights, trade secrets, and other intellectual property rights, claims related to employment matters, and a variety of other claims, including claims alleging defamation, invasion of privacy, or similar claims arising in connection with the Companys e-mail, message boards, photo and video sites, auction sites, shopping services, and other communications and community features.
102
On July 12, 2001, the first of several purported securities class action lawsuits was filed in the U.S. District Court for the Southern District of New York against certain underwriters involved in Overture Services Inc.s (Overture) IPO, Overture, and certain of Overtures former officers and directors. The Court consolidated the cases against Overture. Plaintiffs allege, among other things, violations of the Securities Act of 1933 and the Securities Exchange Act of 1934 (the Exchange Act) involving undisclosed compensation to the underwriters, and improper practices by the underwriters, and seek unspecified damages. Similar complaints were filed in the same court against numerous public companies that conducted IPOs of their common stock since the mid-1990s. All of these lawsuits were consolidated. On October 5, 2009, the Court granted class certification and granted final approval of a stipulated global settlement and plan of allocation. On October 6, 2010, various individuals objecting to the settlement filed opening appeal briefs with the U.S. Court of Appeals for the Second Circuit, and in early February 2011 Yahoo! and other appellees filed reply briefs in support of the settlement. The Second Circuit dismissed one appeal and remanded a second appeal to the District Court for a determination on standing. On remand, the District Court held on August 25, 2011 that the individual objector lacked standing and was not a class member. That ruling was appealed to the Second Circuit and, on January 13, 2012, the Second Circuit approved a stipulation withdrawing the appeal, thereby resolving the remaining objection to the settlement.
On June 14, 2007, a stockholder derivative action was filed in the U.S. District Court for the Central District of California by Jill Watkins against members of the Board and selected officers. The complaint filed by the plaintiff alleged breaches of fiduciary duties and corporate waste, similar to the allegations in a former class action relating to stock price declines during the period April 2004 to July 2006, and alleged violation of Section 10(b) of the Exchange Act. On July 16, 2009, the plaintiff Watkins voluntarily dismissed the action against all defendants without prejudice. On July 17, 2009, plaintiff Miguel Leyte-Vidal, who had substituted in as plaintiff prior to the dismissal of the federal Watkins action, re-filed a stockholder derivative action in Santa Clara County Superior Court against members of the Board and selected officers. The Santa Clara County Superior Court derivative action purports to assert causes of action on behalf of the Company for violation of specified provisions of the California Corporations Code, for breaches of fiduciary duty regarding financial accounting and insider selling and for unjust enrichment. On September 19, 2011, the Court sustained Yahoo!s demurrer to plaintiffs third amended complaint without leave to amend. On December 21, 2011, plaintiff filed a notice of appeal.
Since May 31, 2011, a total of eight stockholder derivative suits were filed either in the Santa Clara County Superior Court or the United States District Court for the Northern District of California purportedly on behalf of Yahoo! stockholders against certain officers and directors of the Company and third parties. The actions allege breaches of fiduciary duties, corporate waste, mismanagement, abuse of control, unjust enrichment, misappropriation of corporate assets, or contribution and seek damages, equitable relief, disgorgement and corporate governance changes in connection with Alibaba Groups restructuring of its subsidiary Alipay and related disclosures. The Santa Clara County actions filed by plaintiffs Cinnoto, Lassoff, Zucker, and Koo were consolidated under the caption In re Yahoo! Inc. Derivative Shareholder Litigation on June 24, 2011 and September 12, 2011 (California Derivative Litigation). On February 1, 2012, the court approved a stipulation to stay the California Derivative Litigation for 180 days. The federal actions filed in the Northern District of California by plaintiffs Salzman, Tawila, and Iron Workers Mid-South Pension Fund were consolidated under the caption In re Yahoo! Inc. Shareholder Derivative Litigation on October 3, 2011 (Federal Derivative Litigation).
Since June 6, 2011, two purported stockholder class actions were filed in the United States District Court for the Northern District of California against the Company and certain officers and directors by plaintiffs Bonato and the Twin Cities Pipe Trades Pension Trust. In October 2011, the District Court consolidated the two actions under the caption In re Yahoo! Inc. Securities Litigation and appointed the Pension Trust Fund for Operating Engineers as lead plaintiff. In a consolidated amended complaint filed December 15, 2011, the lead plaintiff purports to represent a class of investors who purchased the Companys common stock between April 19, 2011 and July 29, 2011, and alleges that during that class period, defendants issued statements that were materially false or misleading because they did not disclose information relating to the restructuring of Alipay. The
103
complaint purports to assert claims for relief for violation of Section 10(b) and 20(a) of the Exchange Act and for violation of Rule 10b-5 thereunder, and seeks unspecified damages, injunctive and equitable relief, fees and costs.
On December 1, 2011 and December 7, 2011, purported class action complaints were filed in the Delaware Chancery Court by M & C Partners, III and Louisiana Municipal Police Employees Retirement System, respectively, against the Company and the members of the Companys board of directors at that time. On December 14, 2011, The Delaware Chancery Court consolidated the two actions under the caption In re Yahoo! Shareholders Litig. and appointed lead plaintiffs. On December 29, 2011, lead plaintiffs filed a consolidated amended class action complaint purportedly on behalf of all of the Companys stockholders alleging that the board of directors breached fiduciary duties by failing to maximize the Companys value in connection with the strategic review process. Plaintiffs seek injunctive relief, rescission, fees and costs.
With respect to the legal proceedings and claims described above, the Company has determined, based on current knowledge, that the amount or range of reasonably possible losses, including reasonably possible losses in excess of amounts already accrued, is not reasonably estimable with respect to certain matters and that the aggregate amount or range of such losses that are estimable would not have a material adverse effect on the Companys consolidated financial position, results of operations or cash flows. Amounts accrued as of December 31, 2010 and December 31, 2011 were not material. The ultimate outcome of legal proceedings involves judgments, estimates and inherent uncertainties, and cannot be predicted with certainty. In the event of a determination adverse to Yahoo!, its subsidiaries, directors, or officers in these matters, however, the Company may incur substantial monetary liability, and be required to change its business practices. Either of these events could have a material adverse effect on the Companys financial position, results of operations, or cash flows. The Company may also incur substantial legal fees, which are expensed as incurred in defending against these claims.
Note 13 SEGMENTS
The Company manages its business geographically. The primary areas of measurement and decision making are the Americas, EMEA (Europe, Middle East and Africa) and Asia Pacific. Management relies on an internal reporting process that provides revenue ex-TAC, which is defined as revenue less TAC, direct costs excluding TAC by segment, and consolidated income from operations for making decisions related to the evaluation of the financial performance of, and allocating resources to, our segments.
104
The following tables present summarized information by segment (in thousands):
| Years Ended December 31, | ||||||||||||
| 2009 | 2010 | 2011 | ||||||||||
| Revenue by segment: |
||||||||||||
| Americas |
$ | 4,852,331 | $ | 4,425,457 | $ | 3,302,989 | ||||||
| EMEA |
598,300 | 579,145 | 629,383 | |||||||||
| Asia Pacific |
1,009,684 | 1,320,049 | 1,051,827 | |||||||||
|
|
|
|
|
|
|
|||||||
| Total revenue |
6,460,315 | 6,324,651 | 4,984,199 | |||||||||
| TAC by segment: |
||||||||||||
| Americas |
1,195,579 | 957,607 | 160,110 | |||||||||
| EMEA |
207,844 | 210,261 | 221,916 | |||||||||
| Asia Pacific |
374,403 | 568,554 | 221,345 | |||||||||
|
|
|
|
|
|
|
|||||||
| Total TAC |
1,777,826 | 1,736,422 | 603,371 | |||||||||
| Revenue ex-TAC by segment: |
||||||||||||
| Americas |
3,656,752 | 3,467,850 | 3,142,879 | |||||||||
| EMEA |
390,456 | 368,884 | 407,467 | |||||||||
| Asia Pacific |
635,281 | 751,495 | 830,482 | |||||||||
|
|
|
|
|
|
|
|||||||
| Total revenue ex-TAC |
4,682,489 | 4,588,229 | 4,380,828 | |||||||||
| Direct costs by segment(1): |
||||||||||||
| Americas |
620,690 | 568,017 | 560,016 | |||||||||
| EMEA |
115,778 | 118,954 | 135,266 | |||||||||
| Asia Pacific |
138,739 | 146,657 | 194,394 | |||||||||
| Global operating costs(2)(3) |
2,116,747 | 2,044,246 | 1,836,569 | |||||||||
| Restructuring charges, net |
126,901 | 57,957 | 24,420 | |||||||||
| Depreciation and amortization |
738,855 | 656,396 | 625,864 | |||||||||
| Stock-based compensation expense |
438,087 | 223,478 | 203,958 | |||||||||
|
|
|
|
|
|
|
|||||||
| Income from operations |
$ | 386,692 | $ | 772,524 | $ | 800,341 | ||||||
|
|
|
|
|
|
|
|||||||
| (1) | Direct costs for each segment include cost of revenue (excluding TAC) and other operating expenses that are directly attributable to the segment such as employee compensation expense (excluding stock-based compensation expense), local sales and marketing expenses, and facilities expenses. Beginning in the fourth quarter of 2010, the Company no longer includes TAC in segment direct costs. For comparison purposes, prior period amounts have been revised to conform to the current presentation. |
| (2) | Global operating costs include product development, service engineering and operations, marketing, customer advocacy, general and administrative, and other corporate expenses that are managed on a global basis and that are not directly attributable to any particular segment. |
| (3) | The net cost reimbursements from Microsoft are primarily included in global operating costs for the years ended December 31, 2010 and 2011. |
| Years Ended December 31, | ||||||||||||
| 2009 | 2010 | 2011 | ||||||||||
| Capital expenditures, net: |
||||||||||||
| Americas |
$ | 379,287 | $ | 563,129 | $ | 437,804 | ||||||
| EMEA |
21,030 | 58,533 | 49,371 | |||||||||
| Asia Pacific |
33,478 | 92,416 | 106,119 | |||||||||
|
|
|
|
|
|
|
|||||||
| Total capital expenditures, net |
$ | 433,795 | $ | 714,078 | $ | 593,294 | ||||||
|
|
|
|
|
|
|
|||||||
105
| December 31, | ||||||||
| 2010 | 2011 | |||||||
| Property and equipment, net: |
||||||||
| Americas |
$ | 1,475,021 | $ | 1,489,096 | ||||
| EMEA |
63,820 | 79,955 | ||||||
| Asia Pacific |
114,581 | 161,837 | ||||||
|
|
|
|
|
|||||
| Total property and equipment, net |
$ | 1,653,422 | $ | 1,730,888 | ||||
|
|
|
|
|
|||||
See also Note 5Goodwill and Note 15Restructuring Charges, Net for additional information regarding segments.
Enterprise Wide Disclosures:
The following table presents revenue for groups of similar services (in thousands):
| Years Ended December 31, | ||||||||||||
| 2009 | 2010 | 2011 | ||||||||||
| Display |
$ | 1,866,984 | $ | 2,154,886 | $ | 2,160,309 | ||||||
| Search |
3,396,396 | 3,161,589 | 1,853,110 | |||||||||
| Other |
1,196,935 | 1,008,176 | 970,780 | |||||||||
|
|
|
|
|
|
|
|||||||
| Total revenue |
$ | 6,460,315 | $ | 6,324,651 | $ | 4,984,199 | ||||||
|
|
|
|
|
|
|
|||||||
| Years Ended December 31, | ||||||||||||
| 2009 | 2010 | 2011 | ||||||||||
| Revenue: |
||||||||||||
| U.S. |
$ | 4,714,436 | $ | 4,259,157 | $ | 3,112,998 | ||||||
| International |
1,745,879 | 2,065,494 | 1,871,201 | |||||||||
|
|
|
|
|
|
|
|||||||
| Total revenue |
$ | 6,460,315 | $ | 6,324,651 | $ | 4,984,199 | ||||||
|
|
|
|
|
|
|
|||||||
Revenue is attributed to individual countries according to the online property that generated the revenue. No single foreign country was material to revenue in 2009, 2010, and 2011, respectively.
| December 31, | ||||||||
| 2010 | 2011 | |||||||
| Property and equipment, net: |
||||||||
| U.S. |
$ | 1,471,536 | $ | 1,486,596 | ||||
| International |
181,886 | 244,292 | ||||||
|
|
|
|
|
|||||
| Total property and equipment, net |
$ | 1,653,422 | $ | 1,730,888 | ||||
|
|
|
|
|
|||||
Note 14 RELATED PARTY TRANSACTIONS
The Company and other third parties are limited partners in Softbank Capital Partners LP (Softbank Capital), a venture capital fund which is an affiliate of Softbank. In July 1999 and March 2000, the Company made investments in Softbank Capital of approximately $30 million and $6 million, respectively, which together represents less than a 5 percent holding in Softbank Capital. Since the Companys initial investment, the Company has impaired its entire investment. Pursuant to the Partnership Agreement of Softbank Capital Partners LP, the Company invested on the same terms and on the same basis as all other limited partners.
Revenue from related parties, excluding Yahoo Japan and Alibaba Group, represented approximately 1 percent of total revenue for the years ended December 31, 2009, 2010, and 2011. Management believes that the terms of the agreements with these related parties are comparable to the terms obtained in arms-length transactions with unrelated similarly situated customers of the Company.
106
See Note 4Investments in Equity Interests for additional information related to transactions involving Yahoo Japan and Alibaba Group.
Note 15 RESTRUCTURING CHARGES, NET
Restructuring charges, net consists of costs associated with the six restructuring activities initiated in 2009, 2010, and 2011. It includes employee severance pay and related costs, accelerations and reversals of stock-based compensation expense, facility restructuring costs, and other non-cash charges associated with the exit of facilities, as well as reversals of restructuring charges arising from changes in estimates.
For the years ended December 31, 2009, 2010, and 2011, restructuring charges, net was comprised of the following (in thousands):
| Years Ended December 31, | ||||||||||||
| 2009 | 2010 | 2011 | ||||||||||
| Employee severance pay and related costs |
$ | 48,696 | $ | 39,652 | $ | 12,965 | ||||||
| Non-cancelable lease, contract terminations, and other charges |
59,285 | 19,737 | 10,251 | |||||||||
| Other non-cash charges |
7,858 | 2,779 | 990 | |||||||||
|
|
|
|
|
|
|
|||||||
| Sub-total before accelerations (reversals) of stock-based compensation expense |
115,839 | 62,168 | 24,206 | |||||||||
| Accelerations (reversals) of stock-based compensation expense |
11,062 | (4,211 | ) | 214 | ||||||||
|
|
|
|
|
|
|
|||||||
| Restructuring charges, net |
$ | 126,901 | $ | 57,957 | $ | 24,420 | ||||||
|
|
|
|
|
|
|
|||||||
Although the Company does not allocate restructuring charges to its segments, the amounts of the restructuring charges relating to each segment are presented below. For the years ended December 31, 2009, 2010, and 2011, restructuring charges, net consists of the following (in thousands):
| Year Ended December 31, 2009 | ||||||||||||||||
| Q408 Restructuring Plan |
Q209 Restructuring Plan |
Q409 Restructuring Charges |
Total | |||||||||||||
| Americas |
$ | 63,247 | $ | 19,289 | $ | 18,390 | $ | 100,926 | ||||||||
| EMEA |
2,171 | 6,276 | 15,823 | 24,270 | ||||||||||||
| Asia Pacific |
| 1,211 | 494 | 1,705 | ||||||||||||
|
|
|
|
|
|
|
|
|
|||||||||
| Restructuring charges, net |
$ | 65,418 | $ | 26,776 | $ | 34,707 | $ | 126,901 | ||||||||
|
|
|
|
|
|
|
|
|
|||||||||
| Year Ended December 31, 2010 | ||||||||||||||||||||
| Q408 Restructuring Plan |
Q209 Restructuring Plan |
Q409 Restructuring Charges |
Q410 Restructuring Plan |
Total | ||||||||||||||||
| Americas |
$ | 18,657 | $ | (151 | ) | $ | | $ | 20,459 | $ | 38,965 | |||||||||
| EMEA |
827 | 32 | 1,811 | 14,065 | 16,735 | |||||||||||||||
| Asia Pacific |
| | | 2,257 | 2,257 | |||||||||||||||
|
|
|
|
|
|
|
|
|
|
|
|||||||||||
| Restructuring charges, net |
$ | 19,484 | $ | (119 | ) | $ | 1,811 | $ | 36,781 | $ | 57,957 | |||||||||
|
|
|
|
|
|
|
|
|
|
|
|||||||||||
| Year Ended December 31, 2011 | ||||||||||||||||||||||||
| Q408 Restructuring Plan |
Q409 Restructuring Charges |
Q410 Restructuring Plan |
Q111 Restructuring Plan |
Q411 Restructuring Plan |
Total | |||||||||||||||||||
| Americas |
$ | 5,363 | $ | | $ | (2,934 | ) | $ | 10,887 | $ | 8,928 | $ | 22,244 | |||||||||||
| EMEA |
461 | (1,583 | ) | (55 | ) | 533 | 1,596 | 952 | ||||||||||||||||
| Asia Pacific |
| | 108 | 266 | 850 | 1,224 | ||||||||||||||||||
|
|
|
|
|
|
|
|
|
|
|
|
|
|||||||||||||
| Restructuring charges, net |
$ | 5,824 | $ | (1,583 | ) | $ | (2,881 | ) | $ | 11,686 | $ | 11,374 | $ | 24,420 | ||||||||||
|
|
|
|
|
|
|
|
|
|
|
|
|
|||||||||||||
107
Q408 Restructuring Plan. During the fourth quarter of 2008, the Company implemented certain cost reduction initiatives, including a workforce reduction and consolidation of certain real estate facilities. The Company began to consolidate and exit selected facilities beginning in the fourth quarter of 2008 and continued this process through the second quarter of 2010. The Company vacated and ceased use of the facilities identified under the plan. Non-cancelable lease costs were determined based on the present value of remaining lease payments reduced by estimated sublease income. Present value computations use discount rates based on published Treasury risk-free interest rates, adjusted for the Companys credit spread, which is consistent with observable credit spreads of companies with similar credit standing. The cost of exiting and terminating the Companys facility leases was determined by referring to the contractual terms of the agreements, by evaluating the current real estate market conditions, and, where applicable, by referring to amounts in negotiation. The Companys ability to generate the estimated amounts of sublease income, as well as to terminate lease obligations at the estimated amounts, is dependent upon the commercial real estate market conditions in certain geographies at the time the Company negotiates the lease termination and sublease arrangements with third parties. These amounts represent the Companys best estimate of the obligations the Company expects to incur and could be subject to adjustment as market conditions change. The fair value measurement of the liability related to exited facilities involves the use of certain significant unobservable inputs and therefore falls within level 3 of the fair value hierarchy established by accounting guidance. The remaining lease obligations will be settled over the remaining lease terms which expire through fiscal 2017 and will be adjusted for changes in estimates or the impact of sublease contracts.
During the year ended December 31, 2009, the Company incurred total pre-tax cash charges for severance, facility, and other restructuring costs of $57 million related to the Q408 restructuring plan, net of reversal for adjustments to original estimates totaling $8 million. In addition to the pre-tax cash charges, the Company recorded a non-cash charge of $8 million related to the write-off of leasehold improvements, furniture and fixtures for exited facilities. During the year ended December 31, 2010, the Company incurred total pre-tax cash charges for severance, facility, and other restructuring costs of $19 million related to the Q408 restructuring plan in connection with the continued implementation of these initiatives, net of reversal for adjustments to original estimates totaling $6 million. During the year ended December 31, 2011, the Company incurred total pre-tax cash charges for facility, and other restructuring costs of $6 million related to the Q408 restructuring plan, net of reversal for adjustments to original estimates totaling $2 million.
Q209 Restructuring Plan. During the second quarter of 2009, the Company implemented new cost reduction initiatives to further reduce the Companys worldwide workforce by approximately 5 percent. The restructuring plan involved reallocating resources to align with the Companys strategic priorities including investing resources in some areas, reducing resources in others, and eliminating some areas of the Companys business that did not support the Companys strategic priorities. During the year ended December 31, 2009, the Company incurred total pre-tax cash charges of $35 million in severance and other costs related to the Q209 restructuring plan. The pre-tax cash charges were offset by an $8 million credit related to non-cash stock-based compensation expense reversals for unvested stock awards that were forfeited. During the year ended December 31, 2010, the Company incurred insignificant charges related to the Q209 restructuring plan. The plan was completed during the fourth quarter of 2010.
Q409 Restructuring Charges. During the fourth quarter of 2009, the Company decided to close one of its EMEA facilities and began implementation of workforce realignment at the facility to focus resources on its strategic initiatives. The Company exited the facility in the third quarter of 2010. During the year ended December 31, 2009, the Company incurred total pre-tax cash charges of $16 million in severance and other costs related to this realignment. In connection with the strategic realignment efforts, a U.S. executive of one of the Companys acquired businesses departed. The Company incurred $19 million of non-cash stock-based compensation expense for the acceleration of certain of the executives stock-based awards pursuant to the acquisition agreements. During the year ended December 31, 2010, the Company incurred total pre-tax cash charges of $2 million in severance, facility and other costs related to the Q409 restructuring charges. During the year ended December 31, 2011, the Company recorded a net reversal of $2 million for adjustments to original estimates in severance and other costs related to the Q409 restructuring charges. The workforce realignment was completed during the second quarter of 2011.
108
Q410 Restructuring Plan. During the fourth quarter of 2010, the Company began implementation of a worldwide workforce reduction to align resources with its product strategy. The Company incurred total pre-tax cash charges of $41 million in severance and other costs related to this workforce reduction in the fourth quarter of 2010. The pre-tax cash charges were offset by a $4 million credit related to non-cash stock-based compensation expense reversals for unvested stock awards that were forfeited. During the year ended December 31, 2011, the Company recorded a net reversal of $3 million for adjustments to original estimates in severance and other costs related to the Q410 restructuring plan.
Q111 Restructuring Plan. During the first quarter of 2011, the Company began implementation of a workforce realignment and consolidation of certain data centers to further reduce its cost structure and improve efficiency. During the year ended December 31, 2011, the Company incurred total pre-tax cash charges of $13 million in severance, facility and other related costs related to the Q111 restructuring plan, net of reversal for adjustments to original estimates totaling $1 million. The pre-tax cash charges were offset by a $1 million credit related to non-cash stock-based compensation expense reversals for unvested stock awards that were forfeited.
Q411 Restructuring Plan. During the fourth quarter of 2011, the Company implemented a further workforce realignment and consolidation of certain real estate facilities to focus resources as a result of the ongoing strategic review. The Company began to consolidate and exit selected facilities in the fourth quarter of 2011 and expects to continue this process through the second quarter of 2012. During the year ended December 31, 2011, the Company incurred total pre-tax cash charges of $9 million in severance, facility and other related costs related to the Q411 restructuring plan. In addition to the pre-tax cash charges, the Company recorded a non-cash charge of $2 million, the majority of which related to non-cash stock-based compensation expense for the acceleration of certain executives stock awards.
In addition to the charges described above, the Company currently expects to incur future charges of $16 million to $21 million primarily related to non-cancelable operating costs and accretion for exited facilities identified as part of the Q408 restructuring plan. Of the total future charges, $15 million to $20 million relate to the Americas segment, $1 million relates to the EMEA segment, and no charge relates to the Asia Pacific segment. The future charges are expected to be recorded through 2017.
Restructuring Accruals. The $49 million restructuring liability as of December 31, 2011 consists of $10 million for employee severance which the Company expects to substantially pay out by the end of the fourth quarter of 2012 and $39 million relates to non-cancelable lease costs which the Company expects to pay over the terms of the related obligations which extend to the second quarter of 2017.
109
The activity in the Companys restructuring accruals for the years ended December 31, 2010 and 2011 is summarized as follows (in thousands):
| Q408 Restructuring Plan |
Q209 Restructuring Plan |
Q409 Restructuring Charges |
Q410 Restructuring Plan |
Q111 Restructuring Plan |
Q411 Restructuring Plan |
Total | ||||||||||||||||||||||
| Balance as of January 1, 2010 |
$ | 59,965 | $ | 4,302 | $ | 14,765 | $ | | $ | | $ | | $ | 79,032 | ||||||||||||||
| Employee severance pay and related costs |
431 | 344 | 975 | 40,992 | | | 42,742 | |||||||||||||||||||||
| Reversals of stock-based compensation expense |
| | | (4,211 | ) | | | (4,211 | ) | |||||||||||||||||||
| Non-cancelable lease, contract termination, and other charges |
24,525 | | 792 | | | | 25,317 | |||||||||||||||||||||
| Other non-cash charges |
72 | | 2,725 | | | | 2,797 | |||||||||||||||||||||
| Reversal of previous charges |
(5,544 | ) | (463 | ) | (2,681 | ) | | | | (8,688 | ) | |||||||||||||||||
|
|
|
|
|
|
|
|
|
|
|
|
|
|
|
|||||||||||||||
| Restructuring charges, net for the year ended December 31, 2010 |
$ | 19,484 | $ | (119 | ) | $ | 1,811 | $ | 36,781 | $ | | $ | | $ | 57,957 | |||||||||||||
| Cash paid |
(30,650 | ) | (3,666 | ) | (8,386 | ) | (7,100 | ) | | | (49,802 | ) | ||||||||||||||||
| Non-cash reversals of stock-based compensation expense |
| | | 4,211 | | | 4,211 | |||||||||||||||||||||
| Non-cash adjustments |
685 | (517 | ) | (3,904 | ) | (560 | ) | | | (4,296 | ) | |||||||||||||||||
|
|
|
|
|
|
|
|
|
|
|
|
|
|
|
|||||||||||||||
| Balance as of December 31, 2010 |
$ | 49,484 | $ | | $ | 4,286 | $ | 33,332 | $ | | $ | | $ | 87,102 | ||||||||||||||
| Employee severance pay and related costs |
8 | | 109 | 3,967 | 11,434 | 6,633 | 22,151 | |||||||||||||||||||||
| (Reversals) accelerations of stock-based compensation expense |
| | (46 | ) | (586 | ) | (646 | ) | 1,492 | 214 | ||||||||||||||||||
| Non-cancelable lease, contract termination, and other charges |
7,137 | | 18 | 384 | 2,543 | 2,943 | 13,025 | |||||||||||||||||||||
| Other non-cash charges |
684 | | | | | 306 | 990 | |||||||||||||||||||||
| Reversal of previous charges |
(2,005 | ) | | (1,664 | ) | (6,646 | ) | (1,645 | ) | | (11,960 | ) | ||||||||||||||||
|
|
|
|
|
|
|
|
|
|
|
|
|
|
|
|||||||||||||||
| Restructuring charges, net for the year ended December 31, 2011 |
$ | 5,824 | $ | | $ | (1,583 | ) | $ | (2,881 | ) | $ | 11,686 | $ | 11,374 | $ | 24,420 | ||||||||||||
| Cash paid |
(22,018 | ) | | (1,494 | ) | (27,450 | ) | (10,130 | ) | (1,113 | ) | (62,205 | ) | |||||||||||||||
| Non-cash reversals (accelerations) of stock-based compensation expense |
| | 46 | 586 | 646 | (1,492 | ) | (214 | ) | |||||||||||||||||||
| Non-cash adjustments |
179 | | (1,255 | ) | 244 | 773 | 83 | 24 | ||||||||||||||||||||
|
|
|
|
|
|
|
|
|
|
|
|
|
|
|
|||||||||||||||
| Balance as of December 31, 2011 |
$ | 33,469 | $ | | $ | | $ | 3,831 | $ | 2,975 | $ | 8,852 | $ | 49,127 | ||||||||||||||
|
|
|
|
|
|
|
|
|
|
|
|
|
|
|
|||||||||||||||
As of December 31, restructuring accruals were included in the Companys consolidated balance sheets as follows (in thousands):
| 2010 | 2011 | |||||||
| Accrued expenses and other current liabilities |
$ | 58,151 | $ | 26,743 | ||||
| Capital lease and other long-term liabilities |
28,951 | 22,384 | ||||||
|
|
|
|
|
|||||
| Total restructuring accruals |
$ | 87,102 | $ | 49,127 | ||||
|
|
|
|
|
|||||
110
As of December 31, restructuring accruals by segment consisted of the following (in thousands):
| 2010 | 2011 | |||||||
| Americas |
$ | 68,268 | $ | 41,199 | ||||
| EMEA |
16,895 | 6,948 | ||||||
| Asia Pacific |
1,939 | 980 | ||||||
|
|
|
|
|
|||||
| Total restructuring accruals |
$ | 87,102 | $ | 49,127 | ||||
|
|
|
|
|
|||||
Note 16 SEARCH AGREEMENT WITH MICROSOFT CORPORATION
On December 4, 2009, the Company entered into the Search Agreement with Microsoft, which provides for Microsoft to be the exclusive algorithmic and paid search services provider on Yahoo! Properties and non-exclusive provider of such services on Affiliate sites. The Company also entered into a License Agreement with Microsoft. Under the License Agreement, Microsoft acquired an exclusive 10-year license to the Companys core search technology and will have the ability to integrate this technology into its existing Web search platforms. The Company received regulatory clearance from both the U.S. Department of Justice and the European Commission on February 18, 2010 and commenced implementation of the Search Agreement on February 23, 2010. Under the Search Agreement, the Company will be the exclusive worldwide relationship sales force for both companies premium search advertisers, which include advertisers meeting certain spending or other criteria, advertising agencies that specialize in or offer search engine marketing services and their clients, and resellers and their clients seeking assistance with their paid search accounts. The term of the Search Agreement is 10 years from February 23, 2010, subject to earlier termination as provided in the Search Agreement.
During the first five years of the term of the Search Agreement, in the transitioned markets the Company is entitled to receive 88 percent of the revenue generated from Microsofts services on Yahoo! Properties (the Revenue Share Rate) and the Company is also entitled to receive 88 percent of the revenue generated from Microsofts services on Affiliate sites after the Affiliates share of revenue. For new Affiliates during the term of the Search Agreement, and for all Affiliates after the first five years of such term, the Company will receive 88 percent of the revenue generated from Microsofts services on Affiliate sites after the Affiliates share of revenue and certain Microsoft costs are deducted. On the fifth anniversary of the date of implementation of the Search Agreement, Microsoft will have the option to terminate the Companys sales exclusivity for premium search advertisers. If Microsoft exercises its option, the Revenue Share Rate will increase to 93 percent for the remainder of the term of the Search Agreement, unless the Company exercises its option to retain the Companys sales exclusivity, in which case the Revenue Share Rate would be reduced to 83 percent for the remainder of the term. If Microsoft does not exercise such option, the Revenue Share Rate will be 90 percent for the remainder of the term of the Search Agreement. In the transitioned markets, the Company reports as revenue the 88 percent revenue share as the Company is not the primary obligor in the arrangement with the advertisers and publishers. The underlying search advertising services are provided by Microsoft.
As of December 31, 2010 and December 31, 2011, the Company had collected a total amount of $93 million and $66 million, respectively, on behalf of Microsoft and Affiliates, which was included in cash and cash equivalents as of December 31, 2010 and December 31, 2011, respectively, with a corresponding liability in accrued expenses and other current liabilities. The Company remitted the $93 million to Microsoft in the first quarter of 2011 and the $66 million in the first quarter of 2012. The Companys uncollected 88 percent share in connection with the Search Agreement was $172 million and $203 million, which is included in accounts receivable, net, as of December 31, 2010 and December 31, 2011, respectively.
The Company completed the transition of its algorithmic and paid search platforms to the Microsoft platform in the U.S. and Canada in the fourth quarter of 2010. In 2011, the Company completed the transition of algorithmic search in all other markets and the transition of paid search in India. The market-by-market transition of the Companys paid search platform to Microsofts platform and the migration of paid search advertisers and publishers to Microsofts platform are expected to continue through the first half of 2013.
111
Under the Search Agreement, for each market, Microsoft generally guarantees Yahoo!s revenue per search (RPS Guarantee) on Yahoo! Properties only for 18 months after the transition of paid search services to Microsofts platform in that market. In the fourth quarter of 2011, Microsoft agreed to extend the RPS Guarantee in the U.S. and Canada through March 2013. The RPS Guarantee is calculated based on the difference in revenue per search between the pre-transition and post-transition periods. The Company records the RPS Guarantee as search revenue in the quarter the amount becomes fixed, which would typically be the quarter in which the associated shortfall in revenue per search occurred.
From February 23, 2010 until the applicable services are fully transitioned to Microsoft in all markets, Microsoft will also reimburse the Company for the costs of operating algorithmic and paid search services subject to specified exclusions and limitations. The Companys results for the years ended December 31, 2010 and December 31, 2011 reflect $268 million and $212 million, respectively, in search operating cost reimbursements from Microsoft under the Search Agreement. Search operating cost reimbursements began during the quarter ended March 31, 2010 and will, subject to specified exclusions and limitations, continue until the Company has fully transitioned to Microsofts platform.
The Companys results for the year ended December 31, 2010 also reflect transition cost reimbursements from Microsoft under the Search Agreement, which were equal to the transition costs of $81 million incurred by Yahoo! related to the Search Agreement in the year ended December 31, 2010. In addition, in the year ended December 31, 2010, $43 million was recorded for reimbursement of transition costs incurred in 2009. The 2009 transition cost reimbursements were recorded in 2010 after regulatory clearance in the U.S. and Europe was received, implementation of the Search Agreement commenced, and Microsoft became obligated to make such payments. The Companys results for the year ended December 31, 2011 reflect transition cost reimbursements from Microsoft under the Search Agreement, which were equal to the transition costs of $26 million incurred by Yahoo! related to the Search Agreement in the year ended December 31, 2011. During the third quarter of 2011, the Companys cumulative transition costs exceeded Microsofts $150 million reimbursement cap under the Search Agreement. Transition costs the Company incurs in excess of the $150 million reimbursement cap are not subject to reimbursement.
In the year ended December 31, 2010, $17 million was recorded for reimbursements for employee retention costs incurred in 2010, and $5 million for employee retention costs incurred in 2009. These employee retention cost reimbursements are separate from and in addition to the $150 million of transition cost reimbursement payments and the search operating cost reimbursements.
Reimbursement receivables are recorded as the reimbursable costs are incurred and are applied against the operating expense categories in which the costs were incurred. As of December 31, 2010, a total of $414 million of reimbursable expenses related to 2009 and 2010 had been incurred by the Company related to the Search Agreement. Of that amount, $350 million had been received from Microsoft and $64 million was classified as part of prepaid expenses and other current assets on the Companys consolidated balance sheets as of December 31, 2010. As of December 31, 2011, a total of $238 million of reimbursable expenses related to 2011 had been incurred by the Company related to the Search Agreement. Of that amount, $16 million had not been received from Microsoft and was classified as part of prepaid expenses and other current assets on the Companys consolidated balance sheets as of December 31, 2011.
Note 17 SUBSEQUENT EVENTS
Management Changes. On January 3, 2012, the Board took the following actions, effective January 9, 2012: (1) appointed Mr. Scott Thompson, 54, to serve as Chief Executive Officer and President of the Company, and (2) increased the size of the Board from nine to ten members and appointed Mr. Thompson as a director.
On January 3, 2012, the Company entered into an employment letter agreement (the Agreement) with Mr. Thompson. The Agreement does not have a specified term, and Mr. Thompsons employment with the Company will be on an at-will basis.
112
The Agreement provides that Mr. Thompson will receive an annual base salary of $1,000,000, subject to annual review, and will be eligible to receive an annual bonus under the Companys annual Executive Incentive Plan with a target incentive of 200% of annual base salary. The actual amount of the annual bonus will be determined by the Compensation and Leadership Development Committee of the Board (the Compensation Committee) based upon the Companys financial performance and, if applicable under the Companys Executive Incentive Plan for the relevant year, Mr. Thompsons performance for that year. However, Mr. Thompsons annual bonus for 2012 will not be less than 50% of his target amount for that year.
Pursuant to the Agreement, on January 27, 2012, the Compensation Committee granted Mr. Thompson an award of restricted stock units under the 1995 Stock Plan with an aggregate value of $6.5 million on the date of grant (the Make-Whole RSUs). The Make-Whole RSUs are scheduled to vest as to a number of stock units with a grant date value of $5.5 million on March 15, 2012 and with respect to the remaining stock units subject to the grant on March 15, 2013. On February 10, 2012, Mr. Thompson received a make-whole cash bonus of $1.5 million (the Make-Whole Cash Bonus). The Make-Whole RSUs and the Make-Whole Cash Bonus are intended to compensate Mr. Thompson for the forfeiture of the value of his cash bonus and equity awards from his previous employer. The Make-Whole Cash Bonus and the Make-Whole RSUs vesting in 2012 are subject to certain clawback provisions in the event that Mr. Thompson terminates his employment without good reason during the first year of employment with the Company.
Pursuant to the Agreement, on February 27, 2012, Mr. Thompson was granted stock options and restricted stock units with an aggregate value of $16 million, including inducement awards with a value of $5 million and annual grants with a value of $11 million. Half of the value was awarded in the form of stock options and half in the form of restricted stock units, with the award values converted into options or units, respectively, based on customary Company equity award conversion policies. Each of these equity awards is scheduled to vest in equal annual installments over three years and was granted on the same terms as the annual grants for 2012 made to the Companys senior executives generally. In addition, Mr. Thompsons restricted stock unit awards as well as the Make-Whole RSUs carry specified dividend equivalent rights, and any shares of Company common stock acquired by Mr. Thompson upon vesting of his inducement restricted stock units generally must be held by him for at least two years following his acquisition of the shares.
113
Schedule IIValuation and Qualifying Accounts
Years Ended December 31, 2009, 2010, and 2011
| Balance at Beginning of Year |
Charged to Expenses |
Write-Offs Net of, Recoveries |
Balance at End of Year |
|||||||||||||
| (In thousands) | ||||||||||||||||
| Accounts receivable |
||||||||||||||||
| Allowance for doubtful accounts |
||||||||||||||||
| 2009 |
51,600 | 4,607 | (15,204 | ) | 41,003 | |||||||||||
| 2010 |
41,003 | 4,944 | (22,972 | ) | 22,975 | |||||||||||
| 2011 |
22,975 | 18,147 | (10,980 | ) | 30,142 | |||||||||||
| Balance at Beginning of Year |
Charged to Expenses |
Charged (Credited) to Other Accounts(*) |
Balance at End of Year |
|||||||||||||
| (In thousands) | ||||||||||||||||
| Deferred tax asset valuation allowance |
||||||||||||||||
| 2009 |
83,550 | 13,521 | (33,707 | ) | 63,364 | |||||||||||
| 2010 |
63,364 | (1,315 | ) | (1,873 | ) | 60,176 | ||||||||||
| 2011 |
60,176 | (5,975 | ) | (1,061 | ) | 53,140 | ||||||||||
| (*) | Amounts not charged (credited) to expenses are charged (credited) to stockholders equity, deferred tax assets (liabilities), or goodwill. |
114
Selected Quarterly Financial Data
(Unaudited)
| Quarters Ended | ||||||||||||||||||||||||||||||||
| March
31, 2010(1) |
June
30, 2010(2) |
September
30, 2010(3) |
December
31, 2010(4) |
March
31, 2011(5) |
June
30, 2011(6) |
September
30, 2011(7) |
December
31, 2011(8) |
|||||||||||||||||||||||||
| (In thousands, except per share amounts) | ||||||||||||||||||||||||||||||||
| Revenue |
$ | 1,596,960 | $ | 1,601,379 | $ | 1,601,203 | $ | 1,525,109 | $ | 1,214,357 | $ | 1,229,024 | $ | 1,216,665 | $ | 1,324,153 | ||||||||||||||||
| Gross profit |
$ | 890,577 | $ | 918,657 | $ | 920,449 | $ | 967,423 | $ | 836,895 | $ | 857,869 | $ | 857,389 | $ | 929,396 | ||||||||||||||||
| Net income attributable to Yahoo! Inc. |
$ | 310,191 | $ | 213,321 | $ | 396,131 | $ | 312,020 | $ | 222,992 | $ | 236,972 | $ | 293,291 | $ | 295,572 | ||||||||||||||||
|
|
|
|
|
|
|
|
|
|
|
|
|
|
|
|
|
|||||||||||||||||
| Net income attributable to Yahoo! Inc. common stockholders per sharebasic |
$ | 0.22 | $ | 0.15 | $ | 0.30 | $ | 0.24 | $ | 0.17 | $ | 0.18 | $ | 0.23 | $ | 0.24 | ||||||||||||||||
|
|
|
|
|
|
|
|
|
|
|
|
|
|
|
|
|
|||||||||||||||||
| Net income attributable to Yahoo! Inc. common stockholders per sharediluted |
$ | 0.22 | $ | 0.15 | $ | 0.29 | $ | 0.24 | $ | 0.17 | $ | 0.18 | $ | 0.23 | $ | 0.24 | ||||||||||||||||
|
|
|
|
|
|
|
|
|
|
|
|
|
|
|
|
|
|||||||||||||||||
| Shares used in per share calculation basic |
1,398,308 | 1,378,374 | 1,333,753 | 1,306,036 | 1,309,064 | 1,299,947 | 1,253,044 | 1,234,904 | ||||||||||||||||||||||||
|
|
|
|
|
|
|
|
|
|
|
|
|
|
|
|
|
|||||||||||||||||
| Shares used in per share calculationdiluted |
1,413,432 | 1,390,240 | 1,343,094 | 1,311,682 | 1,320,185 | 1,308,359 | 1,259,576 | 1,241,009 | ||||||||||||||||||||||||
|
|
|
|
|
|
|
|
|
|
|
|
|
|
|
|
|
|||||||||||||||||
| (1) | Net income attributable to Yahoo! Inc. for the quarter ended March 31, 2010 includes a pre-tax gain of $66 million in connection with the sale of Zimbra, Inc. and net restructuring charges of $4 million. During the quarter ended March 31, 2010, Yahoo! recorded $43 million for the reimbursement of transition costs incurred in 2009. |
| (2) | Net income attributable to Yahoo! Inc. for the quarter ended June 30, 2010 includes net restructuring charges of $10 million. |
| (3) | Net income attributable to Yahoo! Inc. for the quarter ended September 30, 2010 includes a pre-tax gain of $186 million in connection with the sale of HotJobs and net restructuring charges of $6 million. |
| (4) | Net income attributable to Yahoo! Inc. for the quarter ended December 31, 2010 includes net restructuring charges of $38 million. Beginning in the fourth quarter of 2010 when Yahoo! completed the transition of algorithmic and paid search services to the Microsoft platform in the U.S. and Canada, revenue was impacted by the required change in revenue presentation and the revenue share with Microsoft associated with the transition pursuant to the Search Agreement. For transitioned markets, Yahoo! now reports an 88 percent revenue share for search advertising services provided by Microsoft. Yahoo!s income tax provision was also reduced by the effect of certain tax benefits as discussed in Note 9Income Taxes in the Notes to the consolidated financial statements. |
| (5) | Net income attributable to Yahoo! Inc. for the quarter ended March 31, 2011 includes Yahoo!s non-cash loss related to an impairment of an investment held by Yahoo Japan, net of taxes, which is included in earnings in equity interests of $26 million and net restructuring charges of $11 million. |
| (6) | Net income attributable to Yahoo! Inc. for the quarter ended June 30, 2011 includes Yahoo!s share of the non-cash loss related to impairments of assets held by Yahoo Japan, which is included in earnings in equity interests of $7 million and net restructuring charges of less than $1 million. |
115
| (7) | Net income attributable to Yahoo! Inc. for the quarter ended September 30, 2011 includes non-cash gain related to the dilution of the Companys ownership interest in Alibaba Group, which is included in earnings in equity interests of $25 million and net restructuring reversal of $3 million. |
| (8) | Net income attributable to Yahoo! Inc. for the quarter ended December 31, 2011 includes net restructuring charges of $16 million. |
| Item 9. | Changes in and Disagreements With Accountants on Accounting and Financial Disclosure |
None.
| Item 9A. | Controls and Procedures |
Evaluation of Disclosure Controls and Procedures
The Companys management, with the participation of the Companys principal executive officer and principal financial officer, has evaluated the effectiveness of the Companys disclosure controls and procedures (as such term is defined in Rules 13a-15(e) and 15d-15(e) under the Exchange Act) as of the end of the period covered by this report. Based on such evaluation, the Companys principal executive officer and principal financial officer have concluded that, as of the end of such period, the Companys disclosure controls and procedures were effective.
Managements Report on Internal Control Over Financial Reporting
The Companys management is responsible for establishing and maintaining adequate internal control over financial reporting as defined in Rules 13a-15(f) and 15d-15(f) under the Exchange Act. Under the supervision and with the participation of the Companys management, including its principal executive officer and principal financial officer, the Company conducted an evaluation of the effectiveness of its internal control over financial reporting based on criteria established in the framework in Internal ControlIntegrated Framework issued by the Committee of Sponsoring Organizations of the Treadway Commission. Based on this evaluation, the Companys management concluded that its internal control over financial reporting was effective as of December 31, 2011.
Because of its inherent limitations, internal control over financial reporting may not prevent or detect all misstatements. Also, projections of any evaluation of effectiveness to future periods are subject to the risk that controls may become inadequate because of changes in conditions, or that the degree of compliance with the policies or procedures may deteriorate.
The Companys independent registered public accounting firm has issued an attestation report regarding its assessment of the Companys internal control over financial reporting as of December 31, 2011, which appears on page 64.
Changes in Internal Control Over Financial Reporting
There have been no changes in Yahoo!s internal control over financial reporting (as such term is defined in Rules 13a-15(f) and 15d-15(f) under the Exchange Act) during the quarter ended December 31, 2011 that have materially affected, or are reasonably likely to materially affect, internal control over financial reporting.
| Item 9B. | Other Information |
Executive Incentive Plan
On February 27, 2012, the Compensation and Leadership Development Committee of the Board (the Compensation Committee) approved the Companys annual cash bonus plan for senior executives (the Executive Incentive Plan, or EIP), which will be effective for 2012. Each participant in the EIP is assigned a
116
target bonus percentage each year that is expressed as a percentage of the participants annual base salary. The aggregate bonus pool available under the EIP for a particular year will equal the aggregate amount of the participants target bonus opportunities, multiplied by a factor that may range from 50 percent to 200 percent based on Yahoo!s revenue ex-TAC growth rate and ex-TAC operating margin (each as defined in the EIP) for that year. Payout of 100 percent of each participants bonus will be determined based on the Companys performance, although the Compensation Committee retains discretion under the EIP to reduce or eliminate the amount of any EIP bonus otherwise payable to a participant as determined based on Company performance. Participants whose employment is terminated or are under notice of termination prior to the EIP bonus payment date are generally ineligible for an EIP bonus. The foregoing summary of the EIP is qualified in its entirety by the provisions of the EIP.
The following table sets forth the 2012 EIP target bonus percentage, expressed as a percentage of the participants annual base salary, for the Companys principal executive officer, principal financial officer, and the other executive officers who were named in the Summary Compensation Table of the Companys Proxy Statement filed with the SEC on April 29, 2011 and who are currently employed as executive officers of the Company and will participate in the EIP:
| Name and Principal Position |
2012 Target Bonus (% of Base Salary) |
|||
| Scott Thompson |
200 | % | ||
| Chief Executive Officer |
||||
| Timothy R. Morse |
120 | % | ||
| Executive Vice President and Chief Financial Officer |
||||
| Blake Irving |
120 | % | ||
| Executive Vice President and Chief Product Officer |
||||
| Ross B. Levinsohn |
120 | % | ||
| Executive Vice President, Americas |
||||
| Michael J. Callahan |
90 | % | ||
| Executive Vice President, General Counsel and Secretary |
||||
| Item 10. | Directors, Executive Officers and Corporate Governance |
The information required by this item is incorporated by reference to Yahoo!s Proxy Statement for its 2012 Annual Meeting of Shareholders to be filed with the SEC within 120 days after the end of the fiscal year ended December 31, 2011.
| Item 11. | Executive Compensation |
The information required by this item is incorporated by reference to Yahoo!s Proxy Statement for its 2012 Annual Meeting of Shareholders to be filed with the SEC within 120 days after the end of the fiscal year ended December 31, 2011.
| Item 12. | Security Ownership of Certain Beneficial Owners and Management and Related Stockholder Matters |
The information required by this item is incorporated by reference to Yahoo!s Proxy Statement for its 2012 Annual Meeting of Shareholders to be filed with the SEC within 120 days after the end of the fiscal year ended December 31, 2011.
117
| Item 13. | Certain Relationships and Related Transactions, and Director Independence |
The information required by this item is incorporated by reference to Yahoo!s Proxy Statement for its 2012 Annual Meeting of Shareholders to be filed with the SEC within 120 days after the end of the fiscal year ended December 31, 2011.
| Item 14. | Principal Accounting Fees and Services |
The information required by this item is incorporated by reference to Yahoo!s Proxy Statement for its 2012 Annual Meeting of Shareholders to be filed with the SEC within 120 days after the end of the fiscal year ended December 31, 2011.
| Item 15. | Exhibits, Financial Statement Schedules |
(a) The following documents are filed as part of this report:
1. Consolidated Financial Statements:
| Page | ||||
| Index To Consolidated Financial Statements |
||||
| Consolidated Financial Statements: |
||||
| 64 | ||||
| Consolidated Statements of Income for each of the three years in the period ended December 31, 2011 |
65 | |||
| Consolidated Balance Sheets as of December 31, 2010 and 2011 |
66 | |||
| 67 | ||||
| 68 | ||||
| 70 | ||||
| 2. Financial Statement Schedules: |
||||
| Financial Statement Schedules: |
||||
| 114 | ||||
| All other schedules are omitted because they are not applicable or the required information is shown in the Consolidated Financial Statements or Notes thereto |
||||
| Supplementary Financial Data: |
||||
| Selected Quarterly Financial Data (unaudited) for the two years ended December 31, 2011 |
115 | |||
| 3. | Exhibits: |
The exhibits listed in the Exhibit Index (following the signatures page of this report) are filed with, or incorporated by reference in, this report.
118
Pursuant to the requirements of Section 13 or 15(d) of the Securities Exchange Act of 1934, the Registrant has duly caused this report to be signed on its behalf by the undersigned, thereunto duly authorized, on the 29th day of February 2012.
| YAHOO! INC. | ||
| By: |
/S/ TIMOTHY R. MORSE |
|
| Timothy R. Morse | ||
| Chief Financial Officer | ||
Power of Attorney
KNOW ALL PERSONS BY THESE PRESENTS, that each person whose signature appears below constitutes and appoints Scott Thompson and Timothy R. Morse, his or her attorneys-in-fact, each with the power of substitution, for him or her in any and all capacities, to sign any amendments to this Annual Report on Form 10-K and to file the same, with Exhibits thereto and other documents in connection therewith with the Securities and Exchange Commission, hereby ratifying and confirming all that each of said attorneys-in-fact, or substitute or substitutes may do or cause to be done by virtue hereof.
Pursuant to the requirements of the Securities Exchange Act of 1934, this report has been signed below by the following persons on behalf of the Registrant and in the capacities and on the dates indicated:
| Signature |
Title |
Date |
||
| /S/ SCOTT THOMPSON Scott Thompson |
Chief Executive Officer, President and Director (Principal Executive Officer) |
February 29, 2012 | ||
| /S/ TIMOTHY R. MORSE Timothy R. Morse |
Chief Financial Officer (Principal Financial Officer) |
February 29, 2012 | ||
| /S/ AMAN S. KOTHARI Aman S. Kothari |
SVP, Global Controller and Chief Accounting Officer (Principal Accounting Officer) |
February 29, 2012 | ||
| /S/ ROY J. BOSTOCK Roy J. Bostock |
Chairman of the Board | February 27, 2012 | ||
| /S/ ALFRED J. AMOROSO Alfred J. Amoroso |
Director | February 29, 2012 | ||
| /S/ PATTI S. HART Patti S. Hart |
Director | February 29, 2012 | ||
| /S/ SUSAN M. JAMES Susan M. James |
Director | February 29, 2012 | ||
| /S/ VYOMESH JOSHI Vyomesh Joshi |
Director | February 29, 2012 | ||
119
| Signature |
Title |
Date |
||
| /S/ DAVID W. KENNY David W. Kenny |
Director | February 29, 2012 | ||
| /S/ ARTHUR H. KERN Arthur H. Kern |
Director | February 29, 2012 | ||
| /S/ BRAD D. SMITH Brad D. Smith |
Director | February 29, 2012 | ||
| /S/ MAYNARD G. WEBB, JR. Maynard G. Webb, Jr. |
Director | February 29, 2012 | ||
| /S/ GARY L. WILSON Gary L. Wilson |
Director | February 29, 2012 | ||
120
EXHIBIT INDEX
The following exhibits are included, or incorporated by reference, in this Annual Report on Form 10-K (and are numbered in accordance with Item 601 of Regulation S-K). Pursuant to Item 601(a)(2) of Regulation S-K, this exhibit index immediately precedes the exhibits.
| Exhibit |
Description |
|
| 2.1 | Stock Purchase and Contribution Agreement, dated as of August 10, 2005, between the Registrant and Alibaba.com Corporation (previously filed as Exhibit 2.1 to the Registrants Current Report on Form 8-K filed August 16, 2005 and incorporated herein by reference). | |
| 2.2 | Amendment to the Stock Purchase and Contribution Agreement, dated as of October 24, 2005, between the Registrant and Alibaba.com Corporation (previously filed as Exhibit 2.2 to the Registrants Current Report on Form 8-K filed October 27, 2005 and incorporated herein by reference). | |
| 2.3 | Tao Bao Share Purchase Agreement, dated as of October 24, 2005, among the Registrant, SOFTBANK CORP. and SB TB Holding Limited (previously filed as Exhibit 2.3 to the Registrants Current Report on Form 8-K filed October 27, 2005 and incorporated herein by reference). | |
| 2.4 | Secondary Share Purchase Agreement, dated as of October 24, 2005, among the Registrant and certain shareholders of Alibaba.com Corporation (previously filed as Exhibit 2.4 to the Registrants Current Report on Form 8-K filed October 27, 2005 and incorporated herein by reference). | |
| 2.5 | Shareholders Agreement, dated as of October 24, 2005, among Alibaba.com Corporation, the Registrant, SOFTBANK CORP., the Management Members, and the other shareholders named therein (previously filed as Exhibit 2.5 to the Registrants Current Report on Form 8-K filed October 27, 2005 and incorporated herein by reference). | |
| 3.1(A) | Amended and Restated Certificate of Incorporation of the Registrant (previously filed as Exhibit 3.1 to the Registrants Quarterly Report on Form 10-Q filed July 28, 2000 and incorporated herein by reference). | |
| 3.1(B) | Certificate of Designation, Preferences and Rights of Series A Junior Participating Preferred Stock of the Registrant (included as Exhibit A within the Amended and Restated Rights Agreement, dated as of April 1, 2005, by and between the Registrant and Equiserve Trust Company, N.A., as rights agent (previously filed as Exhibit 4.1 to the Registrants Current Report on Form 8-K filed April 4, 2005 and incorporated herein by reference)). | |
| 3.2 | Amended and Restated Bylaws of the Registrant (previously filed as Exhibit 3.1 to the Registrants Current Report on Form 8-K/A filed December 20, 2010 and incorporated herein by reference). | |
| 10.1+ | Form of Indemnification Agreement between the Registrant and each of its directors and executive officers (previously filed as Exhibit 10.1 to the Registrants Quarterly Report on Form 10-Q filed November 6, 2009 and incorporated herein by reference). | |
| 10.2(A)+ | Yahoo! Inc. 1995 Stock Plan, as amended and restated on June 25, 2009 (previously filed as Exhibit 10.1 to the Registrants Current Report on Form 8-K filed June 29, 2009 and incorporated herein by reference). | |
| 10.2(B)+ | Form of Stock Option Agreement, including Notice of Stock Option Grant, under the Yahoo! Inc.1995 Stock Plan (previously filed as Exhibit 10.2(B) to the Registrants Quarterly Report on Form 10-Q filed November 6, 2009 and incorporated herein by reference). | |
| 10.2(C)+ | Form of Stock Option Agreement for Executives, including Notice of Stock Option Grant to Executive, under the Yahoo! Inc. 1995 Stock Plan (previously filed as Exhibit 10.2(C) to the Registrants Annual Report on Form 10-K filed February 28, 2011 and incorporated herein by reference). | |
121
| Exhibit |
Description |
|
| 10.2(D)+ | Form of Restricted Stock Unit Award Agreement under the Yahoo! Inc. 1995 Stock Plan (previously filed as Exhibit 10.2(D) to the Registrants Quarterly Report on Form 10-Q filed November 6, 2009 and incorporated herein by reference). | |
| 10.2(E)+ | Form of Restricted Stock Unit Award Agreement for Executives under the Yahoo! Inc. 1995 Stock Plan (previously filed as Exhibit 10.2(E) to the Registrants Annual Report on Form 10-K filed February 28, 2011 and incorporated herein by reference). | |
| 10.2(F)+* | Form of Restricted Stock Unit Award Agreement for Executives (version 2) under the Yahoo! Inc. 1995 Stock Plan. | |
| 10.2(G)+ | Form of Performance Restricted Stock Unit Award Agreement (TSR version) under the Yahoo! Inc. 1995 Stock Plan (previously filed as Exhibit 10.2(F) to the Registrants Annual Report on Form 10-K filed February 26, 2010 and incorporated herein by reference). | |
| 10.2(H)+ | Form of Performance Restricted Stock Unit Award Agreement (OCF version) under the Yahoo! Inc. 1995 Stock Plan (previously filed as Exhibit 10.2(I) to the Registrants Annual Report on Form 10-K filed February 27, 2009 and incorporated herein by reference). | |
| 10.2(I)+ | Form of First Letter Amendment (2010) to Performance Restricted Stock Unit Award Agreement (OCF version) under the Yahoo! Inc. 1995 Stock Plan (previously filed as Exhibit 10.2(H) to the Registrants Annual Report on Form 10-K filed February 26, 2010 and incorporated herein by reference). | |
| 10.2(J)+ | Form of Second Letter Amendment (2011) to Performance Restricted Stock Unit Award Agreement (OCF version) under the Yahoo! Inc. 1995 Stock Plan (previously filed as Exhibit 10.2(I) to the Registrants Annual Report on Form 10-K filed February 28, 2011 and incorporated herein by reference). | |
| 10.2(K)+ | Form of Performance Restricted Stock Unit Award Agreement (2010 AFP version) under the Yahoo! Inc. 1995 Stock Plan (previously filed as Exhibit 10.2(I) to the Registrants Annual Report on Form 10-K filed February 26, 2010 and incorporated herein by reference). | |
| 10.2(L)+ | Form of Letter Amendment (2011) to Performance Restricted Stock Unit Award Agreement (2010 AFP version) under the Yahoo! Inc. 1995 Stock Plan (previously filed as Exhibit 10.2(K) to the Registrants Annual Report on Form 10-K filed February 28, 2011 and incorporated herein by reference). | |
| 10.2(M)+* | Form of Second Letter Amendment (2012) to Performance Restricted Stock Unit Award Agreement (2010 AFP version) under the Yahoo! Inc. 1995 Stock Plan. | |
| 10.2(N)+ | Form of Performance Restricted Stock Unit Award Agreement under the Yahoo! Inc. 1995 Stock Plan (previously filed as Exhibit 10.2(L) to the Registrants Annual Report on Form 10-K filed February 28, 2011 and incorporated herein by reference). | |
| 10.2(O)+ | Form of Restricted Stock Award Agreement under the Yahoo! 1995 Stock Plan (previously filed as Exhibit 10.2(F) to the Registrants Quarterly Report on Form 10-Q filed November 6, 2009 and incorporated herein by reference). | |
| 10.2(P)+ | Form of Stock Appreciation Rights Award Agreement under the Yahoo! Inc. 1995 Stock Plan (previously filed as Exhibit 10.23(D) to the Registrants Quarterly Report on Form 10-Q filed August 8, 2007 and incorporated herein by reference). | |
| 10.3(A)+ | Yahoo! Inc. 1996 Employee Stock Purchase Plan, as amended and restated on February 7, 2011 (previously filed as Exhibit 10.3(A) to the Registrants Annual Report on Form 10-K filed February 28, 2011 and incorporated herein by reference). | |
122
| Exhibit |
Description |
|
| 10.3(B)+ | Form of Enrollment Agreement under the Yahoo! Inc. Amended and Restated 1996 Employee Stock Purchase Plan (previously filed as Exhibit 10.3(B) to the Registrants Quarterly Report on Form 10-Q filed May 10, 2011 and incorporated herein by reference). | |
| 10.4(A)+ | Yahoo! Inc. 1996 Directors Stock Plan, as amended and restated June 24, 2010 (previously filed as Exhibit 10.4(A) to the Registrants Quarterly Report on Form 10-Q filed August 9, 2010 and incorporated herein by reference). | |
| 10.4(B)+ | Form of Director Nonstatutory Stock Option Agreement, including Notice of Grant, under the Yahoo! Inc. 1996 Directors Stock Plan (previously filed as Exhibit 10.4(B) to the Registrants Quarterly Report on Form 10-Q filed August 9, 2010 and incorporated herein by reference). | |
| 10.4(C)+ | Form of Notice of Restricted Stock Unit Grant and Director Restricted Stock Unit Award Agreement under the Yahoo! Inc. 1996 Directors Stock Plan (previously filed as Exhibit 10.4(C) to the Registrants Quarterly Report on Form 10-Q filed August 9, 2010 and incorporated herein by reference). | |
| 10.5 | Joint Venture Agreement dated April 1, 1996 by and between the Registrant and SOFTBANK Corporation (previously filed as Exhibit 10.7 to the Registrants Annual Report on Form 10-K filed March 21, 2003 and incorporated herein by reference). | |
| 10.6 | Amendment Agreement dated September 17, 1997 by and between Registrant and SOFTBANK Corporation (previously filed as Exhibit 10.11 to the Registrants Annual Report on Form 10-K filed March 21, 2003 and incorporated herein by reference). | |
| 10.7 | Yahoo Japan License Agreement dated April 1, 1996 by and between the Registrant and Yahoo Japan Corporation (previously filed as Exhibit 10.43 to Amendment No. 2 to the Registrants Registration Statement on Form S-3, Registration No. 333-100298, filed on December 23, 2002 and incorporated herein by reference). | |
| 10.8 | Amendment to Yahoo Japan License Agreement dated September 12, 1997 by and between the Registrant and Yahoo Japan Corporation (previously filed as Exhibit 10.40 to Amendment No. 1 of the Registrants Registration Statement on Form S-3, Registration No. 333-100298, filed on November 27, 2002 and incorporated herein by reference). | |
| 10.9 | Amendment No. 2 to Yahoo Japan License Agreement dated January 31, 2005 by and between the Registrant and Yahoo Japan Corporation (previously filed as Exhibit 10.30 to the Registrants Annual Report on Form 10-K filed March 11, 2005 and incorporated herein by reference). | |
| 10.10+* | Summary of Compensation Payable to Named Executive Officers. | |
| 10.11+* | Yahoo! Inc. Executive Incentive Plan. | |
| 10.12+ | Form of Severance Agreement (previously filed as Exhibit 10.14 to the Registrants Annual Report on Form 10-K filed February 28, 2011 and incorporated herein by reference). | |
| 10.13+ | Yahoo! Inc. Change in Control Employee Severance Plan for Level I and Level II Employees, as amended on December 10, 2008 (previously filed as Exhibit 10.15 to the Registrants Annual Report on Form 10-K filed February 27, 2009 and incorporated herein by reference). | |
| 10.14(A)+ | Employment Agreement Letter, dated January 13, 2009, between the Registrant and Carol Bartz (previously filed as Exhibit 10.1 to the Registrants Current Report on Form 8-K filed January 15, 2009 and incorporated herein by reference). | |
123
| Exhibit |
Description |
|
| 10.14(B)+ | Notice of Stock Option Grant and Stock Option Award Agreement, dated January 30, 2009, between the Registrant and Carol Bartz (previously filed as Exhibits 10.17(B) and 10.17(C), respectively, to the Registrants Annual Report on Form 10-K filed February 27, 2009 and incorporated herein by reference). | |
| 10.14(C)+ | Stock Option Award Agreement, including Notice of Stock Option Grant, dated February 25, 2009, between the Registrant and Carol Bartz (previously filed as Exhibit 10.17(E) to the Registrants Annual Report on Form 10-K filed February 27, 2009 and incorporated herein by reference). | |
| 10.14(D)+ | Performance Restricted Stock Unit Award Agreement (TSR version), dated February 25, 2009, between the Registrant and Carol Bartz (previously filed as Exhibit 10.17(G) to the Registrants Annual Report on Form 10-K filed February 27, 2009 and incorporated herein by reference). | |
| 10.14(E)+ | Performance Restricted Stock Unit Award Agreement (OCF version), dated February 25, 2009, between the Registrant and Carol Bartz (previously filed as Exhibit 10.17(H) to the Registrants Annual Report on Form 10-K filed February 27, 2009 and incorporated herein by reference). | |
| 10.14(F)+ | Form of Stock Option Award Agreement, including Notice of Stock Option Grant2010, between the Registrant and Carol Bartz under the Yahoo! Inc. 1995 Stock Plan (previously filed as Exhibit 10.14(H) to the Registrants Annual Report on Form 10-K filed February 26, 2010 and incorporated herein by reference). | |
| 10.14(G)+ | Form of Performance Restricted Stock Unit Award Agreement (TSR version)2010 between the Registrant and Carol Bartz under the Yahoo! Inc. 1995 Stock Plan (previously filed as Exhibit 10.14(J) to the Registrants Annual Report on Form 10-K filed February 26, 2010 and incorporated herein by reference). | |
| 10.14(H)+ | Form of Performance Restricted Stock Unit Award Agreement (AFP version)2010 between the Registrant and Carol Bartz under the Yahoo! Inc. 1995 Stock Plan (previously filed as Exhibit 10.14(K) to the Registrants Annual Report on Form 10-K filed February 26, 2010 and incorporated herein by reference). | |
| 10.14(I)+ | Form of Stock Option Award Agreement, including Notice of Stock Option Grant, between the Registrant and Carol Bartz under the Yahoo! Inc. 1995 Stock Plan (previously filed as Exhibit 10.16(L) to the Registrants Annual Report on Form 10-K filed February 28, 2011 and incorporated herein by reference). | |
| 10.14(J)+ | Form of Performance Restricted Stock Unit Award Agreement between the Registrant and Carol Bartz under the Yahoo! Inc. 1995 Stock Plan (previously filed as Exhibit 10.16(N) to the Registrants Annual Report on Form 10-K filed February 28, 2011 and incorporated herein by reference). | |
| 10.15+ | Employment Letter Agreement, dated June 5, 2009, between the Registrant and Timothy R. Morse (previously filed as Exhibit 10.20 to the Registrants Quarterly Report on Form 10-Q filed August 7, 2009 and incorporated herein by reference). | |
| 10.16(A) | Letter Agreement, dated July 29, 2009, between the Registrant and Microsoft Corporation (previously filed as Exhibit 10.21(A) to the Registrants Quarterly Report on Form 10-Q filed November 6, 2009 and incorporated herein by reference). | |
| 10.16(B) | Search and Advertising Services and Sales Agreement, dated December 4, 2009, between the Registrant and Microsoft Corporation (previously filed as Exhibit 10.18(B) to the Registrants Annual Report on Form 10-K filed February 26, 2010 and incorporated herein by reference). | |
| 10.16(C) | License Agreement, dated December 4, 2009, between the Registrant and Microsoft Corporation (previously filed as Exhibit 10.18(C) to the Registrants Annual Report on Form 10-K filed February 26, 2010 and incorporated herein by reference). | |
124
| Exhibit |
Description |
|
| 10.16(D) | First Amendment to Search and Advertising Services and Sales Agreement, dated as of July 14, 2010, by and between the Registrant and Microsoft Corporation (previously filed as Exhibit 10.18(D) to the Registrants Quarterly Report on Form 10-Q filed May 10, 2011 and incorporated herein by reference). | |
| 10.16(E) | Second Amendment to Search and Advertising Services and Sales Agreement, dated as of October 10, 2010, by and between the Registrant and Microsoft Corporation (previously filed as Exhibit 10.18(E) to the Registrants Quarterly Report on Form 10-Q filed May 10, 2011 and incorporated herein by reference). | |
| 10.16(F) | Third Amendment to Search and Advertising Services and Sales Agreement, dated as of March 31, 2011, by and between the Registrant and Microsoft Corporation (previously filed as Exhibit 10.18(F) to the Registrants Quarterly Report on Form 10-Q filed May 10, 2011 and incorporated herein by reference). | |
| 10.16(G) | Amendment No. 1 to License Agreement, dated as of October 10, 2010, by and between the Registrant and Microsoft Corporation (previously filed as Exhibit 10.18(G) to the Registrants Quarterly Report on Form 10-Q filed May 10, 2011 and incorporated herein by reference). | |
| 10.16(H) | Fourth Amendment to Search and Advertising Services and Sales Agency Agreement, dated as of December 13, 2010, by and between the Registrant and Microsoft Corporation (previously filed as Exhibit 10.18(H) to Amendment No. 1 to the Registrants Quarterly Report on Form 10-Q filed December 2, 2011 and incorporated herein by reference). | |
| 10.16(I) | Fifth Amendment to Search and Advertising Services and Sales Agency Agreement, dated as of July 2, 2011, by and between the Registrant and Microsoft Corporation (previously filed as Exhibit 10.18(I) to Amendment No. 1 to the Registrants Quarterly Report on Form 10-Q filed December 2, 2011 and incorporated herein by reference). | |
| 10.16(J) | Sixth Amendment to Search and Advertising Services and Sales Agency Agreement, dated as of October 14, 2011, by and between the Registrant and Microsoft Corporation (previously filed as Exhibit 10.18(J) to the Registrants Quarterly Report on Form 10-Q filed November 7, 2011 and incorporated herein by reference). | |
| 10.17+ | Employment Offer Letter, dated May 28, 2010, between the Registrant and Blake Irving (previously filed as Exhibit 10.20 to the Registrants Quarterly Report on Form 10-Q filed May 10, 2011 and incorporated herein by reference). | |
| 10.18+ | Employment Offer letter, dated October 27, 2010, between the Registrant and Ross Levinsohn (previously filed as Exhibit 10.21 to the Registrants Quarterly Report on Form 10-Q filed May 10, 2011 and incorporate herein by reference). | |
| 10.19 | Framework Agreement, dated as of July 29, 2011, by and among the Registrant, Alibaba Group Holding Limited, Softbank Corp., Alipay.com Co., Ltd., APN Ltd., Zhejiang Alibaba E-Commerce Co., Ltd., Jack Ma Yun, Joseph C. Tsai and certain joinder parties (previously filed as Exhibit 10.1 to Amendment No. 1 to the Registrants Current Report on Form 8-K filed August 12, 2011 and incorporated herein by reference). | |
| 10.20(A)+ | Letter Agreement, dated January 3, 2012, between the Registrant and Scott Thompson (previously filed as Exhibit 10.1 to the Registrants Current Report on Form 8-K filed on January 3, 2012 and incorporated herein by reference). | |
| 10.20(B)+* | Form of Restricted Stock Unit Award Agreement (CEO Make-Whole Grant) between the Registrant and Scott Thompson. | |
125
| Exhibit |
Description |
|
| 10.20(C)+* | Form of Restricted Stock Unit Award Agreement (CEO Inducement Grant) between the Registrant and Scott Thompson. | |
| 10.20(D)+* | Form of Restricted Stock Unit Award Agreement (CEO Annual Grant) between the Registrant and Scott Thompson. | |
| 21.1* | List of Subsidiaries. | |
| 23.1* | Consent of Independent Registered Public Accounting Firm. | |
| 24.1 | Power of Attorney (see the signature page of this Annual Report on Form 10-K.) | |
| 31.1* | Certificate of Chief Executive Officer Pursuant to Securities Exchange Act Rules 13a-14(a) and 15d-14(a) as Adopted Pursuant to Section 302 of the Sarbanes-Oxley Act of 2002, dated February 29, 2012. | |
| 31.2* | Certificate of Chief Financial Officer Pursuant to Securities Exchange Act Rules 13a-14(a) and 15d-14(a) as Adopted Pursuant to Section 302 of the Sarbanes-Oxley Act of 2002, dated February 29, 2012. | |
| 32* | Certificate of Chief Executive Officer and Chief Financial Officer Pursuant to Securities Exchange Act Rules 13a-14(b) and 15d-14(b) and 18 U.S.C. Section 1350, as Adopted Pursuant to Section 906 of the Sarbanes-Oxley Act of 2002, dated February 29, 2012. | |
| 101.INS* | XBRL Instance | |
| 101.SCH* | XBRL Taxonomy Extension Schema | |
| 101.CAL* | XBRL Taxonomy Extension Calculation | |
| 101.DEF* | XBRL Taxonomy Extension Definition | |
| 101.LAB* | XBRL Taxonomy Extension Labels | |
| 101.PRE* | XBRL Taxonomy Extension Presentation | |
| * | Filed herewith. |
| + | Indicates a management contract or compensatory plan or arrangement. |
| | Portions of this exhibit have been omitted and filed separately with the U.S. Securities and Exchange Commission pursuant to a request for confidential treatment. |
126
