Tesla Motors Inc 8-K 2016-10-26
Sign in or join
Add a note by highlighting text or Replying to an existing note.
Add a note by highlighting text or Replying to an existing note.
Exhibit 99.1

|
Tesla Third Quarter 2016 Update
GAAP net income of $22 million and positive free cash flow of $176 million Record vehicle production, deliveries, and revenue GAAP gross profit per car increased significantly from Q2 to Q3 Long-term debt reduced and liquidity increased to support future growth Every new Tesla produced now comes with hardware for self-driving Dramatic improvement in Model X reliability Model 3 on plan for volume deliveries in second half of 2017 |
The Tesla third quarter results reflect strong company-wide execution in many areas. Furthermore, we expect this to continue into Q4 and project positive GAAP net income (excluding non-cash stock-based compensation) despite ZEV credit sales in Q4 likely being negligible. We set new records for vehicle production, deliveries and revenue, which led to GAAP profitability and positive free cash flow (cash flows from operations less capital expenditures). At the same time, GAAP total automotive gross margin and gross profit per car increased substantially.
New product launches, increased store efficiency and new store openings drove year-on-year order growth in Q3, while self-driving hardware and other product enhancements position Tesla for additional market share gains. Our energy storage products are gaining increased market acceptance, firmly establishing Tesla as a leader in energy storage solutions, and surpassing our competitors in the breadth and scope of our offerings across residential, commercial, and utility-scale storage markets.
At the same time, we continue to lay the foundation for future growth. Gigafactory construction and Model 3 development both remain on plan to support volume Model 3 production and deliveries in the second half of 2017. Meanwhile, our efforts to transform the solar industry will be demonstrated at our joint product introduction with SolarCity on October 28th.
Continuous Product Innovation
Last week, we announced that all newly produced Tesla vehicles have the hardware needed for full self-driving capability. This same capability will also be built into every Model 3. Eight surround cameras provide 360 degree visibility around the car at up to 250 meters of range. Twelve enhanced ultrasonic sensors complement this vision, allowing for detection of both hard and soft objects at nearly twice the distance of the prior system, and computing power has been increased by 40-fold over our previous generation hardware. Fleet learning means that all Tesla vehicles with Autopilot will naturally get better over time. Additionally, new safety and convenience features will be rolled out via over-the-air software updates. Tesla vehicles have already been driven over 3 billion miles, including more than 1.3 billion miles logged by vehicles with Autopilot hardware.
Strong Operational Execution
In Q3, combined net orders for new Model S and Model X vehicles grew 68%, compared with the same period last year. During the quarter, we opened 17 new stores and service centers to increase our customer support network to 250 locations globally. We believe new product variants such as the P100DL, additional Model X seating variants, new product capabilities such as Enhanced Autopilot and hardware for Full Self-Driving Capability, Autopilot 8.0 software, and new store and service center openings should continue to drive strong vehicle order growth.
We achieved record production levels in Q3, rising to 25,185 vehicles for an increase of 37% from Q2 and an increase of 92% from Q3 last year.
Future Growth Initiatives
For Model 3, we have completed production line layouts and will soon begin installation of new body welding and final assembly lines. We have established a world class team of suppliers for Model 3 production equipment and components and critical long lead time equipment and components have been sourced. We are now testing vehicle systems such as chassis, the high voltage drive system, and low voltage subsystems such as vehicle controllers, HVAC, infotainment and lighting. As refinement of the Model 3 continues, we remain on plan for our timing, volume, vehicle capability, pricing, and margin targets.
The Gigafactory remains on track to begin cell production later this year for use initially in our energy storage products and later to support volume production and deliveries of Model 3 in the second half of 2017. In addition, we continue to expand production capacity at our Fremont facility and are exploring additional production capacity in Asia and Europe.
With the previously announced plan to acquire SolarCity, we look forward to making solar as compelling as electric vehicles. Acquiring SolarCity would leverage Teslas existing investments in the Gigafactory and the next-generation Powerwall and Powerpack to drive revenue growth. In addition to the revenue growth associated with making solar more compelling, the combined company is expected to achieve over $150 million of direct cost synergies in the first full year post-close. Over the coming days, there will be a number of additional events relating to the SolarCity acquisition and our strategic plan for the combined company:
| | October 28th: Product demonstration event to unveil an integrated solar roof with next-generation energy storage and EV charging. |
| | November 1st: Additional information to be released about the combined company. |
| | November 17th: Stockholder meeting to tally the final vote on the acquisition. |
Q3 Results
Starting this quarter, our financial releases no longer include the non-GAAP revenue disclosures that we historically provided. To simplify our financial reporting, we add back non-cash stock-based compensation (SBC) to calculate non-GAAP results. Consistent with previous quarters, non-GAAP automotive gross margin will also exclude ZEV credit sales.
Total Q3 GAAP revenue was $2.30 billion, up 145% from Q3 2015, while total Q3 gross margin was 27.7%, compared to 21.6% in Q2.
Total automotive revenue was $2.15 billion on a GAAP basis, up 152% from Q3 2015. Our final Q3 delivery count was 24,821, over 300 more than the estimated delivery count we shared on October 2nd. Deliveries increased 114% from the third quarter of 2015, and was comprised of 16,047 Model S and 8,774 Model X vehicles. In addition, 5,065 vehicles were in transit to customers at the end of the quarter. These vehicles will be delivered in Q4.
In Q3, deliveries where we retain residual risk, and thus were subject to lease accounting, were 32% of total deliveries, down from 36% in Q2. The elimination of resale value guarantees in the U.S. in Q3 had no impact on demand, signaling strong consumer confidence in the long-term value of our vehicles. During Q3, we were asked to repurchase fewer than 2% of vehicles eligible for buy back under our resale value guarantee program.
Q3 GAAP Total automotive gross margin was 29.4%, while non-GAAP Automotive gross margin was 25.0% excluding SBC and $139 million of ZEV credit revenue. Non-GAAP automotive gross margin excluding ZEV credits increased 140 basis points sequentially because of improved manufacturing efficiency and higher production volume. Reliability of our vehicles continues to improve and our warranty accrual rates on new and used vehicles declined from Q2 to Q3. The amount of issues that we have addressed with Model X have fallen by 92% in the last 12 months, a reflection of the improvements we have made in Model X due to our ability and commitment to react quickly to issues.
Model S average prices decreased 6.5% sequentially, primarily due to the introduction of the 60 kWh models and production of the 100 kWh variants only starting late in Q3, which would otherwise have balanced that out. 2% of the decline was due to price adjustments that were made for inventory cars that already had mileage on them, showroom cars with wear, and cars that were built before product transitions, such as those with the original fascia. Model X average prices declined 1.2% sequentially as we increased production beyond just the highest-priced Q2 Signature builds.
Q3 Services and other revenue was $150 million, up 78% from Q3 2015 and up 70% sequentially from Q2. The increase was primarily due to higher sales of used vehicles and stationary storage products. Q3 Services and other gross margin was 3.4%, up from 2.5% in Q2, and generally in line with our expectations.
Total Q3 GAAP operating expenses were $551 million, including $81 million of SBC. After excluding SBC, non-GAAP operating expenses were $471 million, up 4% from Q2. GAAP research and development expenses were $214 million, including $40 million of SBC. Excluding SBC, non-GAAP research and development expenses increased 10% sequentially to $174 million, as vehicle development programs accelerate. GAAP sales, general and administrative expenses were $337 million, including $41 million of SBC. After excluding SBC, non-GAAP sales, general and administrative expenses of $296 million were up 1% sequentially, demonstrating our efforts to increase operating leverage.
Our Q3 GAAP net income was $22 million, or $0.14 per share on 157 million diluted shares, while our non-GAAP net income was $111 million, or $0.71 per share on a diluted basis, after adding back $90 million of SBC. Both figures include an $0.08 per share loss of other expense, net, primarily related to foreign currency transactions and the conversion of most of our 2018 convertible notes.
Our cash flow from operations during the quarter was $424 million due to increased sales, coupled with careful expense management. Free cash flow was $176 million as we invested $248 million in capital expenditures to increase production capacity, accelerate
Gigafactory construction, and expand customer support infrastructure. Capital expenditures remain on plan to help us reach our goal of producing 500,000 vehicles in 2018. In addition, we collected $173 million of cash inflows from vehicle sales to our bank leasing partners, which are not included in cash flow from operations.
With our strong cash flows this quarter, we were able to reduce the balances on our borrowing facilities by $178 million and settle $422 million of conversions on our 2018 convertible notes, strengthening our balance sheet. After this $600 million in debt repayment, cash and cash equivalents were $3.1 billion at quarter end, compared with $3.2 billion at the end of Q2.
Our sources of liquidity expanded in the quarter as we were able to increase our borrowing capacity with the addition of a $300 million retail lease financing facility. We were also able to expand our indirect leasing capacity for our customers as our largest partner in the U.S. increased our capacity with them by over 80%. We are also adding a new leasing partner in the fourth quarter of 2016. These increases will allow us to continue to provide attractive and convenient financing sources for our customers.
Outlook
We maintain our guidance of 50,000 new vehicle deliveries for the second half of 2016, with a Q4 plan of just over 25,000 deliveries, despite the challenges of winter weather and the holiday season. We expect about 30% to 35% of these deliveries to be accounted for as leases for revenue recognition purposes.
As previously provided in our second quarter update, we guided a 2 to 3 percentage points improvement in automotive gross margin on a GAAP and non-GAAP basis by the end of 2016. Automotive gross margin on a non-GAAP basis excludes ZEV credits and SBC. We are on track to meet this guidance.
We also guided in our second quarter update that full year 2016 operating expenses, both on a GAAP and non-GAAP basis, would grow approximately 30% from 2015. We are also on track to meet this guidance.
We now expect our capital expenditures in 2016 will be approximately $1.8 billion as we continue to focus on capital efficiency. Capital expenditures for the past three quarters totaled $759 million.
We plan to continue demonstrating strong execution against established goals while also creating new opportunities for future growth.
|
Elon Musk, Chairman & CEO |
Jason Wheeler, Chief Financial Officer |
Webcast Information
Tesla will provide a live webcast of its third quarter 2016 financial results conference call beginning at 2:30 p.m. PT on October 26, 2016, at ir.tesla.com. This webcast will also be available for replay for approximately one year thereafter.
Non-GAAP Financial Information
Consolidated financial information has been presented in accordance with GAAP as well as on a non-GAAP basis to supplement our consolidated financial results. Our non-GAAP financial measures include non-GAAP gross margin, non-GAAP net income (loss), non-GAAP net income (loss) on a per share basis, free cash flow, and operating cash flows plus change in collateralized lease borrowing. Management believes that it is useful to supplement its GAAP financial statements with this non-GAAP information because management uses such information internally for its operating, budgeting and financial planning purposes. These non-GAAP financial measures also facilitate managements internal comparisons to Teslas historical performance as well as comparisons to the operating results of other companies. Management also believes that presentation of the non-GAAP financial measures provides useful information to our investors regarding our financial condition and results of operations because it allows investors greater transparency to the information used by Tesla management in its financial and operational decision-making so that investors can see through the eyes of Tesla management regarding important financial metrics that Tesla management uses to run the business as well as allows investors to better understand Teslas performance. Non-GAAP information is not prepared under a comprehensive set of accounting rules and therefore, should only be read in conjunction with financial information reported under U.S. GAAP when understanding Teslas operating performance. A reconciliation between GAAP and non-GAAP financial information is provided below.
Forward-Looking Statements
Certain statements in this shareholder letter, including statements in the Outlook section; statements relating to the progress Tesla is making with respect to product development; statements regarding growth in the number of Tesla store, service center and Supercharger locations; statements relating to the production and delivery timing of future products such as Model 3; growth in demand and orders for Tesla products and the catalysts for that growth; the ability to achieve product demand, volume, production, delivery, revenue, cash flow, leasing, gross margin, spending, capital expenditure and profitability targets; productivity improvements and capacity expansion plans; statements regarding future sources of liquidity; Tesla Gigafactory timing, plans and output expectations, including those related to cell and other production; and opportunities for product innovation and integration with SolarCity, as well as expected cost synergies, are forward-looking statements that are subject to risks and uncertainties. These forward-looking statements are based on managements current expectations, and as a result of certain risks and uncertainties, actual results may differ materially from those projected. The following important factors, without limitation, could cause actual results to differ materially from those in the forward-looking statements: the risk of delays in the manufacture, production and delivery of Model S and Model X vehicles and energy products, and production and delivery of Model 3 vehicles; the ability to design and achieve market acceptance of Model S and its variants, as well as new vehicle models, specifically Model X and Model 3; the ability of suppliers to meet quality and part delivery expectations at increasing volumes; adverse foreign exchange movements; any failures by Tesla products to perform as expected or if product recalls occur; Teslas ability to continue to reduce or control manufacturing and other costs; consumers willingness to adopt electric vehicles; competition in the automotive market generally and the alternative fuel vehicle market in particular; Teslas ability to establish, maintain and strengthen the Tesla brand; Teslas ability to manage future growth effectively as we rapidly grow, especially internationally; the unavailability, reduction or elimination of government and economic incentives for electric vehicles; Teslas ability to establish, maintain and strengthen its relationships with strategic partners such as Panasonic; potential difficulties in finalizing, performing and realizing potential benefits under definitive agreements for the Tesla Gigafactory site, obtaining permits and incentives, negotiating terms with technology, materials and other partners for Gigafactory, and maintaining Gigafactory implementation schedules, output and costs estimates; and Teslas ability to execute on its retail strategy and for new store, service center and Tesla Supercharger openings. More information on potential factors that could affect our financial results is included from time to time in our Securities and Exchange Commission filings and reports, including the risks identified under the section captioned Risk Factors in our quarterly report on Form 10-Q filed with the SEC on August 5, 2016. Tesla disclaims any obligation to update information contained in these forward-looking statements whether as a result of new information, future events, or otherwise.
| Investor Relations Contact: Jeff Evanson Investor Relations ir@tesla.com |
Press Contact: Sarah OBrien Communications press@tesla.com |
Tesla Motors, Inc.
Condensed Consolidated Statements of Operations
(Unaudited)
(In thousands, except per share data)
| Three Months Ended | Nine Months Ended | |||||||||||||||||||
| Sept 30, 2016 |
June 30, 2016 |
Sept 30, 2015 |
Sept 30, 2016 |
Sept 30, 2015 |
||||||||||||||||
| Revenues |
||||||||||||||||||||
| Automotive |
$ | 1,917,442 | $ | 1,030,224 | $ | 769,015 | $ | 3,849,558 | $ | 2,417,247 | ||||||||||
| Automotive leasing |
231,285 | 151,628 | 83,540 | 507,085 | 206,718 | |||||||||||||||
|
|
|
|
|
|
|
|
|
|
|
|||||||||||
| Total automotive revenue |
$ | 2,148,727 | $ | 1,181,852 | $ | 852,555 | $ | 4,356,643 | $ | 2,623,965 | ||||||||||
|
|
|
|
|
|
|
|
|
|
|
|||||||||||
| Services and other |
149,709 | 88,165 | 84,234 | 358,858 | 207,680 | |||||||||||||||
|
|
|
|
|
|
|
|
|
|
|
|||||||||||
| Total revenues |
$ | 2,298,436 | $ | 1,270,017 | $ | 936,789 | $ | 4,715,501 | $ | 2,831,645 | ||||||||||
|
|
|
|
|
|
|
|
|
|
|
|||||||||||
| Cost of revenues |
||||||||||||||||||||
| Automotive |
1,355,102 | 827,230 | 582,545 | 2,895,483 | 1,808,576 | |||||||||||||||
| Automotive leasing |
161,959 | 82,052 | 46,184 | 310,176 | 118,284 | |||||||||||||||
|
|
|
|
|
|
|
|
|
|
|
|||||||||||
| Total automotive cost of revenues |
$ | 1,517,061 | $ | 909,282 | $ | 628,729 | $ | 3,205,659 | 1,926,860 | |||||||||||
|
|
|
|
|
|
|
|
|
|
|
|||||||||||
| Services and other |
144,640 | 85,959 | 76,564 | 345,863 | 199,846 | |||||||||||||||
|
|
|
|
|
|
|
|
|
|
|
|||||||||||
| Total cost of revenues (1) |
$ | 1,661,701 | $ | 995,241 | $ | 705,293 | $ | 3,551,522 | $ | 2,126,706 | ||||||||||
|
|
|
|
|
|
|
|
|
|
|
|||||||||||
| Gross profit |
$ | 636,735 | $ | 274,776 | $ | 231,496 | $ | 1,163,979 | $ | 704,939 | ||||||||||
| Operating expenses |
||||||||||||||||||||
| Research and development (1) |
$ | 214,302 | $ | 191,664 | $ | 178,791 | $ | 588,448 | $ | 527,657 | ||||||||||
| Selling, general and administrative (1) |
336,811 | 321,152 | 236,367 | 976,173 | 633,578 | |||||||||||||||
|
|
|
|
|
|
|
|
|
|
|
|||||||||||
| Total operating expenses |
$ | 551,113 | $ | 512,816 | $ | 415,158 | $ | 1,564,621 | $ | 1,161,235 | ||||||||||
|
|
|
|
|
|
|
|
|
|
|
|||||||||||
| Income (loss) from operations |
85,622 | (238,040 | ) | (183,662 | ) | (400,642 | ) | (456,296 | ) | |||||||||||
| Interest income |
2,858 | 2,242 | 327 | 6,351 | 758 | |||||||||||||||
| Interest expense (2) |
(46,713 | ) | (46,368 | ) | (29,308 | ) | (133,706 | ) | (80,234 | ) | ||||||||||
| Other expense, net |
(11,756 | ) | (7,373 | ) | (15,431 | ) | (9,952 | ) | (24,503 | ) | ||||||||||
|
|
|
|
|
|
|
|
|
|
|
|||||||||||
| Income (loss) before income taxes |
$ | 30,011 | $ | (289,539 | ) | $ | (228,074 | ) | $ | (537,949 | ) | $ | (560,275 | ) | ||||||
| Provision for income taxes |
8,133 | 3,649 | 1,784 | 15,628 | 7,991 | |||||||||||||||
|
|
|
|
|
|
|
|
|
|
|
|||||||||||
| Net income (loss) |
$ | 21,878 | $ | (293,188 | ) | $ | (229,858 | ) | $ | (553,577 | ) | $ | (568,266 | ) | ||||||
|
|
|
|
|
|
|
|
|
|
|
|||||||||||
| Net income (loss) per common share: |
||||||||||||||||||||
| Basic |
$ | 0.15 | $ | (2.09 | ) | $ | (1.78 | ) | $ | (3.94 | ) | $ | (4.47 | ) | ||||||
|
|
|
|
|
|
|
|
|
|
|
|||||||||||
| Diluted |
$ | 0.14 | $ | (2.09 | ) | $ | (1.78 | ) | $ | (3.94 | ) | $ | (4.47 | ) | ||||||
|
|
|
|
|
|
|
|
|
|
|
|||||||||||
| Shares used in per share calculation: |
||||||||||||||||||||
| Basic |
148,991 | 139,983 | 129,006 | 140,581 | 127,225 | |||||||||||||||
|
|
|
|
|
|
|
|
|
|
|
|||||||||||
| Diluted |
156,935 | 139,983 | 129,006 | 140,581 | 127,225 | |||||||||||||||
|
|
|
|
|
|
|
|
|
|
|
|||||||||||
Notes:
| (1) | Includes stock-based compensation expense of the following for the periods presented: |
| Cost of revenues |
$ | 8,939 | $ | 6,495 | $ | 3,828 | $ | 21,837 | $ | 13,249 | ||||||||||
| Research and development |
40,220 | 33,506 | 24,153 | 113,328 | 63,857 | |||||||||||||||
| Selling, general and administrative |
40,384 | 27,311 | 28,052 | 111,347 | 65,288 | |||||||||||||||
|
|
|
|
|
|
|
|
|
|
|
|||||||||||
| Total stock-based compensation expense |
$ | 89,543 | $ | 67,312 | $ | 56,033 | $ | 246,512 | $ | 142,394 | ||||||||||
|
|
|
|
|
|
|
|
|
|
|
|||||||||||
| (2) | Interest expense includes non-cash interest expense related to convertible notes and other borrowing. For the three months ended September 30, 2016, June 30, 2016, and September 30, 2015, non-cash interest expense related to convertible notes and other borrowing were $33.1 million, $31.8 million, and $21.8 million, respectively. For the nine months ended September 30, 2016 and 2015, non-cash interest expense related to convertible notes and other borrowings were $93.9 million and $59.5 million. |
Tesla Motors, Inc.
Condensed Consolidated Balance Sheets
(Unaudited)
(In thousands)
| Sept 30, 2016 |
Dec 31, 2015 |
|||||||
| Assets |
||||||||
| Cash and cash equivalents |
$ | 3,084,257 | $ | 1,196,908 | ||||
| Restricted cash and marketable securities - current |
23,711 | 22,628 | ||||||
| Accounts receivable |
326,895 | 168,965 | ||||||
| Inventory |
1,604,571 | 1,277,838 | ||||||
| Prepaid expenses and other current assets |
132,978 | 115,667 | ||||||
| Operating lease vehicles, net (1) |
2,949,297 | 1,791,403 | ||||||
| Property and equipment, net |
4,309,048 | 3,403,334 | ||||||
| Restricted cash - noncurrent |
90,994 | 31,522 | ||||||
| Other assets |
70,646 | 59,674 | ||||||
|
|
|
|
|
|||||
| Total assets |
$ | 12,592,397 | $ | 8,067,939 | ||||
|
|
|
|
|
|||||
| Liabilities and Stockholders Equity |
||||||||
| Accounts payable and accrued liabilities |
$ | 2,301,302 | $ | 1,338,946 | ||||
| Deferred revenue (2) |
1,411,155 | 1,006,897 | ||||||
| Customer deposits |
690,364 | 283,370 | ||||||
| Long-term debt and capital leases |
2,704,191 | 2,649,020 | ||||||
| Other long-term liabilities (3) |
2,793,627 | 1,658,717 | ||||||
|
|
|
|
|
|||||
| Total liabilities |
9,900,639 | 6,936,950 | ||||||
| Mezzanine equity (4) |
11,270 | 47,285 | ||||||
| Stockholders equity |
2,680,488 | 1,083,704 | ||||||
|
|
|
|
|
|||||
| Total liabilities and stockholders equity |
$ | 12,592,397 | $ | 8,067,939 | ||||
|
|
|
|
|
|||||
| Notes: |
| (1) Includes the following increase in operating lease vehicles related to deliveries and subject to lease accounting, net of depreciation recognized in automotive cost of sales, for the following periods: |
| Resale value guarantee program (and other vehicles with similar buy-back terms) |
||||||||
| Beginning balance |
$ | 1,556,528 | $ | 689,689 | ||||
| First quarter |
352,782 | 103,022 | ||||||
| Second quarter |
217,270 | 170,025 | ||||||
| Third quarter |
224,598 | 215,337 | ||||||
| Fourth quarter |
378,455 | |||||||
|
|
|
|
|
|||||
| Ending balance |
$ | 2,351,178 | $ | 1,556,528 | ||||
|
|
|
|
|
|||||
| Model S and Model X leasing program |
||||||||
| Beginning balance |
$ | 234,619 | $ | 81,636 | ||||
| First quarter |
99,976 | 35,687 | ||||||
| Second quarter |
72,252 | 39,587 | ||||||
| Third quarter |
190,975 | 25,162 | ||||||
| Fourth quarter |
52,547 | |||||||
|
|
|
|
|
|||||
| Ending balance |
$ | 597,822 | $ | 234,619 | ||||
|
|
|
|
|
|||||
| (2) Includes the following increase in deferred revenue related to deliveries with the resale value guarantee and similar programs and subject to lease accounting, net of revenue amortized to automotive sales, for the following periods: |
| Beginning balance |
$ | 679,131 | $ | 376,471 | ||||
| First quarter |
121,836 | 45,334 | ||||||
| Second quarter |
50,717 | 60,767 | ||||||
| Third quarter |
57,724 | 67,522 | ||||||
| Fourth quarter |
129,037 | |||||||
|
|
|
|
|
|||||
| Ending balance |
$ | 909,408 | $ | 679,131 | ||||
|
|
|
|
|
| (3) Includes the following increase in other liabilities related to deliveries with the resale value guarantee and similar programs and subject to lease accounting for the following periods: |
||||
| Beginning balance |
$ | 1,430,573 | $ | 487,879 | ||||
| First quarter |
344,926 | 118,341 | ||||||
| Second quarter |
231,848 | 186,957 | ||||||
| Third quarter |
252,776 | 245,133 | ||||||
| Fourth quarter |
392,263 | |||||||
|
|
|
|
|
|||||
| Ending balance |
$ | 2,260,123 | $ | 1,430,573 | ||||
|
|
|
|
|
| (4) Our common stock price exceeded the conversion threshold price of our convertible senior notes due 2018 (2018 Notes) issued in May 2013; therefore, the 2018 Notes are convertible at the holders option during the third quarter of 2016. As such, the carrying value of the 2018 Notes was classified as a current liability as of September 30, 2016 and the difference between the principal amount and the carrying value of the 2018 Notes was reflected as convertible debt in mezzanine equity on our condensed consolidated balance sheet as of September 30, 2016. |
||||
Tesla Motors, Inc.
Supplemental Consolidated Financial Information
(Unaudited)
(In thousands)
| Three Months Ended | Nine Months Ended | |||||||||||||||||||
| Sept 30, | June 30, | Sept 30, | Sept 30, | Sept 30, | ||||||||||||||||
| 2016 | 2016 | 2015 | 2016 | 2015 | ||||||||||||||||
| Selected Cash Flow Information |
||||||||||||||||||||
| Cash flows provided by (used in) operating activities |
$ | 423,650 | $ | 150,337 | $ | (203,340 | ) | $ | 324,380 | $ | (494,650 | ) | ||||||||
| Cash flows used in investing activities |
(268,006 | ) | (319,854 | ) | (404,090 | ) | (821,679 | ) | (1,259,271 | ) | ||||||||||
| Cash flows provided by (used in) financing activities |
(320,870 | ) | 1,976,584 | 893,978 | 2,371,149 | 1,298,485 | ||||||||||||||
| Other Selected Financial Information |
||||||||||||||||||||
| Cash flows provided by (used in) operating activities |
$ | 423,650 | $ | 150,337 | $ | (203,340 | ) | $ | 324,380 | $ | (494,650 | ) | ||||||||
| Change in collateralized lease borrowing |
173,144 | 142,762 | 163,416 | 557,669 | 359,951 | |||||||||||||||
|
|
|
|
|
|
|
|
|
|
|
|||||||||||
| Operating cash flows plus change in collateralized lease borrowing |
$ | 596,794 | $ | 293,099 | $ | (39,924 | ) | $ | 882,049 | $ | (134,699 | ) | ||||||||
|
|
|
|
|
|
|
|
|
|
|
|||||||||||
| Capital expenditures |
$ | (247,611 | ) | $ | (294,720 | ) | $ | (392,403 | ) | $ | (759,190 | ) | $ | (1,223,628 | ) | |||||
| Depreciation and amortization |
$ | 280,468 | $ | 183,232 | $ | 110,366 | $ | 620,159 | $ | 278,867 | ||||||||||
| Free Cash Flow |
||||||||||||||||||||
| Cash flows provided by (used in) operating activities |
$ | 423,650 | $ | 150,337 | $ | (203,340 | ) | $ | 324,380 | $ | (494,650 | ) | ||||||||
| Capital expenditures |
(247,611 | ) | (294,720 | ) | (392,403 | ) | (759,190 | ) | (1,223,628 | ) | ||||||||||
|
|
|
|
|
|
|
|
|
|
|
|||||||||||
| Free cash flow |
$ | 176,039 | $ | (144,383 | ) | $ | (595,743 | ) | $ | (434,811 | ) | $ | (1,718,278 | ) | ||||||
|
|
|
|
|
|
|
|
|
|
|
|||||||||||
Supplemental Model S and Model X Leasing Program Information
(in thousands, except for vehicle deliveries)
| Three Months Ended | Nine Months Ended | |||||||||||||||||||
| Sept 30, 2016 |
June 30, 2016 |
Sept 30, 2015 |
Sept 30, 2016 |
Sept 30, 2015 |
||||||||||||||||
| Vehicles delivered |
2,934 | 1,132 | 494 | 5,471 | 1,718 | |||||||||||||||
| Average per unit price of vehicles delivered |
$ | 99 | $ | 103 | $ | 91 | $ | 105 | $ | 100 | ||||||||||
|
|
|
|
|
|
|
|
|
|
|
|||||||||||
| Aggregate value of vehicles delivered (1) |
$ | 291,324 | $ | 116,899 | $ | 44,804 | $ | 557,153 | $ | 171,290 | ||||||||||
|
|
|
|
|
|
|
|
|
|
|
|||||||||||
| Leasing revenue recognized |
$ | 31,387 | $ | 23,883 | $ | 11,514 | $ | 71,963 | $ | 27,211 | ||||||||||
| (1) | Aggregate value is the product of multiplying vehicles delivered by the average per unit price of vehicles delivered |
Tesla Motors, Inc.
Reconciliation of GAAP to Non-GAAP Financial Information
(Unaudited)
(In thousands, except per share data)
| Three Months Ended | Nine Months Ended | |||||||||||||||||||
| Sept 30, | June 30, | Sept 30, | Sept 30, | Sept 30, | ||||||||||||||||
| 2016 | 2016 | 2015 | 2016 | 2015 | ||||||||||||||||
| Automotive gross profit - GAAP |
$ | 631,666 | $ | 272,570 | $ | 223,826 | $ | 1,150,984 | $ | 697,105 | ||||||||||
| Stock-based compensation expense |
8,939 | 6,495 | 3,828 | 21,837 | 13,249 | |||||||||||||||
| ZEV credit revenue recognized |
(138,541 | ) | (64 | ) | (38,594 | ) | (195,592 | ) | (103,880 | ) | ||||||||||
|
|
|
|
|
|
|
|
|
|
|
|||||||||||
| Automotive gross profit excluding ZEV credit - Non-GAAP |
$ | 502,064 | $ | 279,001 | $ | 189,060 | $ | 977,229 | $ | 606,474 | ||||||||||
|
|
|
|
|
|
|
|
|
|
|
|||||||||||
| Automotive gross margin excluding ZEV credit - Non-GAAP |
25.0 | % | 23.6 | % | 23.2 | % | 23.5 | % | 24.1 | % | ||||||||||
| Research and development expenses - GAAP |
$ | 214,302 | $ | 191,664 | $ | 178,791 | $ | 588,448 | $ | 527,657 | ||||||||||
| Stock-based compensation expense |
(40,220 | ) | (33,506 | ) | (24,153 | ) | (113,328 | ) | (63,857 | ) | ||||||||||
|
|
|
|
|
|
|
|
|
|
|
|||||||||||
| Research and development expenses - Non-GAAP |
$ | 174,082 | $ | 158,158 | $ | 154,638 | $ | 475,120 | $ | 463,800 | ||||||||||
|
|
|
|
|
|
|
|
|
|
|
|||||||||||
| Selling, general and administrative expenses - GAAP |
$ | 336,811 | $ | 321,152 | $ | 236,367 | $ | 976,173 | $ | 633,578 | ||||||||||
| Stock-based compensation expense |
(40,384 | ) | (27,311 | ) | (28,052 | ) | (111,347 | ) | (65,288 | ) | ||||||||||
|
|
|
|
|
|
|
|
|
|
|
|||||||||||
| Selling, general and administrative expenses - Non-GAAP |
$ | 296,427 | $ | 293,841 | $ | 208,315 | $ | 864,826 | $ | 568,290 | ||||||||||
|
|
|
|
|
|
|
|
|
|
|
|||||||||||
| Net Income (loss) - GAAP |
$ | 21,878 | $ | (293,188 | ) | $ | (229,858 | ) | $ | (553,577 | ) | $ | (568,266 | ) | ||||||
| Stock-based compensation expense |
89,543 | 67,312 | 56,033 | 246,512 | 142,393 | |||||||||||||||
|
|
|
|
|
|
|
|
|
|
|
|||||||||||
| Net income (loss) - Non-GAAP |
$ | 111,421 | $ | (225,876 | ) | $ | (173,825 | ) | $ | (307,065 | ) | $ | (425,873 | ) | ||||||
|
|
|
|
|
|
|
|
|
|
|
|||||||||||
| Net income (loss) per share, basic - GAAP |
$ | 0.15 | $ | (2.09 | ) | $ | (1.78 | ) | $ | (3.94 | ) | $ | (4.47 | ) | ||||||
| Stock-based compensation expense |
0.60 | 0.48 | 0.43 | 1.76 | 1.12 | |||||||||||||||
|
|
|
|
|
|
|
|
|
|
|
|||||||||||
| Net income (loss) per share, basic - Non-GAAP |
$ | 0.75 | $ | (1.61 | ) | $ | (1.35 | ) | $ | (2.18 | ) | $ | (3.35 | ) | ||||||
|
|
|
|
|
|
|
|
|
|
|
|||||||||||
| Shares used in per share calculation, basic - GAAP and Non-GAAP |
148,991 | 139,983 | 129,006 | 140,581 | 127,225 | |||||||||||||||
|
|
|
|
|
|
|
|
|
|
|
|||||||||||
| Net income (loss) per share, diluted - GAAP |
$ | 0.14 | $ | (2.09 | ) | $ | (1.78 | ) | $ | (3.94 | ) | $ | (4.47 | ) | ||||||
| Stock-based compensation expense |
0.57 | 0.48 | 0.43 | 1.76 | 1.12 | |||||||||||||||
|
|
|
|
|
|
|
|
|
|
|
|||||||||||
| Net income (loss) per share, diluted - Non-GAAP |
$ | 0.71 | $ | (1.61 | ) | $ | (1.35 | ) | $ | (2.18 | ) | $ | (3.35 | ) | ||||||
|
|
|
|
|
|
|
|
|
|
|
|||||||||||
| Shares used in per share calculation, diluted - GAAP and Non-GAAP |
156,935 | 139,983 | 129,006 | 140,581 | 127,225 | |||||||||||||||
|
|
|
|
|
|
|
|
|
|
|
|||||||||||

This is our first comment on Tesla, so let's start with the highlights. This is the first time Tesla has booked a net profit, under honest-to-goodness GAAP standards, since Q1 2013. That's a win. What's even better is the free cash flow -- and it looks legit. Later in the statement, Tesla details that it generated $424 million in cashflow. Minus $248 million capex, that leaves $176 million as real cash profit. Kudos.
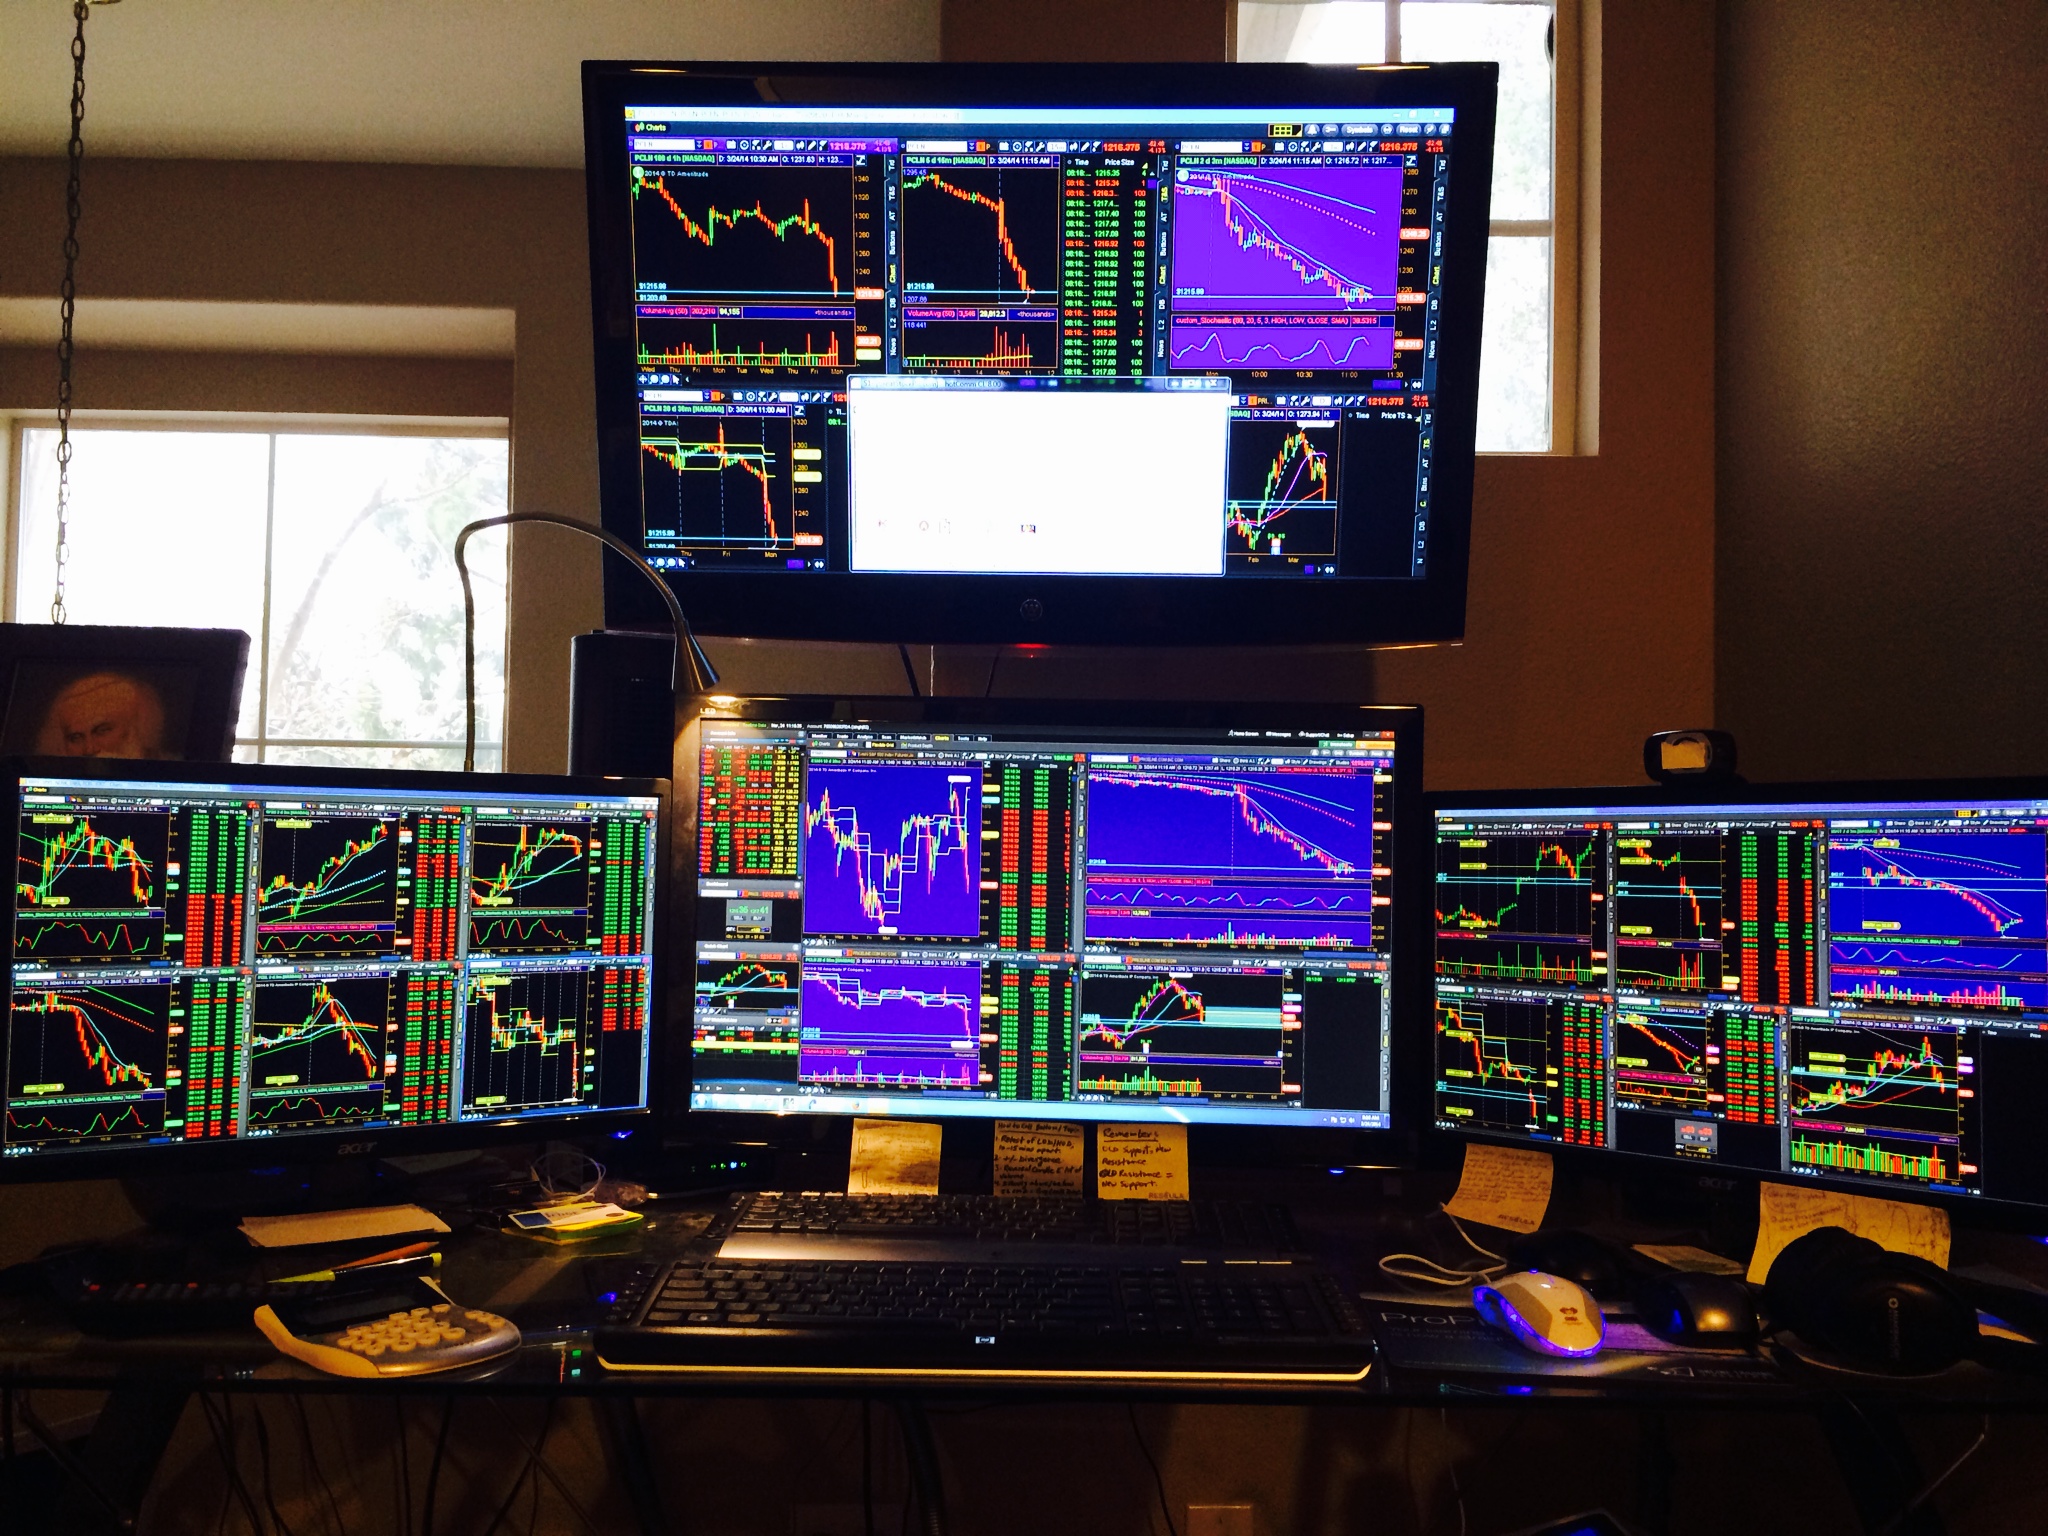
I believe investors need to look at this company using fundamental and technical analysis to completely understand why they should or shouldn't invest in this company for longer term. First of all, its clear that growth is substantial for Tesla. With growth, comes expenses such as buying parts and partnering up with other crucial companies. Needless to say, Tesla has proving the increase in revenue, deliveries, and vehicle production. So fundamentally, this company is solid; infact it reminds more like when Apple emerged but it took a while for the stock to rise. Now, lets talk about technical point of view which many need to understand the basics of supply and demand. Chart analysis is clearly showing that price has been sideways since 2014 and one can easily conclude that there is not demand for the stock to rise (remember I am talking about technical picture not fundamental). Once the price, breaks out of 180-270 range; we will see a trend being developed. Now if fundamentals keep showing strong numbers, one can safely predict that the stock will turn bullish. Hopefully, you register for the model 3 because I wouldn't want to miss out on the federal rebate of upto $7500.

Musk put in a bid for 2.6 billion in order to acquire Solar City's 3.25 billion dollar debt which by the way has only taken 3 years to reach. Since the 2012 IPO of ticker symbol $SCTY the company has posted losses in all but three quarters. Negative cash flow and interest payment obligations continue to grow making this nothing more but a bail out deal for the clean energy firm. Musk has purchased 165 million out of the 200 million in solar bonds that Solar City has managed to sell. Although the investment is high yield it is not FDIC insured which guarantees for greater risk on earnings and principle.
As finance cost continues to move higher Solar City already has a hard time competing with local installers as the demand decreases for solar leases. If that is the case then Tesla will have a difficult time turning things around as more cash flow is required in order to implicate a new strategical approach.