Tesla Motors Inc 8-K 2014-02-19
Sign in or join
Add a note by highlighting text or Replying to an existing note.
Add a note by highlighting text or Replying to an existing note.
Exhibit 99.1

|
Tesla Motors, Inc. Fourth Quarter & Full Year 2013 Shareholder Letter
Record 6,892 Model S vehicles sold and delivered in Q4
Worlds highest Consumer Reports customer satisfaction score of 99/100
Q4 auto gross margin of 25% with no zero emission vehicle (ZEV) credit revenue
Supercharger network built across most of USA and Northwest Europe
Net income of $46M and $0.33 EPS (non-GAAP), loss of $16M and $(0.13) EPS (GAAP) in Q4
Positive free cash flow of $40M in Q4
Expecting over 55% vehicle delivery growth in 2014 and 28% auto GM by Q4
|
February 19, 2014
Dear Fellow Shareholders:
Last quarter, we had record deliveries of 6,892 vehicles and exceeded our target automotive gross margin of 25%, achieving 25.2% on a non-GAAP basis and 25.8% on a GAAP basis. This capped a year in which we delivered 22,477 vehicles, resulting in almost $2.5 billion in sales on a non-GAAP basis and over $2 billion in sales on a GAAP basis. It is important to note that the differences between GAAP and non-GAAP are primarily due to lease accounting for our resale value guarantee (RVG) and employee stock based compensation as a result of the increase in our stock price last year. With 20 months since delivery of the first vehicles to customers, Model S continues to track to an outstanding residual value, with very few cars available for resale. If current trends continue, the average price of a used Model S should be meaningfully above our resale value guarantee.
For the year, Model S was the top selling vehicle in North America among comparably priced cars. Nonetheless, we believe there is room to improve in 2014 as we complete the Supercharger network and enable vehicle service almost anywhere in North America. The potential in Europe and Asia is even more significant. Towards the end of the year, we expect sales in those regions combined to be almost twice that of North America.
As volume increases, additional economies of scale will come into play, resulting in further improvements in gross margin. We think an automotive gross margin of 28%, excluding potential ZEV credit sales, is a reasonable target for Q4 2014, even if a lower option take rate is assumed. Please note that Tesla is not trying to achieve the absolute highest possible gross margin, as this would require following the industry practice of charging excessive prices to customers in certain markets, which we believe is inconsistent with building long term loyalty.
Enhancing the Customer Experience
| Model S customers are proving that owning a well-engineered electric vehicle can be a superior ownership experience over a gasoline-powered car. Our rapidly growing customer base has driven Model S almost 200 million cumulative miles, and we believe that more than 80% of our customers are using their Model S as their primary vehicle.
Our goal is to deliver the highest possible level of ownership satisfaction in every way. For example, in Q4 we rapidly expanded our service locations and reduced repair turnaround time. One measure of customer satisfaction is a survey completed after each service in which almost 90% of customers rate our service at 9 or better on a 10 point scale, where 10 is best and 1 is worst. We also recently made several enhancements to the Model S through software updates and added small, but important, features such as power folding mirrors and parking sensors. |
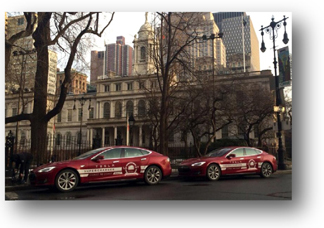
Tesla Coast-to-Coast Supercharger Rally |
Our efforts were validated in November by Consumer Reports owner satisfaction survey, which gave Model S a score of 99 out of 100, the highest satisfaction score of any car in the world. The next highest score was 95.
To further enhance the driver experience, new Model S customers will now receive free data connectivity and Internet radio for four years. As an added benefit to our existing Model S customers, the free four year period starts on January 1, 2014. To be fair to all, in rare cases a customer may be charged for extreme data use.
The ability of our customers to charge for free with our Supercharger network is another core element of the Tesla experience. It is now possible for Model S owners to make convenient long distance trips along the west or east coasts and from Los Angeles to New York without ever taking out their wallets. In late January, one of our customers made the first Supercharged Model S trip from New York to Los Angeles in the dead of winter, encountering temperatures as low as -22o F. He and his daughter completed the trip in just six days. Shortly thereafter, a Tesla team completed the coast-to-coast trip using only the Supercharger network in just over 76 hours, despite encountering blizzards, road closures and a sand storm on various parts of the journey.
Expanding Tesla Globally
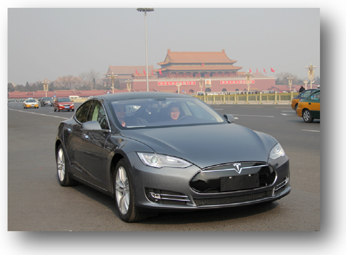
The first Model S deliveries to China are scheduled for this spring. We plan to make substantial investments in China this year as we add new stores, service centers and a Supercharger network. Already, the Beijing store is our largest and most active retail location in the world.
|
A Model S Test Drive in China |
We strive for transparent and fair pricing in every market. Consistent with this goal, the price for a Model S in China is the same as the price for a Model S in the US, adding only unavoidable taxes, customs duties and transportation costs. We are taking a risk with this strategy, because it is counter to prevailing auto industry practices. Still, we believe it is the right thing to do. It also means that in China the Model S is priced comparable to a mid-sized premium vehicle, instead of a large luxury vehicle.
In Germany and other European markets, we recently announced new, highly competitive leasing and financing options in collaboration with our growing team of global financial partners. |
Expansion into the right hand drive markets such as the United Kingdom, Japan, Hong Kong and Australia will occur gradually over the year starting this spring.
Quarterly Results
As usual, this letter includes both GAAP and non-GAAP financial information, because we consider non-GAAP information in our planning and management processes. Non-GAAP financials exclude stock-based compensation and non-cash interest expense, and add back the deferred revenue and related costs for cars sold with an RVG. Obtaining financing via our bank partners and getting an RVG from us continues to remain popular with our U.S. customers, as we delivered 1,667 cars with an RVG in Q4.
For the quarter, non-GAAP revenue was $761 million, up 26% from Q3. GAAP revenue for Q4 was $615 million, up 43% from Q3. We produced more cars than originally expected in the quarter, aided by manufacturing, design
and quality improvements, but also strong efforts from our supply chain. Both Toyota and Daimler powertrain programs remain on plan and contributed $13 million of revenue in the quarter. Q4 sales also included $15 million of regulatory credits revenue, but no zero emission vehicle (ZEV) credit sales.
During Q4, we achieved non-GAAP automotive gross margin of 25.2%, and 25.8% on a GAAP basis. We did this by reducing vehicle cost, primarily through component cost reductions as well as increased manufacturing and supply chain efficiency. Average pricing also remained strong due to a richer mix of 85 kWh cars and a high option take rate.
Research and development (R&D) expenses were $58 million non-GAAP and $68 million on a GAAP basis. Non-GAAP R&D was up 21% from Q3, as engineering work accelerated on Model X and efforts continued for the adaptation of Model S in international markets.
Selling, general and administrative (SG&A) expenses were $87 million non-GAAP and $101 million on a GAAP basis. Much of the 30% sequential increase in non-GAAP SG&A was driven by the expansion of our customer infrastructure.
| Q4 non-GAAP net income was $46 million, or $0.33 per share, while Q4 GAAP net loss was $16 million or $(0.13) per share. Both results include a $4.6 million net gain, or $0.03 per share from a favorable foreign currency impact.
Cash on hand increased to $846 million as of December 31, 2013, as we generated $130 million of operating cash flow (cash flow from operations less capital expenditures) and $40 million of positive free cash flow in the quarter. |
|
|
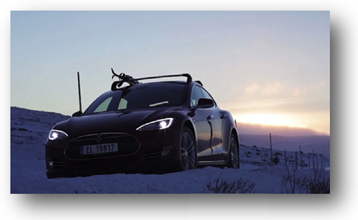
| Model S Conquers the Cold |
2014 Outlook
We expect to deliver over 35,000 Model S vehicles in 2014, representing a 55+% increase over 2013. Production is expected to increase from 600 cars/week presently to about 1,000 cars/week by end of the year as we expand our factory capacity and address supplier bottlenecks. Battery cell supply will continue to constrain our production in the first half of the year, but will improve significantly in the second half of 2014.
First quarter production is expected to be about 7,400 vehicles, which is significantly higher than the prior quarter production of 6,587 cars. However, as the number of cars in transit to Europe and Asia must grow substantially to support those markets, we plan to deliver approximately 6,400 vehicles in Q1. Deliveries will grow dramatically in future quarters as the logistics pipeline fills.
This year, we expect automotive gross margin to increase to about 28% (non-GAAP and GAAP) in Q4 through a series of small design improvements, better supplier prices and economies of scale. Q1 gross margin should increase very slightly from Q4. For the remainder of the year, gross margin should improve at a faster pace.
Operating expenses and capital expenditures will increase significantly in 2014, as we plan to invest in the long term growth of Tesla. We plan to expand production capacity for Model S and Model X, invest in our store, service and Supercharger infrastructure, complete the development of Model X and start early design work on our third generation car.
In Q1, operating expenses are expected to grow roughly 15%. R&D expenses will increase as design and engineering work accelerates on Model X. We expect to have production design Model X prototypes on the road by end of year and begin volume deliveries to customers in the spring of 2015. SG&A spending will grow as we expand globally our retail presence and add more Superchargers.
Very shortly, we will be ready to share more information about the Tesla Gigafactory. This will allow us to achieve a major reduction in the cost of our battery packs and accelerate the pace of battery innovation. Working in partnership with our suppliers, we plan to integrate precursor material, cell, module and pack production into one facility. With this facility, we feel highly confident of being able to create a compelling and affordable electric car in approximately three years. This will also allow us to address the solar power industrys need for a massive volume of stationary battery packs.
Looking forward to a very exciting 2014!

|

|
|
| Elon Musk, Chairman & CEO | Deepak Ahuja, Chief Financial Officer | |
Webcast Information
Tesla will provide a live webcast of its fourth quarter and full year 2013 financial results conference call beginning at 2:30 p.m. PT on February 19, 2014, at ir.teslamotors.com. This webcast will also be available for replay for approximately one year thereafter.
Non-GAAP Financial Information
Consolidated financial information has been presented in accordance with GAAP as well as on a non-GAAP basis. On a non-GAAP basis, financial measures exclude non-cash items such as stock-based compensation, the change in fair value related to Teslas warrant liability, non-cash interest expense related to Teslas 1.5% convertible senior notes as well as one-time expenses associated with the early repayment of the Department of Energy Loan. Non-GAAP financial measures also exclude the impact of lease accounting on Model S related revenues and cost of revenues, as this perspective is useful in understanding the underlying cash flow activity and timing of vehicle deliveries. Management believes that it is useful to supplement its GAAP financial statements with this non-GAAP information because management uses such information internally for its operating, budgeting and financial planning purposes. These non-GAAP financial measures also facilitate managements internal comparisons to Teslas historical performance as well as comparisons to the operating results of other companies. Non-GAAP information is not prepared under a comprehensive set of accounting rules and therefore, should only be read in conjunction with financial information reported under U.S. GAAP when understanding Teslas operating performance. A reconciliation between GAAP and non-GAAP financial information is provided below.
Forward-Looking Statements
Certain statements in this shareholder letter, including statements in the 2014 Outlook section of this Shareholder Letter; statements regarding profitability and free cash and cost reduction efforts; statements relating to the progress Tesla is making with respect to product development (including Model X and our third generation car), China and right hand drive market launch expectations, schedule for the introduction of future options and variants, quality improvements, delivery and volume expectations of Model S; the ability to achieve vehicle demand, volume, production, revenue, gross margin, spending, profitability and cash flow targets; future store, service center and Tesla Supercharger expected costs, openings and expansion plans and Tesla Gigafactory plans and expectations are forward-looking statements that are subject to risks and uncertainties. These forward-looking statements are based on managements current expectations, and as a result of certain risks and uncertainties, actual results may differ materially from those projected. The following important factors, without limitation, could cause actual results to differ materially from those in the forward-looking statements: Teslas future success depends on its ability to design and achieve market acceptance of Model S and other new vehicle models, specifically Model X; the risk of delays in the manufacture, production and delivery ramp of Model S vehicles; the ability of suppliers to meet quality and part delivery expectations at increasing volumes; Teslas ability to continue to reduce or control manufacutring and other costs; consumers willingness to adopt electric vehicles; competition in the automotive market generally and the alternative fuel vehicle market in particular; Teslas ability to establish, maintain and strengthen the Tesla brand; Teslas ability to manage future growth effectively as we rapidly grow, especially internationally; the unavailability, reduction or elimination of governmental and economic incentives for electric vehicles; Teslas ability to establish, maintain and strengthen its relationships with strategic partners such as Daimler, Toyota and Panasonic; and Teslas ability to execute on its retail strategy and for new store, service center and Tesla Supercharger openings. More information on potential factors that could affect the Companys financial results is included from time to time in Teslas Securities and Exchange Commission filings and reports, including the risks identified under the section captioned Risk Factors in our quarterly report on Form 10-Q filed with the SEC on November 8, 2013. Tesla disclaims any obligation to update information contained in these forward-looking statements whether as a result of new information, future events, or otherwise.
| Investor Relations Contact: | Press Contact: | |||
| Jeff Evanson | Liz Jarvis-Shean | |||
| VP Investor Relations Tesla Motors | Communications Tesla Motors | |||
| ir@teslamotors.com | ejs@teslamotors.com |
Tesla Motors, Inc.
Condensed Consolidated Statements of Operations
(Unaudited)
(In thousands, except per share data)
| Three Months Ended | Year Ended | |||||||||||||||||||
|
Dec 31, 2013 |
Sep 30, 2013 |
Dec 31, 2012 |
Dec 31, 2013 |
Dec 31, 2012 |
||||||||||||||||
| Revenues |
||||||||||||||||||||
| Automotive sales (1A) |
$ | 610,851 | $ | 430,196 | $ | 294,377 | $ | 1,997,786 | $ | 385,699 | ||||||||||
| Development services |
4,368 | 1,150 | 11,955 | 15,710 | 27,557 | |||||||||||||||
|
|
|
|
|
|
|
|
|
|
|
|||||||||||
| Total revenues |
615,219 | 431,346 | 306,332 | 2,013,496 | 413,256 | |||||||||||||||
|
|
|
|
|
|
|
|
|
|
|
|||||||||||
| Cost of revenues |
||||||||||||||||||||
| Automotive sales (1B) |
453,578 | 324,883 | 278,710 | 1,543,878 | 371,658 | |||||||||||||||
| Development services |
5,051 | 3,595 | 3,765 | 13,356 | 11,531 | |||||||||||||||
|
|
|
|
|
|
|
|
|
|
|
|||||||||||
| Total cost of revenues (2) |
458,629 | 328,478 | 282,475 | 1,557,234 | 383,189 | |||||||||||||||
|
|
|
|
|
|
|
|
|
|
|
|||||||||||
| Gross profit |
156,590 | 102,868 | 23,857 | 456,262 | 30,067 | |||||||||||||||
| Operating expenses |
||||||||||||||||||||
| Research and development (2) |
68,454 | 56,351 | 68,832 | 231,976 | 273,978 | |||||||||||||||
| Selling, general and administrative (2) |
101,489 | 77,071 | 45,908 | 285,569 | 150,372 | |||||||||||||||
|
|
|
|
|
|
|
|
|
|
|
|||||||||||
| Total operating expenses |
169,943 | 133,422 | 114,740 | 517,545 | 424,350 | |||||||||||||||
|
|
|
|
|
|
|
|
|
|
|
|||||||||||
| Loss from operations |
(13,353 | ) | (30,554 | ) | (90,883 | ) | (61,283 | ) | (394,283 | ) | ||||||||||
| Interest income |
92 | 68 | 85 | 189 | 288 | |||||||||||||||
| Interest expense |
(6,229 | ) | (6,492 | ) | (27 | ) | (32,934 | ) | (254 | ) | ||||||||||
| Other income (expense), net (3) |
4,584 | (740 | ) | 746 | 22,602 | (1,828 | ) | |||||||||||||
|
|
|
|
|
|
|
|
|
|
|
|||||||||||
| Loss before income taxes |
(14,906 | ) | (37,718 | ) | (90,079 | ) | (71,426 | ) | (396,077 | ) | ||||||||||
| Provision for (benefit from) income taxes |
1,358 | 778 | (147 | ) | 2,588 | 136 | ||||||||||||||
|
|
|
|
|
|
|
|
|
|
|
|||||||||||
| Net loss |
$ | (16,264 | ) | $ | (38,496 | ) | $ | (89,932 | ) | $ | (74,014 | ) | $ | (396,213 | ) | |||||
|
|
|
|
|
|
|
|
|
|
|
|||||||||||
| Net loss per common share, basic and diluted (4) |
$ | (0.13 | ) | $ | (0.32 | ) | $ | (0.79 | ) | $ | (0.62 | ) | $ | (3.69 | ) | |||||
|
|
|
|
|
|
|
|
|
|
|
|||||||||||
| Shares used in per share calculation, basic and diluted (4) |
122,802 | 121,862 | 113,763 | 119,421 | 107,349 | |||||||||||||||
|
|
|
|
|
|
|
|
|
|
|
|||||||||||
| Notes: | ||||||||||||||||||||
| (1) Due to the application of lease accounting for Model S vehicles with the resale value guarantee, the following is supplemental information for the periods presented: |
||||||||||||||||||||
| (A) Net increase in deferred revenue and other long-term liabilities as a result of lease accounting and therefore not recognized in automotive sales |
$ | 146,125 | $ | 171,229 | $ | 464,166 | ||||||||||||||
|
|
|
|
|
|
|
|||||||||||||||
| (B) Net increase in operating lease vehicles as a result of lease accounting and therefore not recognized in automotive cost of sales |
$ | 114,221 | $ | 138,839 | $ | 376,979 | ||||||||||||||
|
|
|
|
|
|
|
|||||||||||||||
| Under lease accounting, warranty costs are expensed as incurred instead of accrued at the time of sale. |
||||||||||||||||||||
| (2) Includes stock-based compensation expense of the following for the periods presented: |
||||||||||||||||||||
| Cost of revenues |
$ | 3,455 | $ | 3,017 | $ | 1,638 | $ | 9,071 | $ | 2,194 | ||||||||||
| Research and development |
10,578 | 8,707 | 7,159 | 35,494 | 26,580 | |||||||||||||||
| Selling, general and administrative |
14,056 | 9,715 | 5,619 | 39,090 | 21,371 | |||||||||||||||
|
|
|
|
|
|
|
|
|
|
|
|||||||||||
| Total stock-based compensation expense |
$ | 28,089 | $ | 21,439 | $ | 14,416 | $ | 83,655 | $ | 50,145 | ||||||||||
|
|
|
|
|
|
|
|
|
|
|
|||||||||||
| (3) Other income (expense), net, for the year ended December 31, 2013 includes the gain from the elimination of the $10.7 million Department of Energy (DoE) common stock warrant liability and an $11.9 million favorable foreign currency exchange impact. Other income (expense), net, for the three months ended December 31, 2013 includes a $4.6 million favorable foreign currency exchange impact. |
||||||||||
| (4) In May 2013, the Company completed a public offering pursuant to which the Company sold 3,902,862 shares of common stock. Concurrent with the closing of the offering, the Company sold 596,272 shares of common stock to Elon Musk in a private placement at the public offering price. |
||||||||||
Tesla Motors, Inc.
Condensed Consolidated Balance Sheets
(Unaudited)
(In thousands)
|
Dec 31, 2013 |
Dec 31, 2012 |
|||||||
| Assets |
||||||||
| Cash and cash equivalents |
$ | 845,889 | $ | 201,890 | ||||
| Restricted cash - current |
3,012 | 19,094 | ||||||
| Accounts receivable |
49,109 | 26,842 | ||||||
| Inventory |
340,355 | 268,504 | ||||||
| Prepaid expenses and other current assets |
27,574 | 8,438 | ||||||
| Operating lease vehicles, net (1) |
382,425 | 10,071 | ||||||
| Property and equipment, net |
738,494 | 552,229 | ||||||
| Restricted cash - noncurrent |
6,435 | 5,159 | ||||||
| Other assets |
23,637 | 21,963 | ||||||
|
|
|
|
|
|||||
| Total assets |
$ | 2,416,930 | $ | 1,114,190 | ||||
|
|
|
|
|
|||||
| Liabilities and Stockholders Equity |
||||||||
| Accounts payable and accrued liabilities |
$ | 412,221 | $ | 343,180 | ||||
| Deferred revenue (2) |
273,062 | 4,964 | ||||||
| Customer deposits |
163,153 | 138,817 | ||||||
| Common stock warrant liability |
| 10,692 | ||||||
| Capital lease obligations |
20,577 | 14,330 | ||||||
| Long-term debt |
586,301 | 452,337 | ||||||
| Other long-term liabilities (3) |
294,495 | 25,170 | ||||||
|
|
|
|
|
|||||
| Total liabilities |
1,749,809 | 989,490 | ||||||
| Stockholders equity |
667,121 | 124,700 | ||||||
|
|
|
|
|
|||||
| Total liabilities and stockholders equity |
$ | 2,416,930 | $ | 1,114,190 | ||||
|
|
|
|
|
|||||
| Notes: | ||||||||
| (1) Includes the following increase in operating lease vehicles related to deliveries of Model S with the resale value guarantee and subject to lease accounting, net of depreciation recognized in automotive cost of sales, for the following periods: |
||||||||
| Q2 2013 |
$ | 123,919 | ||||||
| Q3 2013 |
138,839 | |||||||
| Q4 2013 |
114,221 | |||||||
|
|
|
|||||||
| Net increase during the year ended December 31, 2013 |
$ | 376,979 | ||||||
|
|
|
|||||||
| (2) Includes the following increase in deferred revenue related to deliveries of Model S with the resale value guarantee and subject to lease accounting, net of revenue amortized to automotive sales for the following periods: |
||||||||
| Q2 2013 |
$ | 74,455 | ||||||
| Q3 2013 |
84,577 | |||||||
| Q4 2013 |
68,836 | |||||||
|
|
|
|||||||
| Net increase during the year ended December 31, 2013 |
$ | 227,868 | ||||||
|
|
|
|||||||
| (3) Includes the following increase in other long-term liabilities related to deliveries of Model S with the resale value guarantee and subject to lease accounting for the following periods: |
||||||||
| Q2 2013 |
$ | 72,357 | ||||||
| Q3 2013 |
86,652 | |||||||
| Q4 2013 |
77,289 | |||||||
|
|
|
|||||||
| Net increase during the year ended December 31, 2013 |
$ | 236,298 | ||||||
|
|
|
|||||||
Tesla Motors, Inc.
Supplemental Consolidated Financial Information
(Unaudited)
(In thousands)
| Three Months Ended | Year Ended | |||||||||||||||||||
|
Dec 31, 2013 |
Sep 30, 2013 |
Dec 31, 2012 |
Dec 31, 2013 |
Dec 31, 2012 |
||||||||||||||||
| Selected Cash Flow Information |
||||||||||||||||||||
| Cash flows provided by (used in) operating activities |
$ | 129,763 | $ | 102,343 | $ | (37,489 | ) | $ | 257,994 | $ | (266,081 | ) | ||||||||
| Cash flows used in investing activities |
(89,507 | ) | (77,501 | ) | (60,758 | ) | (249,417 | ) | (206,930 | ) | ||||||||||
| Cash flows provided by financing activities |
10,517 | 24,216 | 214,444 | 635,422 | 419,635 | |||||||||||||||
| Other Selected Financial Information |
||||||||||||||||||||
| Cash flows provided by (used in) operating activities |
$ | 129,763 | $ | 102,343 | $ | (37,489 | ) | $ | 257,994 | $ | (266,081 | ) | ||||||||
| Capital expenditures |
(89,435 | ) | (76,548 | ) | (64,053 | ) | (264,224 | ) | (239,228 | ) | ||||||||||
|
|
|
|
|
|
|
|
|
|
|
|||||||||||
| Free cash flow (cash flow from operations plus capital expenditures) |
$ | 40,328 | $ | 25,795 | $ | (101,542 | ) | $ | (6,230 | ) | $ | (505,309 | ) | |||||||
|
|
|
|
|
|
|
|
|
|
|
|||||||||||
| Depreciation and amortization |
$ | 37,585 | $ | 28,449 | $ | 12,793 | $ | 106,083 | $ | 28,825 | ||||||||||
|
Dec 31, 2013 |
Sep 30, 2013 |
Dec 31, 2012 |
||||||||||||||||||
| Cash and Investments |
||||||||||||||||||||
| Cash and cash equivalents |
$ | 845,889 | $ | 795,116 | $ | 201,890 | ||||||||||||||
| Restricted cash - current |
3,012 | 1,265 | 19,094 | |||||||||||||||||
| Restricted cash - noncurrent |
6,435 | 8,110 | 5,159 | |||||||||||||||||
Tesla Motors, Inc.
Reconciliation of GAAP to Non-GAAP Financial Information
(Unaudited)
(In thousands, except per share data)
| Three Months Ended | Year Ended | |||||||||||||||||||
|
Dec 31, 2013 |
Sep 30, 2013 |
Dec 31, 2012 |
Dec 31, 2013 |
Dec 31, 2012 |
||||||||||||||||
| Net loss (GAAP) |
$ | (16,264 | ) | $ | (38,496 | ) | $ | (89,932 | ) | $ | (74,014 | ) | $ | (396,213 | ) | |||||
| Stock-based compensation expense |
28,089 | 21,439 | 14,416 | 83,655 | 50,145 | |||||||||||||||
| Change in fair value of warrant liability |
| | 958 | (10,692 | ) | 1,854 | ||||||||||||||
| Non-cash interest expense related to convertible notes |
4,299 | 4,260 | | 10,350 | | |||||||||||||||
| Early extinguishment of DoE loans |
| | | 16,386 | | |||||||||||||||
|
|
|
|
|
|
|
|
|
|
|
|||||||||||
| Net income (loss) (Non-GAAP) including lease accounting |
16,124 | (12,797 | ) | (74,558 | ) | 25,685 | (344,214 | ) | ||||||||||||
|
|
|
|
|
|
|
|
|
|
|
|||||||||||
| Model S gross profit deferred due to lease accounting (1) |
29,796 | 28,732 | | 77,878 | | |||||||||||||||
|
|
|
|
|
|
|
|
|
|
|
|||||||||||
| Net income (loss) (Non-GAAP) |
$ | 45,920 | $ | 15,935 | $ | (74,558 | ) | $ | 103,563 | $ | (344,214 | ) | ||||||||
|
|
|
|
|
|
|
|
|
|
|
|||||||||||
| Net loss per share, basic (GAAP) |
$ | (0.13 | ) | $ | (0.32 | ) | $ | (0.79 | ) | $ | (0.62 | ) | $ | (3.69 | ) | |||||
| Stock-based compensation expense |
0.23 | 0.18 | 0.13 | 0.70 | 0.47 | |||||||||||||||
| Change in fair value of warrant liability |
| | 0.01 | (0.09 | ) | 0.02 | ||||||||||||||
| Non-cash interest expense related to convertible notes |
0.03 | 0.03 | | 0.09 | | |||||||||||||||
| Early extinguishment of DoE loans |
| | | 0.14 | | |||||||||||||||
| Model S gross profit deferred due to lease accounting (1) |
0.24 | 0.24 | | 0.65 | | |||||||||||||||
|
|
|
|
|
|
|
|
|
|
|
|||||||||||
| Net income (loss) per share, basic (Non-GAAP) |
$ | 0.37 | $ | 0.13 | $ | (0.65 | ) | $ | 0.87 | $ | (3.20 | ) | ||||||||
|
|
|
|
|
|
|
|
|
|
|
|||||||||||
| Shares used in per share calculation, basic (GAAP and Non-GAAP) |
122,802 | 121,862 | 113,763 | 119,421 | 107,349 | |||||||||||||||
|
|
|
|
|
|
|
|
|
|
|
|||||||||||
| Net loss per share, diluted (GAAP) |
$ | (0.12 | ) | $ | (0.28 | ) | $ | (0.79 | ) | $ | (0.55 | ) | $ | (3.69 | ) | |||||
| Stock-based compensation expense |
0.20 | 0.16 | 0.13 | 0.63 | 0.47 | |||||||||||||||
| Change in fair value of warrant liability |
| | 0.01 | (0.08 | ) | 0.02 | ||||||||||||||
| Non-cash interest expense related to convertible notes |
0.03 | 0.03 | | 0.08 | | |||||||||||||||
| Early extinguishment of DoE loans |
| | | 0.12 | | |||||||||||||||
|
|
|
|
|
|
|
|
|
|
|
|||||||||||
| Net income (loss) (Non-GAAP) including lease accounting |
0.11 | (0.09 | ) | (0.65 | ) | 0.20 | (3.20 | ) | ||||||||||||
|
|
|
|
|
|
|
|
|
|
|
|||||||||||
| Model S gross profit deferred due to lease accounting (1) |
0.22 | 0.21 | | 0.58 | | |||||||||||||||
|
|
|
|
|
|
|
|
|
|
|
|||||||||||
| Net income (loss) per share, diluted (Non-GAAP) |
$ | 0.33 | $ | 0.12 | $ | (0.65 | ) | $ | 0.78 | $ | (3.20 | ) | ||||||||
|
|
|
|
|
|
|
|
|
|
|
|||||||||||
| Shares used in per share calculation, diluted (Non-GAAP) |
137,784 | 137,131 | 113,763 | 133,546 | 107,349 | |||||||||||||||
|
|
|
|
|
|
|
|
|
|
|
|||||||||||
| (1) | Under GAAP, warranty costs are expensed as incurred for Model S vehicle deliveries with lease accounting. For Non-GAAP purposes, an estimated incremental warranty reserve of $3.2 million, $5.0 million and $12.2 million is included for the three months ended December 31 and September 30, 2013 and the year ended December 31, 2013, respectively. Additionally, stock-based compensation of $1.1 million, $1.3 million and $2.9 million is excluded for non-GAAP purposes for the three months ended December 31 and September 30, 2013 and the year ended December 31, 2013, respectively. |
Tesla Motors, Inc.
Reconciliation of GAAP to Non-GAAP Financial Information
(Unaudited)
(In thousands, except per share data)
| Three Months Ended | Year Ended | |||||||||||||||||||
|
Dec 31, 2013 |
Sep 30, 2013 |
Dec 31, 2012 |
Dec 31, 2013 |
Dec 31, 2012 |
||||||||||||||||
| Revenues (GAAP) |
$ | 615,219 | $ | 431,346 | $ | 306,332 | $ | 2,013,496 | $ | 413,256 | ||||||||||
| Model S revenue deferred due to lease accounting |
146,125 | 171,229 | | 464,166 | | |||||||||||||||
|
|
|
|
|
|
|
|
|
|
|
|||||||||||
| Revenues (Non-GAAP) |
$ | 761,344 | $ | 602,575 | $ | 306,332 | $ | 2,477,662 | $ | 413,256 | ||||||||||
|
|
|
|
|
|
|
|
|
|
|
|||||||||||
| Gross profit (GAAP) |
$ | 156,590 | $ | 102,868 | $ | 23,857 | $ | 456,262 | $ | 30,067 | ||||||||||
| Model S gross profit deferred due to lease accounting (1) |
29,796 | 28,732 | | 77,878 | | |||||||||||||||
| Stock-based compensation expense |
3,455 | 3,017 | 1,638 | 9,071 | 2,194 | |||||||||||||||
|
|
|
|
|
|
|
|
|
|
|
|||||||||||
| Gross profit (Non-GAAP) |
$ | 189,841 | $ | 134,617 | $ | 25,495 | $ | 543,211 | $ | 32,261 | ||||||||||
|
|
|
|
|
|
|
|
|
|
|
|||||||||||
| Research and development expenses (GAAP) |
$ | 68,454 | $ | 56,351 | $ | 68,832 | $ | 231,976 | $ | 273,978 | ||||||||||
| Stock-based compensation expense |
(10,578 | ) | (8,707 | ) | (7,159 | ) | (35,494 | ) | (26,580 | ) | ||||||||||
|
|
|
|
|
|
|
|
|
|
|
|||||||||||
| Research and development expenses (Non-GAAP) |
$ | 57,876 | $ | 47,644 | $ | 61,673 | $ | 196,482 | $ | 247,398 | ||||||||||
|
|
|
|
|
|
|
|
|
|
|
|||||||||||
| Selling, general and administrative expenses (GAAP) |
$ | 101,489 | $ | 77,071 | $ | 45,908 | $ | 285,569 | $ | 150,372 | ||||||||||
| Stock-based compensation expense |
(14,056 | ) | (9,715 | ) | (5,619 | ) | (39,090 | ) | (21,371 | ) | ||||||||||
|
|
|
|
|
|
|
|
|
|
|
|||||||||||
| Selling, general and administrative expenses (Non-GAAP) |
$ | 87,433 | $ | 67,356 | $ | 40,289 | $ | 246,479 | $ | 129,001 | ||||||||||
|
|
|
|
|
|
|
|
|
|
|
|||||||||||
| (1) | Under GAAP, warranty costs are expensed as incurred for Model S vehicle deliveries with lease accounting. For Non-GAAP purposes, an estimated incremental warranty reserve of $3.2 million, $5.0 million and $12.2 million is included for the three months ended December 31 and September 30, 2013 and the year ended December 31, 2013, respectively. Additionally, stock-based compensation of $1.1 million, $1.3 million and $2.9 million is excluded for non-GAAP purposes for the three months ended December 31 and September 30, 2013 and the year ended December 31, 2013, respectively. |