Tesla Motors Inc 8-K 2014-11-05
Sign in or join
Add a note by highlighting text or Replying to an existing note.
Add a note by highlighting text or Replying to an existing note.
Exhibit 99.1

|
Tesla Motors Third Quarter 2014 Shareholder Letter
Highest ever quarterly deliveries at 7,785 vehicles, despite factory shutdown in July Highest ever peak deliveries in a single day of 907 vehicles Majority of Q3 deliveries in North America; 65% increase in NA Sept 14/Sept 13 Dual Motor and Autopilot introductions further accelerate Model S demand Model S orders and deliveries alone expected to increase by 50% in 2015 Reducing number of Model S options to ramp production faster
|
November 5, 2014
Dear Fellow Shareholders:
Over the past quarter, despite losing almost a month of production due to factory retooling, we delivered the highest number of Model S vehicles ever, with several new records set in North America and worldwide. We also substantially broadened the appeal of the Model S by introducing Dual Motor all-wheel drive and Autopilot. Based on net orders since that introduction, excluding the extraordinary initial demand peak, we are confident of a 50% increase in both net orders and deliveries for Model S alone in 2015.
Our focus will be on scaling up Model S production over the coming year, so no major platform changes to the hardware are planned in the near term. There will, however, be several significant over-the-air software releases at no cost to owners that provide added functionality to the Model S fleet.
Product and Market Initiatives
The Model S is the worlds first production car with Dual Motor electric drive. By having two electric drive units, torque can be adjusted at the millisecond level digitally and independently to the front and rear wheels, thus providing unparalleled performance and traction control. This is a fundamental improvement in traction control relative to a gasoline car, which has inherently high powertrain latency and a mechanical shaft connecting the front and rear wheels that is incapable of reacting intelligently to all road conditions. The dual Model S drive units are also able to act independently, providing powertrain redundancy if one fails.
The performance version of the Dual Motor Model S is now the worlds fastest accelerating four-door production car of all time, with a 0 to 60 mph time of 3.2 seconds, matching the legendary McLaren F1, which has two doors. Model S seats up to seven people, plus luggage. Independent testing by Motor Trend achieved an even better 0 to 60 mph time of 3.1 seconds.
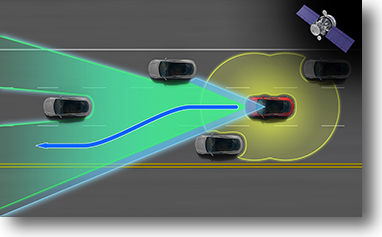
We also recently introduced new standard safety features and components of our Autopilot system. Every Model S coming out of the factory (single and Dual Motor) now has the hardware installed for these features. Lane departure warning and speed limit alert, which you can turn off, are now standard safety features included on every new Model S. Automatic cruise control, highway steering and emergency braking will be enabled in the coming months via a remote software update.
| We also continue to improve Model S in response to customer feedback. Recent enhancements include significantly more comfortable seats, larger sun visors with better mirrors and less strident warning labels, wider-opening rear doors, a self-closing charge port door, location based air suspension adjustments and generally improved fit and finish. In Q3, we pushed Software version 6.0 to the entire Model S fleet, enabling a host of enhancements and new features, including real time traffic based navigation and a new calendar application that allows the car to adapt to the owner.
In partnership with several financial institutions globally, we are also making Model S more affordable, by introducing very compelling consumer leasing in most of the United States and expanding our popular Resale Value Guarantee (RVG) program into several European countries. This enables us to offer lower monthly payments without negatively affecting gross margin. |
Sensor Map of Safety Features & Autopilot System |
|
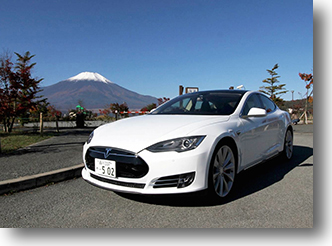
| Around the world, the appeal of Model S continues to spread. Today we announced that Model S has achieved a Euro NCAP (New Car Assessment Program) 5-star safety rating, validating our continuing commitment to vehicle safety. We recently introduced Model S to Hong Kong and Japan and plan to start deliveries in Australia by year end. Our recently opened Shenzhen location in China is already one of our highest grossing stores worldwide. We also recently energized our 124th Supercharger in the United States and our 82nd Supercharger in Europe. In China we have installed 23 Supercharging locations in 10 cities and several destination-charging stations at prominent hotels, malls and commercial buildings. Our customers have driven 49 million miles for free using our global network of Supercharger stations. |
|
|
| First Model S Deliveries to Japan |
Increasing Capacity To Meet Demand
To accommodate accelerating Model S demand and prepare for the rapidly growing order book of Model X reservations, we are investing to increase production to more than 2,000 vehicles per week by the end of 2015. We began this process with a production shutdown this summer to transition to our new, higher volume final assembly line and expand our Model S body center. The ramp to our target production rate took longer than expected due to system integration challenges, reducing our production by almost 2,000 vehicles. Being unable to increase production fast enough, not lack of demand, is a fair criticism of Tesla. That said, we expect our annual production will increase by over 50% in 2014, again in 2015 and probably for several years to follow. This is unusual in the car industry.
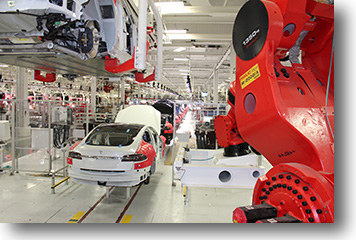
In contrast to Q3, actions to further increase capacity have been designed to be less disruptive, thus enabling us to increase output at a steadier and more predictable pace. For example, our Model X body center will initially be independent from our Model S body center, allowing us to start building Model X bodies without impacting Model S production. We have started to upgrade our second paint shop with state of the art paint application technology and a level of automation that will also have the capacity to cover Model 3 needs.
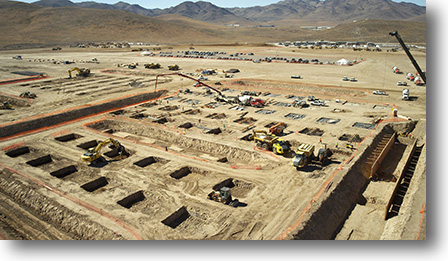
Future capacity investments extend to the Gigafactory where we have already started to pour concrete for the foundation. A modular build strategy is enabling us to scale construction, capital requirements and capacity commensurate with growing demand. Together with Panasonic we are making good progress toward first cell production in 2016 slightly earlier than originally scheduled. Starting operations earlier will reduce ramp-up risks for Model 3 and provide some potential expansion capacity for Model S and Model X.
Q3 Results
As usual, this letter includes non-GAAP financial information because we plan and manage our business using such information. Our non-GAAP financial information excludes non-cash stock-based compensation and interest expense, and includes deferred revenue and related costs for cars sold with a Resale Value Guarantee or similar buy-back program where we receive cash upon delivery.
This quarter we delivered 7,785 Model S vehicles. Non-GAAP revenue was $932 million for the quarter, up 55% from a year ago, while GAAP revenue was $852 million. Compared to Q2, the average selling price of Model S declined slightly due to the stronger dollar. Automotive revenue for Q3 included $31 million of powertrain sales primarily to Daimler for the Mercedes-Benz B Class Electric Drive. It also included $93 million of regulatory credits, including $76 million of Zero Emission Vehicle (ZEV) credits. ZEV credit revenue was much higher than expected as we closed additional contracts with several OEMs.
| We directly leased 347 vehicles in Q3 to customers in the United States. For cars leased by Tesla, we make no GAAP to non-GAAP adjustments because the timing of cash payments received over the lease term is consistent with the timing of GAAP revenue recognition. Supplemental tables below disclose the $34 million of aggregate sales value related to these leased vehicles.
Our Q3 non-GAAP automotive gross margin was 23.0%, and 22.6% on a GAAP basis, both excluding ZEV credits. Our gross margin excluding ZEV credits would have increased slightly from Q2, but a few mostly one-time items negatively impacted our Q3 gross margin. For cars delivered prior to Q3, we booked a reserve of $14 million primarily to reflect our revised assessment of the costs of our 8 year powertrain warranty. We also incurred one-time manufacturing inefficiencies associated with the transition to the new final assembly line, and international revenue was slightly pressured by the strong U.S. dollar. These one-time events impacted gross margin by about 400 bps. |
Gigafactory Construction Nevada |
Research and development (R&D) expenses were $119 million on a non-GAAP basis and $136 million on a GAAP basis. Non-GAAP R&D expenses were up 28% from Q2 due to engineering efforts on Dual Motor drive, Autopilot system and Model X.
Selling, general and administrative (SG&A) expenses were $138 million on a non-GAAP basis and $155 million on a GAAP basis. The 18% sequential increase in non-GAAP SG&A expenses was driven by our rapid global growth and by the expansion of our customer support infrastructure.
Cash at quarter end, including cash equivalents, decreased $304 million to $2.4 billion. Operating cash outflows were $28 million, and impacted by using $35 million to fund our leasing program and a $60 million increase in receivables. During the quarter we invested $284 million in capital expenditures.
Q3 non-GAAP net income was $3 million, or $0.02 per share based on 142.7 million diluted shares, while Q3 GAAP net loss was $75 million or $(0.60) per share, consistent with our guidance even with the additional one-time items.
Outlook
Production for the full year is expected to be about 35,000 cars, despite entering Q4 with a deficit in production of about 2,000 units from Q3. However, the loss of these cars in Q3 means fewer available to deliver in Q4 and our ability to ramp up production in Q4 is constrained by the complexity of launches related to dual motor and autopilot hardware. Consequently, we expect to deliver approximately 33,000 vehicles for 2014. This is 50% above 2013 deliveries, but 5% to 7% below prior estimates for 2014. Previous projections for 2015 are unaffected.
One of the significant actions we intend to take in order to reduce manufacturing complexity is to simplify our product offering by reducing the number of options and powertrain combinations. This will enhance our ability to scale production in 2015.
We expect to lease about 3,000 to 3,500 cars in North America during Q4. A large portion of these leases will be financed through our new bank partner leasing program. Similar to the accounting for our RVG program vehicles, for GAAP purposes, revenue on vehicles leased via our banking partners will be deferred and recognized over the lease term, but added back to non-GAAP revenue because we receive all of the cash up front on these leases.
|
Model S/Model X Final Assembly Line Fremont |
We expect non-GAAP automotive gross margin to exceed 28% in late Q4, excluding ZEV credits, as manufacturing efficiencies and part costs continue to improve. Factors weighing on the automotive gross margin for the full quarter include delivery of vehicles built in Q3 with lower manufacturing efficiency and slightly lower average selling prices from weaker European currencies. Model S gross margin itself is generally higher than automotive gross margin which is moderately suppressed due to the significantly lower gross margin on powertrain sales. ZEV credit revenue in Q4 is expected to be quite minimal based on our existing arrangements.
Q4 non-GAAP operating expenses are expected to grow sequentially by just under 10% for R&D and SG&A as we wind down Dual Motor development. We expect to earn $0.30 to $0.35 per share in Q4, on a non-GAAP basis. Based on our current stock price, we project between 143 million and 145 million diluted shares outstanding in Q4. |
Work continues on the finalization of Model X with the testing of Alpha prototypes and initial builds of the first Beta prototypes. Model X powertrain development is almost complete with the early introduction of Dual Motor drive on Model S. We recently decided to build in significantly more validation testing time to achieve the best Model X possible. This will also allow for a more rapid production ramp compared to Model S in 2012.
In anticipation of this effort, we now expect Model X deliveries to start in Q3 of 2015, a few months later than previously expected. This also is a legitimate criticism of Tesla we prefer to forgo revenue, rather than bring a product to market that does not delight customers. Doing so negatively affects the short term, but positively affects the long term. There are many other companies that do not follow this philosophy that may be a more attractive home for investor capital. Tesla is not going to change.
We plan to spend about $350 million in capital expenditures in Q4 as we continue to invest in even more production capacity, accelerate the pace of Gigafactory construction, and continue vehicle development and our global expansion.
As in the past, we plan to provide 2015 financial guidance in our Q4 Shareholder Letter. 2015 should be another exciting year for Tesla, with accelerating revenue growth and expanding margins.

|

|
|
| Elon Musk, Chairman & CEO | Deepak Ahuja, Chief Financial Officer | |
Webcast Information
Tesla will provide a live webcast of its third quarter 2014 financial results conference call beginning at 2:30 p.m. PT on November 5, 2014, at ir.teslamotors.com. This webcast will also be available for replay for approximately one year thereafter.
Non-GAAP Financial Information
Consolidated financial information has been presented in accordance with GAAP as well as on a non-GAAP basis. On a non-GAAP basis, financial measures exclude non-cash items such as stock-based compensation, the change in fair value related to Teslas warrant liability, non-cash interest expense related to Teslas convertible senior notes as well as one-time expenses associated with the early repayment of the Department of Energy Loan. Non-GAAP financial measures also exclude the impact of lease accounting on related revenues and cost of revenues associated with Model S deliveries with the resale value guarantee and similar buy-back terms, as this perspective is useful in understanding the underlying cash flow activity and timing of vehicle deliveries. Management believes that it is useful to supplement its GAAP financial statements with this non-GAAP information because management uses such information internally for its operating, budgeting and financial planning purposes. These non-GAAP financial measures also facilitate managements internal comparisons to Teslas historical performance as well as comparisons to the operating results of other companies. Non-GAAP information is not prepared under a comprehensive set of accounting rules and therefore, should only be read in conjunction with financial information reported under U.S. GAAP when understanding Teslas operating performance. A reconciliation between GAAP and non-GAAP financial information is provided below.
Forward-Looking Statements
Certain statements in this shareholder letter, including statements in the Outlook section; statements regarding gross margin expansion, and profitability, statements relating to the progress Tesla is making with respect to product development, including future Autopilot features, vehicle firmware updates and Model X development and launch plans; the timing, pace of production and international delivery expansion for Model S, including the production volume, rate, and ramp expectation of our new production lines; growth in demand and orders for Model S and Model X; the ability to achieve vehicle demand, volume, production, delivery, revenue, leasing, gross margin, spending, and profitability targets; and Tesla Gigafactory timing, , partnerships, plans and output expectations, including those related to cell production , are forward-looking statements that are subject to risks and uncertainties. These forward-looking statements are based on managements current expectations, and as a result of certain risks and uncertainties, actual results may differ materially from those projected. The following important factors, without limitation, could cause actual results to differ materially from those in the forward-looking statements: Teslas future success depends on its ability to design and achieve market acceptance of Model S and its variants, as well as new vehicle models, specifically Model X and Model 3; the risk of delays in the manufacture, production and delivery of Model S vehicles, including Dual Motor Model S, or the development, production and delivery of Model X and Model 3 vehicles; the ability of suppliers to meet quality and part delivery expectations at increasing volumes; any failures by Tesla vehicles to perform as expected or if product recalls occur; Teslas ability to continue to reduce or control manufacturing and other costs; consumers willingness to adopt electric vehicles; competition in the automotive market generally and the alternative fuel vehicle market in particular; Teslas ability to establish, maintain and strengthen the Tesla brand; Teslas ability to manage future growth effectively as we rapidly grow, especially internationally; the unavailability, reduction or elimination of government and economic incentives for electric vehicles; Teslas ability to establish, maintain and strengthen its relationships with strategic partners such as Panasonic; potential difficulties in finalizing, performing and realizing potential benefits under definitive agreements for the first Tesla Gigafactory site, obtaining permits and incentives, negotiating terms with technology, materials and other partners for Gigafactory, and maintaining Gigafactory implementation schedules, output and costs estimates; and Teslas ability to execute on its retail strategy and for new store, service center and Tesla Supercharger openings. More information on potential factors that could affect our financial results is included from time to time in our Securities and Exchange Commission filings and reports, including the risks identified under the section captioned Risk Factors in our quarterly report on Form 10-Q filed with the SEC on August 8, 2014. Tesla disclaims any obligation to update information contained in these forward-looking statements whether as a result of new information, future events, or otherwise.
| Investor Relations Contact: | Press Contact: | |||
| Jeff Evanson | Liz Jarvis-Shean | |||
| Investor Relations Tesla | Communications Tesla | |||
| ir@teslamotors.com | press@teslamotors.com |
Tesla Motors, Inc.
Condensed Consolidated Statements of Operations
(Unaudited)
(In thousands, except per share data)
| Three Months Ended | Nine Months Ended | |||||||||||||||||||
|
Sep 30, 2014 |
June 30, 2014 |
Sep 30, 2013 |
Sep 30, 2014 |
Sep 30, 2013 |
||||||||||||||||
| Revenues |
||||||||||||||||||||
| Automotive sales (1A) |
$ | 849,009 | $ | 768,242 | $ | 430,196 | $ | 2,236,062 | $ | 1,386,934 | ||||||||||
| Development services |
2,795 | 1,107 | 1,150 | 5,633 | 11,343 | |||||||||||||||
|
|
|
|
|
|
|
|
|
|
|
|||||||||||
| Total revenues |
851,804 | 769,349 | 431,346 | 2,241,695 | 1,398,277 | |||||||||||||||
|
|
|
|
|
|
|
|
|
|
|
|||||||||||
| Cost of revenues |
||||||||||||||||||||
| Automotive sales (1B) |
598,472 | 554,104 | 324,883 | 1,615,047 | 1,090,300 | |||||||||||||||
| Development services |
1,481 | 2,250 | 3,595 | 6,674 | 8,304 | |||||||||||||||
|
|
|
|
|
|
|
|
|
|
|
|||||||||||
| Total cost of revenues (2) |
599,953 | 556,354 | 328,478 | 1,621,721 | 1,098,604 | |||||||||||||||
|
|
|
|
|
|
|
|
|
|
|
|||||||||||
| Gross profit |
251,851 | 212,995 | 102,868 | 619,974 | 299,673 | |||||||||||||||
| Operating expenses |
||||||||||||||||||||
| Research and development (2) |
135,873 | 107,717 | 56,351 | 325,135 | 163,523 | |||||||||||||||
| Selling, general and administrative (2) |
155,107 | 134,031 | 77,071 | 406,690 | 184,080 | |||||||||||||||
|
|
|
|
|
|
|
|
|
|
|
|||||||||||
| Total operating expenses |
290,980 | 241,748 | 133,422 | 731,825 | 347,603 | |||||||||||||||
|
|
|
|
|
|
|
|
|
|
|
|||||||||||
| Loss from operations |
(39,129 | ) | (28,753 | ) | (30,554 | ) | (111,851 | ) | (47,930 | ) | ||||||||||
| Interest income |
300 | 467 | 68 | 907 | 97 | |||||||||||||||
| Interest expense |
(29,062 | ) | (31,238 | ) | (6,492 | ) | (72,183 | ) | (26,705 | ) | ||||||||||
| Other income (expense), net (3) |
(3,090 | ) | (1,228 | ) | (740 | ) | 2,401 | 18,018 | ||||||||||||
|
|
|
|
|
|
|
|
|
|
|
|||||||||||
| Loss before income taxes |
(70,981 | ) | (60,752 | ) | (37,718 | ) | (180,726 | ) | (56,520 | ) | ||||||||||
| Provision for income taxes |
3,727 | 1,150 | 778 | 5,685 | 1,230 | |||||||||||||||
|
|
|
|
|
|
|
|
|
|
|
|||||||||||
| Net loss |
$ | (74,708 | ) | $ | (61,902 | ) | $ | (38,496 | ) | $ | (186,411 | ) | $ | (57,750 | ) | |||||
|
|
|
|
|
|
|
|
|
|
|
|||||||||||
| Net loss per common share, basic and diluted |
$ | (0.60 | ) | $ | (0.50 | ) | $ | (0.32 | ) | $ | (1.50 | ) | $ | (0.49 | ) | |||||
|
|
|
|
|
|
|
|
|
|
|
|||||||||||
| Shares used in per share calculation, basic and diluted |
124,911 | 124,250 | 121,862 | 124,217 | 118,282 | |||||||||||||||
|
|
|
|
|
|
|
|
|
|
|
|||||||||||
Notes:
| (1) | Due to the application of lease accounting for Model S vehicles with the resale value guarantee or similar buy-back terms, the following is supplemental information for the periods presented: |
| (A) Net increase in deferred revenue and other long-term liabilities as a result of lease accounting and therefore not recognized in automotive sales |
$ | 80,544 | $ | 88,162 | $ | 171,229 | $ | 261,212 | $ | 318,041 | ||||||||||
|
|
|
|
|
|
|
|
|
|
|
|||||||||||
| (B) Net increase in operating lease vehicles as a result of lease accounting and therefore not recognized in automotive cost of sales |
$ | 63,981 | $ | 68,752 | $ | 138,839 | $ | 202,476 | $ | 262,758 | ||||||||||
|
|
|
|
|
|
|
|
|
|
|
|||||||||||
| Under lease accounting, warranty costs are expensed as incurred instead of accrued at the time of sale. |
| (2) | Includes stock-based compensation expense of the following for the periods presented: |
| Cost of revenues |
$ | 5,383 | $ | 3,912 | $ | 3,017 | $ | 12,401 | $ | 5,616 | ||||||||||
| Research and development |
16,639 | 14,822 | 8,707 | 45,006 | 24,916 | |||||||||||||||
| Selling, general and administrative |
17,136 | 17,049 | 9,715 | 54,572 | 25,034 | |||||||||||||||
|
|
|
|
|
|
|
|
|
|
|
|||||||||||
| Total stock-based compensation expense |
$ | 39,158 | $ | 35,783 | $ | 21,439 | $ | 111,979 | $ | 55,566 | ||||||||||
|
|
|
|
|
|
|
|
|
|
|
| (3) | Other income, net, for the nine months ended September 30, 2013 includes the gain from the elimination of the $10.7 million Department of Energy (DoE) common stock warrant liability. |
Tesla Motors, Inc.
Condensed Consolidated Balance Sheets
(Unaudited)
(In thousands)
|
Sep 30, 2014 |
Dec 31, 2013 |
|||||||
| Assets |
||||||||
| Cash and cash equivalents |
$ | 2,370,735 | $ | 845,889 | ||||
| Restricted cash and marketable securities - current |
17,331 | 3,012 | ||||||
| Accounts receivable |
156,889 | 49,109 | ||||||
| Inventory |
752,492 | 340,355 | ||||||
| Prepaid expenses and other current assets |
65,467 | 27,574 | ||||||
| Operating lease vehicles, net (1) |
617,743 | 382,425 | ||||||
| Property and equipment, net |
1,404,326 | 738,494 | ||||||
| Restricted cash - noncurrent |
9,090 | 6,435 | ||||||
| Other assets |
43,460 | 23,637 | ||||||
|
|
|
|
|
|||||
| Total assets |
$ | 5,437,533 | $ | 2,416,930 | ||||
|
|
|
|
|
|||||
| Liabilities and Stockholders Equity |
||||||||
| Accounts payable and accrued liabilities |
$ | 843,933 | $ | 412,221 | ||||
| Deferred revenue (2) |
415,891 | 273,062 | ||||||
| Customer deposits |
227,056 | 163,153 | ||||||
| Capital lease obligations |
22,398 | 20,577 | ||||||
| Long-term debt |
2,384,261 | 586,301 | ||||||
| Other long-term liabilities (3) |
523,739 | 294,495 | ||||||
|
|
|
|
|
|||||
| Total liabilities |
4,417,278 | 1,749,809 | ||||||
| Mezzanine equity (4) |
62,161 | | ||||||
| Stockholders equity |
958,094 | 667,121 | ||||||
|
|
|
|
|
|||||
| Total liabilities and stockholders equity |
$ | 5,437,533 | $ | 2,416,930 | ||||
|
|
|
|
|
|||||
| Notes: |
||||||||
| (1) Includes the following increase in operating lease vehicles related to deliveries of Model S and subject to lease accounting, net of depreciation recognized in automotive cost of sales, for the following periods: |
||||||||
| Resale value guarantee program (and other vehicles with similar buy-back terms) |
||||||||
| Beginning balance |
$ | 376,979 | $ | | ||||
| First quarter |
69,743 | | ||||||
| Second quarter |
68,752 | 123,919 | ||||||
| Third quarter |
63,981 | 138,839 | ||||||
| Fourth quarter |
114,221 | |||||||
|
|
|
|
|
|||||
| Ending balance |
$ | 579,455 | $ | 376,979 | ||||
|
|
|
|
|
|||||
| Model S leasing program |
||||||||
| Beginning balance |
$ | | ||||||
| First quarter |
| |||||||
| Second quarter |
11,214 | |||||||
| Third quarter |
23,824 | |||||||
| Fourth quarter |
||||||||
|
|
|
|||||||
| Ending balance |
$ | 35,038 | ||||||
|
|
|
|||||||
| (2) Includes the following increase in deferred revenue related to deliveries of Model S with the resale value guarantee or similar buy-back terms and subject to lease accounting, net of revenue amortized to automotive sales, for the following periods: |
||||||||
| Beginning balance |
$ | 227,868 | $ | | ||||
| First quarter |
38,188 | | ||||||
| Second quarter |
33,586 | 74,455 | ||||||
| Third quarter |
27,993 | 84,577 | ||||||
| Fourth quarter |
68,836 | |||||||
|
|
|
|
|
|||||
| Ending balance |
$ | 327,635 | $ | 227,868 | ||||
|
|
|
|
|
|||||
| (3) Includes the following increase in other long-term liabilities related to deliveries of Model S with the resale value guarantee or similar buy-back terms and subject to lease accounting for the following periods: |
||||||||
| Beginning balance |
$ | 236,298 | $ | | ||||
| First quarter |
54,318 | | ||||||
| Second quarter |
54,575 | 72,357 | ||||||
| Third quarter |
52,551 | 86,652 | ||||||
| Fourth quarter |
77,289 | |||||||
|
|
|
|
|
|||||
| Ending balance |
$ | 397,742 | $ | 236,298 | ||||
|
|
|
|
|
|||||
| (4) | Our common stock price exceeded the conversion threshold price of our convertible senior notes due 2018 (2018 Notes) issued in May 2013; therefore, the 2018 Notes are convertible at the holders option during the fourth quarter of 2014. As such, the carrying value of the 2018 Notes was classified as a current liability as of September 30, 2014 and the difference between the principal amount and the carrying value of the 2018 Notes was reflected as convertible debt in mezzanine equity on our condensed consolidated balance sheet as of September 30, 2014. |
Tesla Motors, Inc.
Supplemental Consolidated Financial Information
(Unaudited)
(In thousands)
| Three Months Ended | Nine Months Ended | |||||||||||||||||||
|
Sep 30, 2014 |
June 30, 2014 |
Sep 30, 2013 |
Sep 30, 2014 |
Sep 30, 2013 |
||||||||||||||||
| Selected Cash Flow Information |
||||||||||||||||||||
| Cash flows provided by (used in) operating activities (1) |
$ | (27,996 | ) | $ | (1,662 | ) | $ | 102,033 | $ | 29,065 | $ | 130,817 | ||||||||
| Cash flows provided by (used in) investing activities |
(291,643 | ) | 2,610 | (77,501 | ) | (618,213 | ) | (159,912 | ) | |||||||||||
| Cash flows provided by financing activities |
33,755 | 281,491 | 24,216 | 2,131,805 | 624,906 | |||||||||||||||
| Other Selected Financial Information |
||||||||||||||||||||
| Cash flows provided by (used in) operating activities (1) |
$ | (27,996 | ) | $ | (1,662 | ) | $ | 102,033 | $ | 29,065 | $ | 130,817 | ||||||||
| Capital expenditures |
(284,175 | ) | (175,685 | ) | (76,548 | ) | (601,224 | ) | (174,790 | ) | ||||||||||
|
|
|
|
|
|
|
|
|
|
|
|||||||||||
| Free cash flow (cash flow from operations plus capital expenditures) (1) |
$ | (312,171 | ) | $ | (177,347 | ) | $ | 25,485 | $ | (572,159 | ) | $ | (43,973 | ) | ||||||
|
|
|
|
|
|
|
|
|
|
|
|||||||||||
| Depreciation and amortization |
$ | 64,972 | $ | 54,715 | $ | 28,449 | $ | 163,955 | $ | 68,498 | ||||||||||
|
Sep 30, 2014 |
June 30, 2014 |
Sep 30, 2013 |
||||||||||||||||||
| Cash and Investments |
||||||||||||||||||||
| Cash and cash equivalents |
$ | 2,370,735 | $ | 2,674,910 | $ | 795,116 | ||||||||||||||
| Restricted cash and marketable securities - current |
17,331 | 11,714 | 1,265 | |||||||||||||||||
| Restricted cash - noncurrent |
9,090 | 7,247 | 8,110 | |||||||||||||||||
| (1) During the three months ended June 30, 2014, we began separately presenting the effect of exchange rate changes on our cash and cash equivalents in our condensed consolidated statement of cash flows due to our growing operations in foreign currency environments. Prior period amounts have been reclassified to conform to the current period presentation. |
|
|||||||||||||||||||
| Supplemental Model S Leasing Program Information (in thousands, except for vehicle deliveries) |
|
|||||||||||||||||||
| Three Months Ended | Nine Months Ended |
|||||||||||||||||||
|
Sep 30, 2014 |
June 30, 2014 |
Sep 30, 2014 |
||||||||||||||||||
| Vehicles delivered |
347 | 158 | 505 | |||||||||||||||||
| Average per unit price of vehicles delivered |
$ | 99 | $ | 102 | $ | 100 | ||||||||||||||
|
|
|
|
|
|
|
|||||||||||||||
| Aggregate value of vehicles delivered (1) |
$ | 34,490 | $ | 16,046 | $ | 50,536 | ||||||||||||||
|
|
|
|
|
|
|
|||||||||||||||
| Leasing revenue recognized for current period deliveries |
$ | 1,117 | $ | 170 | $ | 1,287 | ||||||||||||||
| (1) | Aggregate value is the product of multiplying vehicles delivered by the average per unit price of vehicles delivered |
Tesla Motors, Inc.
Reconciliation of GAAP to Non-GAAP Financial Information
(Unaudited)
(In thousands, except per share data)
| Three Months Ended | Nine Months Ended | |||||||||||||||||||
|
Sep 30, 2014 |
June 30, 2014 |
Sep 30, 2013 |
Sep 30, 2014 |
Sep 30, 2013 |
||||||||||||||||
| Net loss (GAAP) |
$ | (74,708 | ) | $ | (61,902 | ) | $ | (38,496 | ) | $ | (186,411 | ) | $ | (57,750 | ) | |||||
| Stock-based compensation expense |
39,158 | 35,783 | 21,439 | 111,979 | 55,566 | |||||||||||||||
| Change in fair value of warrant liability |
| | | | (10,692 | ) | ||||||||||||||
| Non-cash interest expense related to convertible notes |
22,160 | 23,639 | 4,260 | 54,192 | 6,051 | |||||||||||||||
| Early extinguishment of DoE loans |
| | | | 16,386 | |||||||||||||||
|
|
|
|
|
|
|
|
|
|
|
|||||||||||
| Net income (loss) (Non-GAAP) including lease accounting |
(13,390 | ) | (2,480 | ) | (12,797 | ) | (20,240 | ) | 9,561 | |||||||||||
|
|
|
|
|
|
|
|
|
|
|
|||||||||||
| Model S gross profit deferred due to lease accounting (1)(2) |
16,564 | 18,607 | 28,732 | 56,555 | 48,082 | |||||||||||||||
|
|
|
|
|
|
|
|
|
|
|
|||||||||||
| Net income (Non-GAAP) |
$ | 3,174 | $ | 16,127 | $ | 15,935 | $ | 36,315 | $ | 57,643 | ||||||||||
|
|
|
|
|
|
|
|
|
|
|
|||||||||||
| Net loss per share, basic (GAAP) |
$ | (0.60 | ) | $ | (0.50 | ) | $ | (0.32 | ) | $ | (1.50 | ) | $ | (0.49 | ) | |||||
| Stock-based compensation expense |
0.31 | 0.29 | 0.18 | 0.90 | 0.47 | |||||||||||||||
| Change in fair value of warrant liability |
| | | | (0.09 | ) | ||||||||||||||
| Non-cash interest expense related to convertible notes |
0.18 | 0.19 | 0.03 | 0.44 | 0.05 | |||||||||||||||
| Early extinguishment of DoE loans |
| | | | 0.14 | |||||||||||||||
| Model S gross profit deferred due to lease accounting (1)(2) |
0.13 | 0.15 | 0.24 | 0.46 | 0.41 | |||||||||||||||
|
|
|
|
|
|
|
|
|
|
|
|||||||||||
| Net income per share, basic (Non-GAAP) |
$ | 0.02 | $ | 0.13 | $ | 0.13 | $ | 0.30 | $ | 0.49 | ||||||||||
|
|
|
|
|
|
|
|
|
|
|
|||||||||||
| Shares used in per share calculation, basic (GAAP and Non-GAAP) |
124,911 | 124,250 | 121,862 | 124,217 | 118,282 | |||||||||||||||
|
|
|
|
|
|
|
|
|
|
|
|||||||||||
| Net loss per share, diluted (GAAP) |
$ | (0.52 | ) | $ | (0.44 | ) | $ | (0.28 | ) | $ | (1.32 | ) | $ | (0.44 | ) | |||||
| Stock-based compensation expense |
0.27 | 0.25 | 0.16 | 0.79 | 0.42 | |||||||||||||||
| Change in fair value of warrant liability |
| | | | (0.08 | ) | ||||||||||||||
| Non-cash interest expense related to convertible notes |
0.15 | 0.17 | 0.03 | 0.39 | 0.05 | |||||||||||||||
| Early extinguishment of DoE loans |
| | | | 0.12 | |||||||||||||||
|
|
|
|
|
|
|
|
|
|
|
|||||||||||
| Net income (loss) (Non-GAAP) including lease accounting |
(0.10 | ) | (0.02 | ) | (0.09 | ) | (0.14 | ) | 0.07 | |||||||||||
|
|
|
|
|
|
|
|
|
|
|
|||||||||||
| Model S gross profit deferred due to lease accounting (1)(2) |
0.12 | 0.13 | 0.21 | 0.40 | 0.36 | |||||||||||||||
|
|
|
|
|
|
|
|
|
|
|
|||||||||||
| Net income per share, diluted (Non-GAAP) |
$ | 0.02 | $ | 0.11 | $ | 0.12 | $ | 0.26 | $ | 0.44 | ||||||||||
|
|
|
|
|
|
|
|
|
|
|
|||||||||||
| Shares used in per share calculation, diluted (Non-GAAP) |
142,747 | 140,948 | 137,131 | 141,406 | 131,878 | |||||||||||||||
|
|
|
|
|
|
|
|
|
|
|
|||||||||||
| (1) | Under GAAP, warranty costs are expensed as incurred for Model S vehicle deliveries with the resale value guarantee or similar buy-back terms and subject to lease accounting. For Non-GAAP purposes, an estimated incremental warranty reserve of $3.6 million, $3.4 million, $5.0 million is included for the three months ended September 30, 2014, June 30, 2014, September 30, 2013, respectively. For the nine months ended September 30, 2014 and 2013, an estimated incremental warranty reserve of $9.1 million and $9.0 million is included, respectively. Additionally, stock-based compensation of $1.0 million, $0.7 million and $1.3 million is excluded for non-GAAP purposes for the three months ended September 30, 2014, June 30, 2014 and September 30, 2013, respectively. For the nine months ended September 30, 2014 and 2013, stock-based compensation of $2.4 million and $1.8 million is excluded, respectively. |
| (2) | Includes deliveries of Model S with the resale value guarantee or similar buy-back terms and not deliveries under the Model S leasing program. |
Tesla Motors, Inc.
Reconciliation of GAAP to Non-GAAP Financial Information
(Unaudited)
(In thousands, except per share data)
| Three Months Ended | Nine Months Ended | |||||||||||||||||||
|
Sep 30, 2014 |
June 30, 2014 |
Sep 30, 2013 |
Sep 30, 2014 |
Sep 30, 2013 |
||||||||||||||||
| Revenues (GAAP) |
$ | 851,804 | $ | 769,349 | $ | 431,346 | $ | 2,241,695 | $ | 1,398,277 | ||||||||||
| Model S revenue deferred due to lease accounting (2) |
80,544 | 88,162 | 171,229 | 261,212 | 318,041 | |||||||||||||||
|
|
|
|
|
|
|
|
|
|
|
|||||||||||
| Revenues (Non-GAAP) |
$ | 932,348 | $ | 857,511 | $ | 602,575 | $ | 2,502,907 | $ | 1,716,318 | ||||||||||
|
|
|
|
|
|
|
|
|
|
|
|||||||||||
| Gross profit (GAAP) |
$ | 251,851 | $ | 212,995 | $ | 102,868 | $ | 619,974 | $ | 299,673 | ||||||||||
| Model S gross profit deferred due to lease accounting (1)(2) |
16,564 | 18,607 | 28,732 | 56,555 | 48,082 | |||||||||||||||
| Stock-based compensation expense |
5,383 | 3,912 | 3,017 | 12,401 | 5,616 | |||||||||||||||
|
|
|
|
|
|
|
|
|
|
|
|||||||||||
| Gross profit (Non-GAAP) |
$ | 273,798 | $ | 235,514 | $ | 134,617 | $ | 688,930 | $ | 353,371 | ||||||||||
|
|
|
|
|
|
|
|
|
|
|
|||||||||||
| Research and development expenses (GAAP) |
$ | 135,873 | $ | 107,717 | $ | 56,351 | $ | 325,135 | $ | 163,523 | ||||||||||
| Stock-based compensation expense |
(16,639 | ) | (14,822 | ) | (8,707 | ) | (45,006 | ) | (24,916 | ) | ||||||||||
|
|
|
|
|
|
|
|
|
|
|
|||||||||||
| Research and development expenses (Non-GAAP) |
$ | 119,234 | $ | 92,895 | $ | 47,644 | $ | 280,129 | $ | 138,607 | ||||||||||
|
|
|
|
|
|
|
|
|
|
|
|||||||||||
| Selling, general and administrative expenses (GAAP) |
$ | 155,107 | $ | 134,031 | $ | 77,071 | $ | 406,690 | $ | 184,080 | ||||||||||
| Stock-based compensation expense |
(17,136 | ) | (17,049 | ) | (9,715 | ) | (54,572 | ) | (25,034 | ) | ||||||||||
|
|
|
|
|
|
|
|
|
|
|
|||||||||||
| Selling, general and administrative expenses (Non-GAAP) |
$ | 137,971 | $ | 116,982 | $ | 67,356 | $ | 352,118 | $ | 159,046 | ||||||||||
|
|
|
|
|
|
|
|
|
|
|
|||||||||||
| (1) | Under GAAP, warranty costs are expensed as incurred for Model S vehicle deliveries with the resale value guarantee or similar buy-back terms and subject to lease accounting. For Non-GAAP purposes, an estimated incremental warranty reserve of $3.6 million, $3.4 million, $5.0 million is included for the three months ended September 30, 2014, June 30, 2014, September 30, 2013, respectively. For the nine months ended September 30, 2014 and 2013, an estimated incremental warranty reserve of $9.1 million and $9.0 million is included, respectively. Additionally, stock-based compensation of $1.0 million, $0.7 million and $1.3 million is excluded for non-GAAP purposes for the three months ended September 30, 2014, June 30, 2014 and September 30, 2013, respectively. For the nine months ended September 30, 2014 and 2013, stock-based compensation of $2.4 million and $1.8 million is excluded, respectively. |
| (2) | Includes deliveries of Model S with the resale value guarantee or similar buy-back terms and not deliveries under the Model S leasing program. |

The electric-car maker is ramping up deliveries at a dizzying pace. During the third quarter, vehicle deliveries for its Model S. Tesla posted a record high of nearly 7,800 or a 41.5% increase year-over-year. That’s impressing considering that the factory was shut down for two whole weeks. On top of that, Tesla hit the single-day-deliveries record. Tesla expects that by the end of 2015, it will be able to ramp up production to 2,000 vehicles a week. These numbers show confidence in the increasing demand trends going forward. To bolster demand, the car maker is not only diversifying its distribution by expanding to Europe and Asia, but also by serving more versions and adding novel features to its cars. The recent halt in production did indeed create a few bumps. Even so, it was part of the company's effort to improve supply and overall production over the medium term.
Tesla is trying to change the automotive world by creating environmental friendly product that as a driver and investor would value it in longer term. However, it is becoming a challenge to rest of the automotive world because producing a car that run on electricity rather than oil would decelerate the growth of gas run vehicles regardless how innovative features they may offer. IF Tesla comes out with a model that is easily affordable by average consumer, it will change the way of transportation. Meanwhile if you can't afford the car, one can take a bite at their stock which is trading at $242.20 and is above 200 SMA.

The Company earns approximately $98k in revenue per leased vehicle in the U.S., as of Q3 14, a number that is impressively larger than that of other OEM's for standard vehicles.

The Company is stating here that Gross Margin would have been approximately 26.6% (GAAP) had it not been for these significant one time items listed here, which equates to a 4% point improvement. (1%=100 Basis Points Bps)

Tesla continues to be a growth story with revenues 97% higher than a year ago. The company has ramped up production and the numbers show. The trend is expected to continue as TSLA intends to ramp up production for faster deliveries by reducing number of Model S options. All eyes will be on future growth trends from international markets in addition to North America, in the coming quarters.

The Company is stating here that $5.4 Million of stock based compensation was included in Cost of Revenues (ie Cost of Goods Sold COGS) for Q3 '14. This is overstating COGS and understating SG&A expenses. COGS is exactly what it says, Cost of Goods Sold, not stock based comp expense. For a manufacturer, COGS are its costs for raw materials, parts and accessories to manufacture the vehicles produced, (ie the cost of all the steel, screws and other stuff that it takes to make a car).