Tesla Motors Inc 8-K 2013-02-20
Sign in or join
Add a note by highlighting text or Replying to an existing note.
Add a note by highlighting text or Replying to an existing note.
Exhibit 99.1

|
Tesla Motors, Inc. Fourth Quarter & Full Year 2012 Shareholder Letter
Achieved 20,000 annualized production rate
Record new Model S reservations
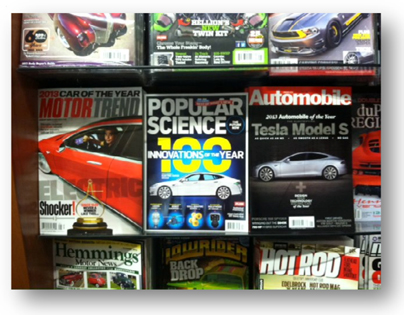
Model S unanimously named Motor Trend Car of the Year®
Q4 revenue increases sequentially by 500 % to $306 million
Rapid growth of Model S sales and service network
First profit now expected Q1 2013 versus prior guidance of late 2013 |
February 20, 2013
Dear Fellow Shareholders:
We started 2012 with a few Model S prototypes in hand and the goal of going from producing hundreds of Roadsters per year to producing hundreds of Model S vehicles per week. During the year, we successfully completed homologation of the car, started initial deliveries on time in June and ramped the production rate to our year-end target of 400 vehicles per week. Along the way, Model S picked up almost every major automobile award, including the first ever unanimous designation as the Motor Trend Car of the Year®. Tesla powered cars have now been driven more than 40 million miles.
| With our production now reliably at an annualized rate of 20,000 units per year and thousands of Model S vehicles on the road, our plan for 2013 is to introduce Model S to customers around the world. Many of our reservation holders and potential customers have yet to experience Model S. That will change this year, with our growing network of stores and galleries, service locations and Supercharger sites, along with first deliveries in Europe and Asia scheduled for later this year.
We will also continue to implement production and delivery efficiencies throughout the year. We have already made significant progress this quarter. As a result, we expect to be slightly profitable (excluding only non-cash option and warrant-related expenses) in Q1 2013. |

|
Achieved 2013 Production Rate Goals
Our most significant achievement in Q4 was the successful ramp of production volume to more than 400 vehicles per week for three consecutive weeks in December, and this has continued at a consistent rate in Q1. This established a production level that will allow us to achieve our goal of 20,000 Model S deliveries in 2013. We produced over 2,750 vehicles during the quarter and more than 3,100 vehicles during the full year, while maintaining our stringent quality standards.
To quadruple the pace of production during the quarter, we dramatically improved our manufacturing processes, and made significant strides in improving initial end-of-line quality. We were also able to overcome many of our past supply chain challenges and methodically stabilized the supplier base.
In the quarter, we also began to scale our delivery strategies. Both personal home delivery and factory pick-up were very popular delivery options for customers. However, we faced some challenges scheduling deliveries near the end of Q4 as our peak production coincided with vacations during the holiday season. As a result, we delivered approximately 2,400 Model S vehicles during the quarter and about 2,650 for the year. We have improved the delivery process in Q1 of 2013, and will continue to make enhancements to the process throughout the year.
Growing Model S Demand
New reservation activity once again hit record levels during the quarter driven by holiday traffic to our stores, multiple Car-of-the-Year awards, the start of European marketing, and visibility of customer cars on the road and related word-of-mouth enthusiasm. As a result, we added more than 6,000 new reservations in Q4, up from almost 2,900 in Q3. During the quarter, we also announced a U.S. price increase for new reservations made after December 31st.
|
We invited a large number of reservation holders to configure their cars during the quarter. Converting these reservations to firm, non-refundable orders increased cancellations, as expected. After deliveries and cancellations, our net reservations at year end, were over 15,000, up from about 13,000 at the end of Q3. New reservations continue at a steady, although slower pace in Q1 2013, as compared to December, due in part to the pull ahead of reservations into Q4 by customers seeking to avoid the price increase. Q1 cancellations are likely to remain elevated as the remaining older reservation holders are invited to configure their vehicles within a set timeframe or pay the higher price just like new reservation holders. |
Targeted Model S Infrastructure Investments
To expand and support our growing customer base, we continue to make targeted investments in stores and galleries, service centers and Superchargers. Because our distribution and service strategies are less expensive to build and operate than the traditional dealer model, we are able to expand this support network in a cost effective manner.
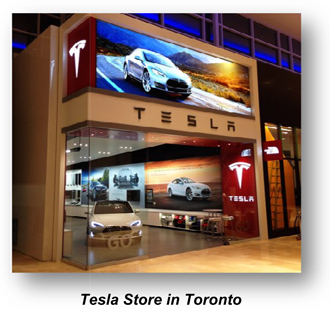
We opened eight stores and galleries during the fourth quarter in Chicago, Illinois; Morristown and Paramus, New Jersey; San Diego and Los Angeles, California; Seattle, Washington; Toronto, Canada; and Miami, Florida. Visitor traffic soared during the holiday season, as we welcomed more than 1.6 million visitors to our nineteen new-design stores and galleries in North America during Q4. This was almost as many people who visited our stores and galleries during the entire first three quarters of 2012.
| At year end, we had 32 stores and galleries around the world. We plan to open 15 to 20 more stores and galleries this year with about half the openings in Europe and Asia to support our expansion into these regions during the second half of 2013. Notably, we have already started construction of our first store in Beijing, China in preparation for its opening this spring. We also opened eight new service locations during the quarter, for a total of 29 locations at the end of Q4. We plan to double this number by the end of 2013 to keep pace with the growing fleet of customer cars. |

|
Following the successful launch of our Supercharger network in California, we opened the first two Superchargers on the east coast in Q4, in Milford, Connecticut and Newark, Delaware. These Superchargers allow for fast and convenient travel between Boston, New York and Washington, D.C. As expected, our customers are enjoying the speed and convenience of charging for free during road trips. Construction planning is underway to install additional Superchargers in 2013. Our plan is to expand coverage on the U.S. West and East Coasts, and around the rest of the country.
Quarterly Results
Total revenues for Q4 were $306 million, a 500% increase over Q3. During the quarter we delivered approximately 2,400 Model S vehicles. We delivered the remaining North American Signature Series cars and shipped exclusively cars with the 85 kWh battery pack. We also saw strong demand for options such as the Performance version and Tech package. Finally, we sold most of our remaining Roadsters during the quarter.
In Q4, we completed various milestones under the Mercedes-Benz B-Class EV program which contributed to total development services revenue of $12 million. We also continued to deliver full electric powertrains at a steady pace to Toyota for the RAV4 EV program.
| From Q3 to Q4, total gross margin rose from (17)% to almost 8%, as a result of a higher Model S production rate, the move to production prices for certain Model S parts, sale of regulatory credits and healthy margin contribution from development services. Still, as expected, we experienced significant early-stage cost inefficiencies in Q4 as a result of several factors. These factors included lower fixed cost absorption, manufacturing inefficiencies during the initial production ramp and higher logistics costs as our supply chain took time to mature. We also had higher component prices as many vendors were not supplying parts at production prices early in the quarter due to their own manufacturing inefficiencies. Elevated costs during the initial ramp phase of a new factory and a new vehicle, as well as subsequent efficiency improvements, are typical in the automotive industry and consistent with our own past experience with the Roadster. |

|
Since we are now producing cars at steady state production, we have shifted our focus to cost reduction. As a result, the cost of producing Model S is beginning to decline. Our operations in 2013 are already more efficient compared to Q4, as we continue to stabilize and improve the production process. In addition, further cost reduction efforts undertaken by both us and our suppliers will continue to reduce costs in Q1 and in upcoming quarters. Consequently, we expect gross margin to continue to improve towards our 25% target by year-end.
Research and development (R&D) expenses were $62 million on a non-GAAP basis and $69 million on a GAAP basis. A significant portion of the R&D costs in Q4 were non-recurring, as we completed engineering, design and testing of our vehicle and components both internally and at our suppliers. As a result, Q1 R&D spending is expected to decline by about 15% from Q4 2012.
Selling, general and administrative (SG&A) expenses were $40 million on a non-GAAP basis and $46 million on a GAAP basis. Much of the increase in selling expenses was again driven by the expansion of our store network and service infrastructure. General and administrative expenses also rose slightly in Q4, driven primarily by higher information technology costs. Q1 SG&A spending will continue to rise moderately primarily due to the growth in our stores and service centers.
Our non-GAAP net loss for the quarter was just under $75 million, or $(0.65) per share, based on 113.8 million weighted common shares outstanding. Our GAAP net loss was $90 million, or $(0.79) per share for the quarter.
We ended the year with more than $221 million in total cash, after having made the first quarterly principal payment of $12.7 million to repay the loan to the U.S. Department of Energy (DoE) on schedule. Our short term restricted cash is primarily for the second DoE loan payment due in March 2013. In Q4 2012, our negative free cash flow (cash from operations plus capital expenditures) was just over $102 million, down by almost 40% from the prior quarter. More importantly, in the month of December we generated positive free cash flow, through growing sales and careful working capital management.
2013 Outlook
We plan to deliver about 20,000 Model S units in 2013. We expect to start the year with about 4,500 deliveries in Q1, as we gave the manufacturing team the first week of the year off to celebrate their accomplishments during 2012.
We plan to start European deliveries of the Model S this summer and Asian deliveries later this year. We have now started delivering Model S with the 60 kWh battery pack. These cars have an EPA-rated range of 208 miles on a single charge. Delivery of cars with the 40 kWh battery pack is expected to begin later this summer.
As we enter 2013, production efficiency is improving substantially as labor inputs decline and initial end-of-line production quality improves. We expect first quarter material, labor and overhead costs to be substantially lower than in the fourth quarter of 2012, and for this trend to continue in 2013.
|
As a result of these actions and the favorable impact of regulatory credits, Q1 gross margin is projected to improve to the mid-teens percentage range. We expect our gross margin to continue to rise into the second half of the year to our target of 25%, despite a much lower contribution from regulatory credits.
Longer term, regulatory credit revenue should decline relative to our automotive sales as we grow our sales outside the United States and earn fewer credits on the smaller battery packs. While we will pursue opportunities to monetize the credits we earn from the sales of our vehicles, we do not need to rely on such sales to be a significant contributor to gross margin, and our business model is not predicated on such credits. |
In the first quarter of 2013, we expect to generate slightly positive net income, on a non-GAAP basis. We also expect to be near breakeven on cash flow from operations. These targets would be achieved through a combination of improved gross margin and lower R&D expenses. The achievement of operational and manufacturing efficiencies will drive some adjustments in our personnel, primarily affecting contractor and temporary employees. At the same time, we are continuing to hire and convert to full time key talent where required.
In 2013, we plan to spend significantly less on capital expenditures than we did in 2012, as we have concluded the majority of our investment in the Tesla Factory and Model S tooling. This reduction will be partially offset by expenditures related to expanding our service and store network, investing in new capital equipment and tooling to reduce variable costs and new product development.
To conclude, 2012 was indeed the Year of Model S. This year, we are on a journey to expand the presence of Model S and turn profitable.
Sincerely,

|

|
|
| Elon Musk, Chairman, Product Architect and CEO | Deepak Ahuja, Chief Financial Officer | |
Webcast Information
Tesla will provide a live webcast of its fourth quarter and year ended 2012 financial results conference call beginning at 2:30 p.m. PT on February 20, 2013, at ir.teslamotors.com. This webcast will also be available for replay for approximately one year thereafter.
Forward-Looking Statements
Certain statements in this shareholder letter, including statements in the 2013 Outlook section of this Shareholder Letter; statements regarding profitability in Q1 2013 and cost reduction efforts; statements relating to the progress Tesla is making with respect to the development, European and Asian launch expectations, schedule for the introduction of future options and variants, quality improvements, delivery and volume expectations of Model S; the ability of our suppliers to supply quality parts at reduced costs; the ability to achieve vehicle volume, revenue, gross margin, spending, profitability and cash flow targets; the expected growth rate in reservations and cancellations, and future store, service center and Tesla Supercharger expected costs, openings and expansion plans are forward-looking statements that are subject to risks and uncertainties. These forward-looking statements are based on managements current expectations, and as a result of certain risks and uncertainties actual results may differ materially from those projected. The following important factors, without limitation, could cause actual results to differ materially from those in the forward-looking statements: Teslas future success depends on its ability to design and achieve market acceptance of Model S and other new vehicle models, specifically Model X; the risk of delays in the manufacture, production and delivery ramp of Model S vehicles; the ability of suppliers to meet quality and part delivery expectations; consumers willingness to adopt electric vehicles and electric cars in particular; competition in the automotive market generally and the alternative fuel vehicle market in particular; Teslas ability to establish, maintain and strengthen the Tesla brand; the unavailability, reduction or elimination of governmental and economic incentives for electric vehicles; Teslas ability to establish, maintain and strengthen its relationships with strategic partners such as Daimler, Toyota and Panasonic; and Teslas ability to execute on its plans for its new interactive retail strategy and for new store, service center and Tesla Supercharger openings. More information on potential factors that could affect the Companys financial results is included from time to time in Teslas Securities and Exchange Commission filings and reports, including the risks identified under the section captioned Risk Factors in our quarterly report on Form 10-Q filed on November 7, 2012. Tesla disclaims any obligation to update information contained in these forward-looking statements whether as a result of new information, future events, or otherwise.
| Investor Relations Contact: | Press Contact: | |||
| Jeff Evanson | Shanna Hendriks | |||
| 650-681-5050 | Tesla Motors | |||
| ir@teslamotors.com | shendriks@teslamotors.com |
For additional information, please visit ir.teslamotors.com.
Tesla Motors, Inc.
Condensed Consolidated Statements of Operations
(Unaudited)
(In thousands, except per share data)
| Three Months Ended | Year Ended | |||||||||||||||||||
| Dec 31, 2012 |
Sept 30, 2012 |
Dec 31, 2011 |
Dec 31, 2012 |
Dec 31, 2011 |
||||||||||||||||
| Revenues |
||||||||||||||||||||
| Automotive sales |
$ | 294,377 | $ | 50,023 | $ | 32,677 | $ | 385,699 | $ | 148,568 | ||||||||||
| Development services |
11,955 | 81 | 6,698 | 27,557 | 55,674 | |||||||||||||||
|
|
|
|
|
|
|
|
|
|
|
|||||||||||
| Total revenues |
306,332 | 50,104 | 39,375 | 413,256 | 204,242 | |||||||||||||||
|
|
|
|
|
|
|
|
|
|
|
|||||||||||
| Cost of revenues |
||||||||||||||||||||
| Automotive sales |
278,710 | 58,865 | 25,241 | 371,658 | 115,482 | |||||||||||||||
| Development services |
3,765 | | 6,299 | 11,531 | 27,165 | |||||||||||||||
|
|
|
|
|
|
|
|
|
|
|
|||||||||||
| Total cost of revenues (1) |
282,475 | 58,865 | 31,540 | 383,189 | 142,647 | |||||||||||||||
|
|
|
|
|
|
|
|
|
|
|
|||||||||||
| Gross profit (loss) |
23,857 | (8,761 | ) | 7,835 | 30,067 | 61,595 | ||||||||||||||
| Operating expenses |
||||||||||||||||||||
| Research and development (1) |
68,832 | 61,901 | 61,206 | 273,978 | 208,981 | |||||||||||||||
| Selling, general and administrative (1) |
45,908 | 37,798 | 27,556 | 150,372 | 104,102 | |||||||||||||||
|
|
|
|
|
|
|
|
|
|
|
|||||||||||
| Total operating expenses |
114,740 | 99,699 | 88,762 | 424,350 | 313,083 | |||||||||||||||
|
|
|
|
|
|
|
|
|
|
|
|||||||||||
| Loss from operations |
(90,883 | ) | (108,460 | ) | (80,927 | ) | (394,283 | ) | (251,488 | ) | ||||||||||
| Interest income |
85 | 38 | 89 | 288 | 255 | |||||||||||||||
| Interest expense |
(27 | ) | (78 | ) | (43 | ) | (254 | ) | (43 | ) | ||||||||||
| Other income (expense), net |
746 | (2,188 | ) | (495 | ) | (1,828 | ) | (2,646 | ) | |||||||||||
|
|
|
|
|
|
|
|
|
|
|
|||||||||||
| Loss before income taxes |
(90,079 | ) | (110,688 | ) | (81,376 | ) | (396,077 | ) | (253,922 | ) | ||||||||||
| Provision for (benefit from) income taxes |
(147 | ) | 116 | 112 | 136 | 489 | ||||||||||||||
|
|
|
|
|
|
|
|
|
|
|
|||||||||||
| Net loss |
$ | (89,932 | ) | $ | (110,804 | ) | $ | (81,488 | ) | $ | (396,213 | ) | $ | (254,411 | ) | |||||
|
|
|
|
|
|
|
|
|
|
|
|||||||||||
| Net loss per common share, basic and diluted (2) |
$ | (0.79 | ) | $ | (1.05 | ) | $ | (0.78 | ) | $ | (3.69 | ) | $ | (2.53 | ) | |||||
|
|
|
|
|
|
|
|
|
|
|
|||||||||||
| Shares used in per share calculation, basic and diluted (2) |
113,763 | 105,556 | 104,392 | 107,349 | 100,389 | |||||||||||||||
|
|
|
|
|
|
|
|
|
|
|
|||||||||||
| Notes: | ||||||||||||||||||||
| (1) Includes stock-based compensation expense of the following for the periods presented: |
|
|||||||||||||||||||
| Cost of revenues |
$ | 1,638 | $ | 471 | $ | 164 | $ | 2,194 | $ | 670 | ||||||||||
| Research and development |
7,159 | 6,356 | 4,473 | 26,580 | 13,377 | |||||||||||||||
| Selling, general and administrative |
5,619 | 5,648 | 4,045 | 21,371 | 15,372 | |||||||||||||||
|
|
|
|
|
|
|
|
|
|
|
|||||||||||
| Total stock-based compensation expense |
$ | 14,416 | $ | 12,475 | $ | 8,682 | $ | 50,145 | $ | 29,419 | ||||||||||
|
|
|
|
|
|
|
|
|
|
|
|||||||||||
| (2) | On October 3, 2012, the Company completed its follow-on public offering, pursuant to which the Company sold 7,964,601 shares of common stock. |
Tesla Motors, Inc.
Condensed Consolidated Balance Sheets
(Unaudited)
(In thousands)
| December 31, | December 31, | |||||||
| 2012 | 2011 | |||||||
| Assets |
||||||||
| Cash and cash equivalents |
$ | 201,890 | $ | 255,266 | ||||
| Restricted cash - current |
19,094 | 23,476 | ||||||
| Short-term marketable securities |
| 25,061 | ||||||
| Accounts receivable |
26,842 | 9,539 | ||||||
| Inventory |
268,504 | 50,082 | ||||||
| Prepaid expenses and other current assets |
8,438 | 9,414 | ||||||
| Operating lease vehicles, net |
10,071 | 11,757 | ||||||
| Property and equipment, net |
552,229 | 298,414 | ||||||
| Restricted cash - noncurrent |
5,159 | 8,068 | ||||||
| Other assets |
21,963 | 22,371 | ||||||
|
|
|
|
|
|||||
| Total assets |
$ | 1,114,190 | $ | 713,448 | ||||
|
|
|
|
|
|||||
| Liabilities and Stockholders Equity |
||||||||
| Accounts payable and accrued liabilities |
$ | 343,180 | $ | 88,250 | ||||
| Deferred revenue |
4,964 | 5,491 | ||||||
| Reservation payments |
138,817 | 91,761 | ||||||
| Common stock warrant liability |
10,692 | 8,838 | ||||||
| Capital lease obligations |
14,330 | 3,897 | ||||||
| Long-term debt |
452,337 | 276,251 | ||||||
| Other long-term liabilities |
25,170 | 14,915 | ||||||
|
|
|
|
|
|||||
| Total liabilities |
989,490 | 489,403 | ||||||
| Stockholders equity |
124,700 | 224,045 | ||||||
|
|
|
|
|
|||||
| Total liabilities and stockholders equity |
$ | 1,114,190 | $ | 713,448 | ||||
|
|
|
|
|
|||||
Tesla Motors, Inc.
Supplemental Consolidated Financial Information
(Unaudited)
(In thousands)
| Three Months Ended | Year Ended | |||||||||||||||||||
| Dec 31, 2012 |
Sept 30, 2012 |
Dec 31, 2011 |
Dec 31, 2012 |
Dec 31, 2011 |
||||||||||||||||
| Selected Cash Flow Information |
||||||||||||||||||||
| Cash flows used in operating activities |
$ | (28,839 | ) | $ | (94,952 | ) | $ | (27,088 | ) | $ | (234,861 | ) | $ | (114,364 | ) | |||||
| Cash flows provided by (used in) investing activities |
(69,408 | ) | (70,088 | ) | 15,254 | (238,150 | ) | (175,928 | ) | |||||||||||
| Cash flows provided by financing activities |
214,444 | 40,179 | 53,772 | 419,635 | 446,000 | |||||||||||||||
| Other Selected Financial Information |
||||||||||||||||||||
| Cash flows used in operating activities |
$ | (28,839 | ) | $ | (94,952 | ) | $ | (27,088 | ) | $ | (234,861 | ) | $ | (114,364 | ) | |||||
| Capital expenditures |
(72,703 | ) | (68,472 | ) | (54,262 | ) | (270,448 | ) | (197,896 | ) | ||||||||||
|
|
|
|
|
|
|
|
|
|
|
|||||||||||
| Free cash flow |
$ | (101,542 | ) | $ | (163,424 | ) | $ | (81,350 | ) | $ | (505,309 | ) | $ | (312,260 | ) | |||||
|
|
|
|
|
|
|
|
|
|
|
|||||||||||
| Depreciation and amortization |
$ | 12,793 | $ | 7,521 | $ | 4,804 | $ | 28,825 | $ | 16,919 | ||||||||||
| Dec 31, 2012 |
Sept 30, 2012 |
Dec 31, 2011 |
||||||||||
| Cash and Investments |
||||||||||||
| Cash and cash equivalents |
$ | 201,890 | $ | 85,693 | $ | 255,266 | ||||||
| Restricted cash - current |
19,094 | 22,861 | 23,476 | |||||||||
| Short-term marketable securities |
| | 25,061 | |||||||||
| Restricted cash - noncurrent |
5,159 | 4,688 | 8,068 | |||||||||
Tesla Motors, Inc.
Reconciliation of GAAP to Non-GAAP Financial Information
(Unaudited)
(In thousands, except per share data)
| Three Months Ended | Year Ended | |||||||||||||||||||
| Dec 31, 2012 |
Sept 30, 2012 |
Dec 31, 2011 |
Dec 31, 2012 |
Dec 31, 2011 |
||||||||||||||||
| Research and development expenses (GAAP) |
$ | 68,832 | $ | 61,901 | $ | 61,206 | $ | 273,978 | $ | 208,981 | ||||||||||
| Stock-based compensation expense |
(7,159 | ) | (6,356 | ) | (4,473 | ) | (26,580 | ) | (13,377 | ) | ||||||||||
|
|
|
|
|
|
|
|
|
|
|
|||||||||||
| Research and development expenses (Non-GAAP) |
$ | 61,673 | $ | 55,545 | $ | 56,733 | $ | 247,398 | $ | 195,604 | ||||||||||
|
|
|
|
|
|
|
|
|
|
|
|||||||||||
| Selling, general and administrative expenses (GAAP) |
$ | 45,908 | $ | 37,798 | $ | 27,556 | $ | 150,372 | $ | 104,102 | ||||||||||
| Stock-based compensation expense |
(5,619 | ) | (5,648 | ) | (4,045 | ) | (21,371 | ) | (15,372 | ) | ||||||||||
|
|
|
|
|
|
|
|
|
|
|
|||||||||||
| Selling, general and administrative expenses (Non-GAAP) |
$ | 40,289 | $ | 32,150 | $ | 23,511 | $ | 129,001 | $ | 88,730 | ||||||||||
|
|
|
|
|
|
|
|
|
|
|
|||||||||||
| Net loss (GAAP) |
$ | (89,932 | ) | $ | (110,804 | ) | $ | (81,488 | ) | $ | (396,213 | ) | $ | (254,411 | ) | |||||
| Stock-based compensation expense |
14,416 | 12,475 | 8,682 | 50,145 | 29,419 | |||||||||||||||
| Change in fair value of warrant liability |
958 | 1,205 | 649 | 1,854 | 2,750 | |||||||||||||||
|
|
|
|
|
|
|
|
|
|
|
|||||||||||
| Net loss (Non-GAAP) |
$ | (74,558 | ) | $ | (97,124 | ) | $ | (72,157 | ) | $ | (344,214 | ) | $ | (222,242 | ) | |||||
|
|
|
|
|
|
|
|
|
|
|
|||||||||||
| Net loss per common share, basic and diluted (GAAP) |
$ | (0.79 | ) | $ | (1.05 | ) | $ | (0.78 | ) | $ | (3.69 | ) | $ | (2.53 | ) | |||||
| Stock-based compensation expense |
0.13 | 0.12 | 0.08 | 0.47 | 0.29 | |||||||||||||||
| Change in fair value of warrant liability |
0.01 | 0.01 | 0.01 | 0.02 | 0.03 | |||||||||||||||
|
|
|
|
|
|
|
|
|
|
|
|||||||||||
| Net loss per common share, basic and diluted (Non-GAAP) |
$ | (0.65 | ) | $ | (0.92 | ) | $ | (0.69 | ) | $ | (3.20 | ) | $ | (2.21 | ) | |||||
|
|
|
|
|
|
|
|
|
|
|
|||||||||||
| Shares used in per share calculation, basic and diluted (GAAP and Non-GAAP) |
113,763 | 105,556 | 104,392 | 107,349 | 100,389 | |||||||||||||||
|
|
|
|
|
|
|
|
|
|
|
|||||||||||
Non-GAAP Financial Information
Consolidated financial information has been presented in accordance with GAAP as well as on a non-GAAP basis. On a non-GAAP basis, financial measures exclude non-cash items such as stock-based compensation as well as the change in fair value related to Teslas warrant liability. Management believes that it is useful to supplement its GAAP financial statements with this non-GAAP information because management uses such information internally for its operating, budgeting and financial planning purposes. These non-GAAP financial measures also facilitate managements internal comparisons to Teslas historical performance as well as comparisons to the operating results of other companies. Non-GAAP information is not prepared under a comprehensive set of accounting rules and therefore, should only be read in conjunction with financial information reported under U.S. GAAP when understanding Teslas operating performance. A reconciliation between GAAP and non-GAAP financial information is provided above.
