Tesla Motors Inc 8-K 2012-05-09
Sign in or join
Add a note by highlighting text or Replying to an existing note.
Add a note by highlighting text or Replying to an existing note.
Exhibit 99.1

|
Tesla Motors, Inc. First Quarter 2012 Shareholder Letter
Model S deliveries to start ahead of schedule in June
Model S reservations top 10,000
Daimler Mercedes powertrain agreement signed
Toyota RAV4 powertrain shipments begin ahead of schedule
Solid Roadster demand & gross margin |
May 9, 2012
Dear Fellow Shareholders,
We are pleased to report that we have nearly completed all regulatory approvals and certifications required to begin delivery of Model S to our customers in the United States. Thus, we anticipate that initial deliveries will begin in June, ahead of our announced schedule of July.
On the Powertrain side of our business, we completed the Toyota RAV4 EV development program in Q1 and started deliveries of production components, also ahead of schedule. The RAV4 EV marries the efficiency of an EV with the versatility of an SUV in fact it is the only electric SUV on the market. With the largest battery pack of any non-premium EV, it is expected to have a city range of almost 170 miles, more than 60% above the Nissan Leaf. The electric RAV4 is a high performance version of the RAV4 with outstanding acceleration and excellent handling due to the low center of gravity afforded by the floor mounted battery pack.
We recently signed an agreement with Daimler to create an entire electric powertrain for a new Mercedes-Benz EV, thus formalizing the joint effort kicked off in Q4 last year. This program is expected to exceed in value the sum of all powertrain agreements signed in Tesla history. Producing at this expected volume will allow for economies of scale that give the resulting vehicle a cost of ownership that is on par with its gasoline equivalent.
Model S Deliveries to Begin in June
All aspects of the Model S program remain on track to commence deliveries in June. The Tesla Factory is producing vehicles at a steadily increasing rate, and so far this year we have built about 50 Beta and about 30 Release Candidate prototypes. All these vehicles are dedicated to a comprehensive testing program, including crash and safety testing, systems integration, reliability testing, and quality audits.
| Model S has now been fully certified by the U.S. Environmental Protection Agency (EPA) and the State of California. We have also successfully completed almost all of the crash testing required under the National Traffic and Motor Vehicle Safety Act using our Release Candidate prototypes. Once we complete and document the tests, we will be able to sell our vehicles in the United States. This leaves us confident we can begin Model S customer deliveries in June, ahead of our announced schedule of July. |

|
We expect the safety rating of Model S will be independently determined by the National Highway Traffic Safety Administration (NHTSA) and other groups. Under NHTSAs New Car Assessment Program (NCAP), selected cars are independently purchased and crash tested. NHTSA then assigns star ratings to tested cars using the NCAP standards. Based on our internal crash tests and consistent with these published standards, we believe Model S will achieve NHTSAs top, 5-star, rating. Compliance testing for global markets continues and will be announced as achieved.
Delivering the first few customer cars in June highlights the fact that Model S will be fully compliant and available for purchase in the U.S. These cars will carry customer, rather than manufacturer, license plates, signifying that they are fully homologated and completely street legal. We plan to continue making customer deliveries on a slow, methodical ramp, and remain confident in our target of 5,000 vehicle deliveries by year end.
Strong Reservations; Model S Marketing to Accelerate
We had over 9,800 Model S reservations at quarter end, and shortly thereafter topped 10,000. Our growth in reservations during the quarter is particularly significant given that we did not add any new stores during that period. In addition, we also took about 1,000 Model X reservations during the quarter, after its successful introduction in February. We dont plan to make quarterly Model X reservation updates until next year, when Model X becomes a greater focus of our marketing activities.
|
During the quarter, we completed an agreement with Athlon Car Lease to introduce Model S to corporate customers across Europe. This comes on top of our existing Roadster lease agreement with Athlon. As part of this agreement, Athlon Car Lease reserved 150 Model S sedans to ensure early availability of the car for its customers. This is the first Model S fleet reservation made worldwide by a leasing company. Our lease program with Athlon covers several major countries on the European continent, including Germany, France, Italy, Spain, Belgium and the Netherlands.
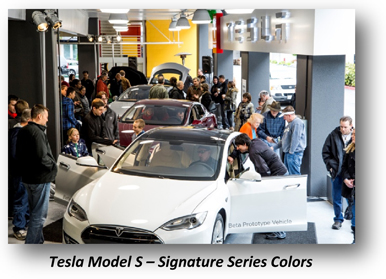
We have recently started contacting our Signature Series reservation holders to lock in exterior color, interior decor and other options as we prepare to begin deliveries. All customers will receive Tesla Personal Delivery and have the option to pick up their car at the Tesla Factory in Fremont, California or have their Model S delivered to any location of their choice, including at home. |
Our stores continue to see very strong visitor traffic. In the first quarter we had over 410,000 visitors at our six New Design stores and galleries in North America. The pace of marketing the Model S is beginning to accelerate. In April, we opened a store in Oslo, Norway, and plan to open ten additional stores this year at strategic locations domestically, several of which will be in the northeast corridor of the United States. Our reservation holders and the general public will be able to test drive Model S in North America for the first time this summer. These store openings and test drive events should build consumer interest, brand awareness and store visitor traffic as more people experience Model S firsthand.
Solid Roadster Demand & Gross Margin, Increased R&D Expenses and Strong Cash Position
Q1 revenue was $30.2 million, reflecting sequential quarterly growth in Roadster deliveries in Europe and Asia, and the end of Roadster sales in North America. We delivered 99 Roadsters in the quarter, with unit deliveries up 10% from a year ago in Europe and Asia, combined. This solid growth reflects continued demand for Roadster, despite global economic challenges. Total Roadster deliveries now exceed 2,250, with only about 250 Roadsters remaining for sale in Europe and Asia.
We also delivered the first powertrains to Toyota for the RAV4 EV, and a small number of extra battery packs and chargers to Daimler. Development services revenue reflects our successful achievement of the final milestones on the Toyota RAV4 EV development contract.
Automotive gross margin was very healthy at 28%, as Roadsters are selling at prices consistent with those of last quarter. This is impressive given that this is our last year for Roadster sales. Development services gross margin was also very strong at 45%, and achieved the sequential recovery we communicated last quarter. In total, Q1 gross margin was 34%, representing the highest level in a year.
Research and development (R&D) expenses were $62.5 million on a non-GAAP basis. This 10% sequential increase in R&D expenses is due to our increasing investments in Model S manufacturing preparedness, process validation, prototype builds and extensive testing at both the car and component levels. Our manufacturing team has grown substantially in this quarter, in order to be well trained and prepared to produce high quality cars. Thus, a substantial portion of our R&D expenses are one-time investments in preparation for Model S production. We have consciously chosen to invest more when needed to reach our safety, quality and performance goals for Model S. This has enabled us to deliver our first customer cars ahead of the announced schedule.
Selling, general and administrative (SG&A) expenses rose 10% sequentially on a non-GAAP basis, primarily due to a full quarter of marketing expense for the stores we opened in Q4.
Our non-GAAP net loss for the quarter was $79 million, or $(0.76) per share, based on 104.8 million weighted common shares outstanding. This includes a $1 million non-cash impact in other expenses, related primarily to the revaluation of our foreign currency denominated assets and liabilities, as a result of the significant weakening of the dollar during the quarter. Capital expenditures were about $68 million in Q1 as we continued to build out the Tesla Factory and invest in tooling for Model S.
We concluded the quarter with $387 million in cash resources. This reflects $283 million in total cash on hand, including our DoE dedicated account, and the additional $104 million we had left to draw on our loan facility with the Department of Energy (DoE). We drew down $84 million from our DoE loan facility in Q1 as our projects remain on track with the DoE under the terms of the loan agreement. Our relationship with the DoE remains strong and we plan to draw down all remaining funds over the next two quarters. We continue to believe that we have adequate liquidity to reach profitability in 2013, based on our current plans.
Updated 2012 Financial Guidance
Given that Model S deliveries are set to begin ahead of our announced July timing, we are raising the bottom end of our prior 2012 revenue guidance by $10 million, to $560-600 million, up from $550-600 million. We expect Q2 revenue will be comparable to the Q1 level, and consistent with our prior guidance that 1H revenue will be about 10% of our full year revenue guidance.
We also reiterate the guidance provided in the Q4 2011 shareholder letter for capital expenditures and gross margin trends. We anticipate our R&D spending should increase sequentially in Q2, by about 20-25% as we continue to grow the manufacturing team prior to launch and incur expenses to complete our final activities related to the development of Model S and the Tesla Factory. With the start of Model S production, one-time development related expenses will decline, and manufacturing expenses will be reflected in cost of goods sold rather than in R&D. Q3 R&D spending should therefore decline substantially.
In Closing
We are excited to begin deliveries of Model S. Stay tuned for opportunities to see and test drive Model S. We want you to experience for yourselves how electric vehicles can surpass their internal combustion counterparts in every way.
In closing, one of our customers in Europe let us know he recently drove his Roadster past the 200,000 kilometer mark. At Tesla, we are going the distance, one customer at a time.
Thank you for your interest in Tesla Motors.
| Sincerely,
|
||

|

|
|
| Elon Musk, Chairman, Product Architect and CEO | Deepak Ahuja, Chief Financial Officer | |
Webcast Information
Tesla will provide a live webcast of its first quarter 2012 financial results conference call beginning at 2:30 p.m. PDT on May 9, 2012, at ir.teslamotors.com. This webcast will also be available for replay for approximately two weeks thereafter.
Forward-Looking Statements
Certain statements in this shareholder letter, including statements in the Updated 2012 Financial Guidance section of this Shareholder Letter, statements relating to the progress Tesla is making with respect to the development, testing, performance, attributes, safety expectations, schedule of development, launch, test drives and volume expectations of Model S; the schedule, development, features, anticipated performance, safety expectations, volume expectations and pricing of, and the ability of Tesla to leverage the Model S platform for, Model X; the ability to achieve revenue, gross margin, spending and profitability targets; the ability of Tesla to produce vehicles at the Tesla Factory in Fremont, California as well as the plans and schedule for the Tesla Factory and the equipment there; the schedules related to, the financial results, including the total value, expected from Teslas development programs with Daimler and Toyota; performance characteristics of the Toyota RAV4 EV; expected benefits from working with partner companies such as Daimler, such as a lower vehicle cost of ownership that result from such partnerships; our ability to execute multiple product development programs simultaneously; the sufficiency of current available funds to reach profitability in 2013; and the ability of Tesla to execute on its new interactive retail strategy and future store opening plans are forward-looking statements that are subject to risks and uncertainties. These forward-looking statements are based on managements current expectations, and as a result of certain risks and uncertainties actual results may differ materially from those projected. The following important factors, without limitation, could cause actual results to differ materially from those in the forward-looking statements: Teslas future success depends on its ability to design and achieve market acceptance of new vehicle models, specifically Model S and Model X; the risk of delays in the design, manufacture, launch and financing of Model S, including the build-out of its Model S manufacturing facility and the ability of its suppliers to meet quality and part delivery expectations; the risk of a decline in revenues prior to the launch of Model S; consumers willingness to adopt electric vehicles and electric cars in particular; Teslas ability to fully draw down on its facility from the U.S. Department of Energy; risks associated with the ability to achieve the expected financial results from the production of powertrain systems for the Toyota RAV4 EV; competition in the automotive market generally and the alternative fuel vehicle market in particular; Teslas ability to establish, maintain and strengthen the Tesla brand; the unavailability, reduction or elimination of governmental and economic incentives for electric vehicles; Teslas ability to establish, maintain and strengthen its relationships with strategic partners such as Daimler, Toyota and Panasonic; and Teslas ability to execute on its plans for its new interactive retail strategy and for new store openings. More information on potential factors that could affect the Companys financial results is included from time to time in Teslas Securities and Exchange Commission filings and reports, including the risks identified under the section captioned Risk Factors in its annual report on Form 10-K filed on February 27, 2012. Tesla disclaims any obligation to update information contained in these forward-looking statements whether as a result of new information, future events, or otherwise.
Non-GAAP Financial Information
Consolidated financial information has been presented in accordance with GAAP as well as on a non-GAAP basis. On a non-GAAP basis, financial measures exclude non-cash items such as stock-based compensation as well as the change in fair value related to Teslas warrant liability. Management believes that it is useful to supplement its GAAP financial statements with this non-GAAP information because management uses such information internally for its operating, budgeting and financial planning purposes. These non-GAAP financial measures also facilitate managements internal comparisons to Teslas historical performance as well as comparisons to the operating results of other companies. In addition, Tesla believes these non-GAAP financial measures are useful to investors because they allow for greater transparency into the indicators used by management as a basis for its financial and operational decision making. Non-GAAP information is not prepared under a comprehensive set of accounting rules and therefore, should only be read in conjunction with financial information reported under U.S. GAAP when understanding Teslas operating performance. A reconciliation between GAAP and non-GAAP financial information is provided below.
| Investor Relations Contact: | Press Contact: | |||
| Jeff Evanson | KC Simon | |||
| 650-681-5050 | Tesla Motors | |||
| ir@teslamotors.com | ksimon@teslamotors.com |
For additional information, please visit ir.teslamotors.com.
Tesla Motors, Inc.
Condensed Consolidated Statements of Operations
(Unaudited)
(In thousands, except per share data)
| Three Months Ended | ||||||||||||
| Mar 31, 2012 |
Dec 31, 2011 |
Mar 31, 2011 |
||||||||||
| Revenues |
||||||||||||
| Automotive sales |
$ | 19,245 | $ | 32,677 | $ | 33,628 | ||||||
| Development services |
10,922 | 6,698 | 15,402 | |||||||||
|
|
|
|
|
|
|
|||||||
| Total revenues |
30,167 | 39,375 | 49,030 | |||||||||
|
|
|
|
|
|
|
|||||||
| Cost of revenues |
||||||||||||
| Automotive sales |
13,932 | 25,241 | 26,961 | |||||||||
| Development services |
6,025 | 6,299 | 4,041 | |||||||||
|
|
|
|
|
|
|
|||||||
| Total cost of revenues (1) |
19,957 | 31,540 | 31,002 | |||||||||
|
|
|
|
|
|
|
|||||||
| Gross profit |
10,210 | 7,835 | 18,028 | |||||||||
| Operating expenses |
||||||||||||
| Research and development (1) |
68,391 | 61,206 | 41,162 | |||||||||
| Selling, general and administrative (1) |
30,582 | 27,556 | 24,212 | |||||||||
|
|
|
|
|
|
|
|||||||
| Total operating expenses |
98,973 | 88,762 | 65,374 | |||||||||
|
|
|
|
|
|
|
|||||||
| Loss from operations |
(88,763 | ) | (80,927 | ) | (47,346 | ) | ||||||
| Interest income |
90 | 89 | 40 | |||||||||
| Interest expense |
(65 | ) | (43 | ) | | |||||||
| Other expense, net |
(1,076 | ) | (495 | ) | (1,485 | ) | ||||||
|
|
|
|
|
|
|
|||||||
| Loss before income taxes |
(89,814 | ) | (81,376 | ) | (48,791 | ) | ||||||
| Provision for income taxes |
59 | 112 | 150 | |||||||||
|
|
|
|
|
|
|
|||||||
| Net loss |
$ | (89,873 | ) | $ | (81,488 | ) | $ | (48,941 | ) | |||
|
|
|
|
|
|
|
|||||||
| Net loss per common share, basic and diluted (2) |
$ | (0.86 | ) | $ | (0.78 | ) | $ | (0.51 | ) | |||
|
|
|
|
|
|
|
|||||||
| Shares used in per share calculation, basic and diluted (2) |
104,784 | 104,392 | 95,187 | |||||||||
|
|
|
|
|
|
|
|||||||
| Notes: | ||||||||||||
| (1) Includes stock-based compensation expense of the following for the periods presented: |
|
|||||||||||
| Cost of revenues |
$ | 7 | $ | 164 | $ | 154 | ||||||
| Research and development |
5,932 | 4,473 | 2,299 | |||||||||
| Selling, general and administrative |
4,772 | 4,045 | 3,473 | |||||||||
|
|
|
|
|
|
|
|||||||
| Total stock-based compensation expense |
$ | 10,711 | $ | 8,682 | $ | 5,926 | ||||||
|
|
|
|
|
|
|
|||||||
| (2) | On June 8, 2011, the Company completed its follow-on public offering, pursuant to which the Company sold 6,095,000 shares of common stock. Concurrent with the closing of the offering, the Company issued 1,416,000 shares of common stock to Elon Musk and 637,475 shares of common stock to an affiliate of Daimler AG in a private placement. |
Tesla Motors, Inc.
Condensed Consolidated Balance Sheets
(Unaudited)
(In thousands)
| March 31, | December 31, | |||||||
| 2012 | 2011 | |||||||
| Assets |
||||||||
| Cash and cash equivalents |
$ | 218,570 | $ | 255,266 | ||||
| Short-term marketable securities |
25,009 | 25,061 | ||||||
| Restricted cash - current |
39,199 | 23,476 | ||||||
| Accounts receivable |
13,589 | 9,539 | ||||||
| Inventory |
55,427 | 50,082 | ||||||
| Prepaid expenses and other current assets |
7,103 | 9,414 | ||||||
| Operating lease vehicles, net |
12,046 | 11,757 | ||||||
| Property and equipment, net |
364,128 | 298,414 | ||||||
| Restricted cash - noncurrent |
3,805 | 8,068 | ||||||
| Other assets |
22,224 | 22,371 | ||||||
|
|
|
|
|
|||||
| Total assets |
$ | 761,100 | $ | 713,448 | ||||
|
|
|
|
|
|||||
| Liabilities and Stockholders Equity |
||||||||
| Accounts payable and accrued liabilities |
$ | 97,946 | $ | 88,250 | ||||
| Deferred revenue |
5,666 | 5,491 | ||||||
| Reservation payments |
113,318 | 91,761 | ||||||
| Common stock warrant liability |
8,683 | 8,838 | ||||||
| Capital lease obligations |
5,391 | 3,897 | ||||||
| Long-term debt |
360,517 | 276,251 | ||||||
| Other long-term liabilities |
15,705 | 14,915 | ||||||
|
|
|
|
|
|||||
| Total liabilities |
607,226 | 489,403 | ||||||
| Stockholders equity |
153,874 | 224,045 | ||||||
|
|
|
|
|
|||||
| Total liabilities and stockholders equity |
$ | 761,100 | $ | 713,448 | ||||
|
|
|
|
|
|||||
Tesla Motors, Inc.
Supplemental Consolidated Financial Information
(Unaudited)
(In thousands)
| Three Months Ended | ||||||||||||
| Mar 31, 2012 |
Dec 31, 2011 |
Mar 31, 2011 |
||||||||||
| Selected Cash Flow Information |
||||||||||||
| Cash flows used in operating activities |
$ | 50,087 | $ | 27,088 | $ | 43,297 | ||||||
| Cash flows provided by (used in) investing activities |
(79,440 | ) | 15,254 | 10,111 | ||||||||
| Cash flows provided by financing activities |
92,831 | 53,772 | 34,283 | |||||||||
| Other Selected Financial Information |
||||||||||||
| Capital expenditures |
$ | 67,987 | $ | 54,262 | $ | 20,476 | ||||||
| Depreciation and amortization |
$ | 4,163 | $ | 4,804 | $ | 3,517 | ||||||
| Mar 31, 2012 |
Dec 31, 2011 |
|||||||
| Cash and Investments |
||||||||
| Cash and cash equivalents |
$ | 218,570 | $ | 255,266 | ||||
| Restricted cash - current |
39,199 | 23,476 | ||||||
| Short-term marketable securities |
25,009 | 25,061 | ||||||
| Restricted cash - noncurrent |
3,805 | 8,068 | ||||||
Tesla Motors, Inc.
Reconciliation of GAAP to Non-GAAP Financial Information
(Unaudited)
(In thousands, except per share data)
| Three Months Ended | ||||||||||||
| Mar 31, 2012 |
Dec 31, 2011 |
Mar 31, 2011 |
||||||||||
| Research and development expenses (GAAP) |
$ | 68,391 | $ | 61,206 | $ | 41,162 | ||||||
| Stock-based compensation expense |
(5,932 | ) | (4,473 | ) | (2,299 | ) | ||||||
|
|
|
|
|
|
|
|||||||
| Research and development expenses (Non-GAAP) |
$ | 62,459 | $ | 56,733 | $ | 38,863 | ||||||
|
|
|
|
|
|
|
|||||||
| Selling, general and administrative expenses (GAAP) |
$ | 30,582 | $ | 27,556 | $ | 24,212 | ||||||
| Stock-based compensation expense |
(4,772 | ) | (4,045 | ) | (3,473 | ) | ||||||
|
|
|
|
|
|
|
|||||||
| Selling, general and administrative expenses (Non-GAAP) |
$ | 25,810 | $ | 23,511 | $ | 20,739 | ||||||
|
|
|
|
|
|
|
|||||||
| Net loss (GAAP) |
$ | (89,873 | ) | $ | (81,488 | ) | $ | (48,941 | ) | |||
| Stock-based compensation expense |
10,711 | 8,682 | 5,926 | |||||||||
| Change in fair value of warrant liability |
(155 | ) | 649 | 1,421 | ||||||||
|
|
|
|
|
|
|
|||||||
| Net loss (Non-GAAP) |
$ | (79,317 | ) | $ | (72,157 | ) | $ | (41,594 | ) | |||
|
|
|
|
|
|
|
|||||||
| Net loss per common share, basic and diluted (GAAP) |
$ | (0.86 | ) | $ | (0.78 | ) | $ | (0.51 | ) | |||
| Stock-based compensation expense |
0.10 | 0.08 | 0.06 | |||||||||
| Change in fair value of warrant liability |
(0.00 | ) | 0.01 | 0.01 | ||||||||
|
|
|
|
|
|
|
|||||||
| Net loss per common share, basic and diluted (Non-GAAP) |
$ | (0.76 | ) | $ | (0.69 | ) | $ | (0.44 | ) | |||
|
|
|
|
|
|
|
|||||||
| Shares used in per share calculation, basic and diluted (GAAP and Non-GAAP) |
104,784 | 104,392 | 95,187 | |||||||||
|
|
|
|
|
|
|
|||||||
Non-GAAP Financial Information
Consolidated financial information has been presented in accordance with GAAP as well as on a non-GAAP basis. On a non-GAAP basis, financial measures exclude non-cash items such as stock-based compensation as well as the change in fair value related to Teslas warrant liability. Management believes that it is useful to supplement its GAAP financial statements with this non-GAAP information because management uses such information internally for its operating, budgeting and financial planning purposes. These non-GAAP financial measures also facilitate managements internal comparisons to Teslas historical performance as well as comparisons to the operating results of other companies. Non-GAAP information is not prepared under a comprehensive set of accounting rules and therefore, should only be read in conjunction with financial information reported under U.S. GAAP when understanding Teslas operating performance. A reconciliation between GAAP and non-GAAP financial information is provided above.
