Tesla Motors Inc 8-K 2011-08-03
Sign in or join
Add a note by highlighting text or Replying to an existing note.
Add a note by highlighting text or Replying to an existing note.
Exhibit 99.1

|
Tesla Motors, Inc. Second Quarter 2011 Shareholder Letter
Strong Quarterly Revenue Growth Driven by Roadster Demand Model S Program on Track for mid-2012 Deliveries Successful Stock Offering of $231 million |
August 3, 2011
Dear Fellow Shareholders,
We are pleased to announce a quarter of exceptional performance on all aspects of our business. Total revenue in the second quarter was $58 million, more than double the revenue we earned in Q2 of last year and the highest quarterly revenue in our history. Gross margin was again over 30% for the third quarter in a row.
Our engineering, manufacturing and supply chain teams continue to make excellent progress on the Model S program. As a result, the development of Model S remains on schedule for first customer deliveries in mid-2012. In addition, we continue to have confidence in our long term target gross margin of 25% for Model S when we reach an annualized sales run rate of 20,000 units.
Our non-GAAP loss of $0.53 per share this quarter ($0.60 per share on a GAAP basis) reflects our continued investments in R&D and our corporate infrastructure to support the launch of Model S. As we have mentioned before, we anticipate that our product related spending will produce losses until we reach volume sales of Model S. We are excited about the investments we are making, but also remain vigilant on the bottom line.
In this, our first Quarterly Shareholder Letter, we will discuss our second quarter results, update you on key aspects of our business, and discuss the outlook for our future. Our preliminary unaudited financial results for the quarter ended June 30, 2011 and information about forward-looking statements are included at the end of this letter for your reference.
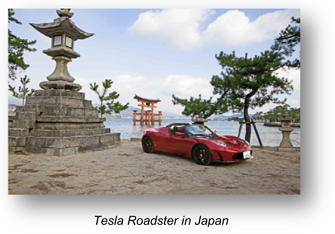
Strong Roadster Demand
| We continue to experience strong customer demand for the Roadster globally. During the quarter, we delivered 190 Roadsters, representing unit growth of almost 35% from the same quarter last year and 31% growth from the prior quarter. We generated over $27 million in Roadster-related revenue in this quarter, up 44% from the same quarter last year, as the larger unit volumes were coupled with a slightly lower lease mix and higher service revenue. Roadster sales in Europe and Asia continued to grow and international represented roughly half of our total Roadster deliveries. As of June 30, we have delivered about 1,840 Roadsters worldwide. Automotive gross margin was at a record 22%, primarily due to slightly higher average selling prices and ongoing cost improvement programs on the Roadster as compared to the prior quarter. |
|
Given the strong demand for our Roadsters, we increased the program size to 2,500 Roadsters, up from 2,400. We expect to build all remaining Roadsters by January 2012. We plan to sell the last of the North American Roadsters by early next year and continue selling in Europe and Asia until inventory is fully depleted in 2012. This transition is planned to mirror the geographic roll-out of deliveries for Model S, which will begin in North America,
followed by Europe and then Asia. As we wind down our selling efforts on the Roadster in the United States through the balance of this year, we plan to transition our sales team to more active support of Model S.
Our Roadster owners have now driven over 13 million electrically-powered miles, the equivalent of driving around the circumference of the Earth over 500 times. Such remarkable distances are a testament to the durability of the Roadster as well as to the sheer joy of driving electric. We have used this real-world experience to improve the Roadster and, importantly, to refine the Model S electric powertrain.
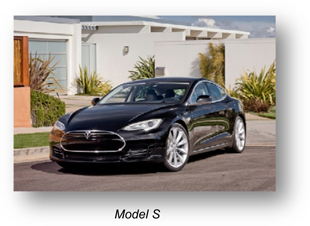
Model S Development on Plan
We continue to make excellent progress on the development of Model S and our manufacturing facility in Fremont. The program remains on track for the mid-2012 target date for first customer deliveries.
As its development progresses, we feel confident that Model S will not only redefine the EV but will set a new standard for premium sedans. Our revolutionary packaging of the electric powertrain has created a vehicle with exceptional structural rigidity, handling and safety. As a result, it has also enabled more functional storage space than any sedan on the market and given the Model S customer the option of seating seven passengers. The speed, power and styling of Model S will deliver a driving experience like no other.
The Model S development program has three major phases of pre-production Alpha, Beta and Release Candidate. Throughout the phases, we produce cars for extensive testing and evaluation purposes. The cars produced in each phase have an increasing maturation of design, tooling and manufacturing process, leading ultimately to the first customer vehicle rolling off our production line. The various activities in each stage are outlined in the table below:
| Phase | Alpha | Beta | Release Candidate | |||
| Build Timing
|
Q4 10 Q2 11
|
Q3 11 Q4 11
|
Q1 12 Q2 12
|
|||
| Design
|
Prototype
|
Production
|
Production
|
|||
| Tooling
|
Prototype
|
Prototype / Production
|
Production
|
|||
| Process
|
Prototype
|
Prototype / Production
|
Production
|
|||
| Activities
|
Integration Reliability Safety Testing Performance Tuning
|
Factory Readiness Quality Refinement Safety Testing Performance Tuning Marketing Cars
|
Homologation Fine Tuning Factory Ramp Up
|
|||
We started the Alpha phase in Q4 2010 with the production of the first of 15 vehicles. We have subjected these vehicles to a full battery of initial tests over the past several months, including cold weather braking, suspension, steering, performance, reliability and safety testing, all of which are ongoing. As an example, one vehicle has logged in excess of 150,000 equivalent miles through our ongoing durability testing. The Alpha cars have been tested in all types of conditions, and whenever possible, we have upgraded these vehicles with the latest components to incorporate the lessons learned from testing. Weve used the results gathered in these tests to further refine the overall design of Model S and many of its constituent parts. Overall, we are especially pleased
|
that we have retained all the key design elements of the concept car and further refined the exterior and interior which we hope will delight future Model S owners.
While testing of the Alpha vehicles continues, we also initiated in June and on schedule our Beta phase of development. In the Beta phase, we are taking the learnings and design enhancements of the Alpha phase and rolling them into this new phase of vehicles. Almost all of the critical parts have been sourced, resulting in further visibility of material costs and supplier availability of production parts. During the Beta phase, we are using a growing number of production parts and tooling in the build of the vehicles. We are also using a manufacturing process that will increasingly represent the production manufacturing process. We plan to produce about 50 Beta vehicles in this phase for more testing, validation, systems integration and marketing |
|
| efforts. We are looking forward to unveiling the Beta vehicles to the public in the next few months.
The Beta phase will be followed by the production of Release Candidate cars during the first half of 2012. During this phase of the program, we will fine-tune production and assembly processes to build high quality cars for sales to our customers.
Model X Advanced Engineering on Plan
As we complete the various stages of development of Model S, we are beginning the design and advanced engineering of our next vehicle, the Model X crossover. Model X is intended to provide the functionality of a minivan with a design as cool as an SUV, which we expect will redefine these market segments. Our growing confidence in Model S, and the funds raised in our recent follow-on offering, have allowed us to accelerate the development of Model X. Our designers and engineers are now hard at work on the Model X prototype, which we are on plan for revealing late this year. Since we are leveraging the Model S architecture and powertrain for Model X, we anticipate that Model X can be brought to production quickly for first customer deliveries in late 2013, with volumes ramping to 10,000 - 15,000 units per year beginning in 2014. With pricing similar to that of Model S, Model X has the potential to significantly increase our revenues. |
||
|
With the acceleration of Model X, we are adding headcount to enhance our ability to execute multiple product development |
||
| programs simultaneously. Since weve been able to continue to hire oustanding engineers, the time is right for us to build this capability now. |
|
|
|
Manufacturing Preparedness on Plan
We continue to make substantial progress preparing the Tesla Factory in Fremont, California, where we will manufacture Model S, followed by Model X. Detailed manufacturing readiness plans in each shop are being executed by our growing manufacturing team, all with the goal of being able to commence first customer deliveries of Model S in mid-2012.
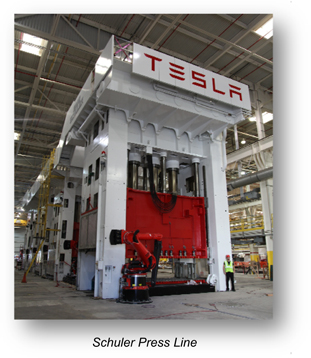
Almost all of the Model S vehicle manufacturing equipment has now been specified and ordered. Some equipment has already arrived and is being installed, especially in the stamping, plastics and paint shops. The Schuler press, one of the largest hydraulic presses in the United States, is now operational in manual mode, and |
||
robots have now been installed to move the stampings between each individual press station. Two other press lines are already fully operational in automatic dry-run mode. In plastics, several of the injection molding machines are up and running and can already make sample parts in automatic mode. In paint, the primer robots have arrived and are being installed while the entire facility is being retrofitted for Model S.
Our Assembly shop is also beginning to receive equipment including automated guided vehicles, overhead assembly line equipment, alignment tables and final testing dynamometers. Our body shop and welding robots are undergoing initial validation and integration at a vendors facility where we can easily program and debug their operations. We are also nearing completion of our indoor assembly quality test track. This will allow us to quickly test each vehicle right next to the assembly line.
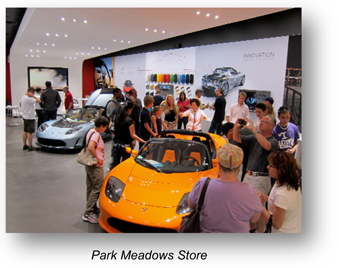
Compelling Customer Experiences
We launched our new, interactive retail strategy during the quarter, with store openings on Santana Row in San Jose, California, and in Park Meadows near Denver, Colorado. One of our goals with the new store concept is to educate future electric vehicle
|
|
buyers. The response to this new strategy has surpassed our expectations. The foot traffic at these stores, for example, continues to amaze us. Weekly foot traffic for Santana Row has settled in at double our initial expectations, at 5,000 to 6,000 visitors per week. Park Meadows is double the Santana Row traffic at 10,000 to 12,000 visitors per week.
Given the success of these stores, we plan to introduce this retail strategy into many of our most important markets. We plan to open a few more stores by year end, mostly in the United States. Some of these stores will be introduced in the same area as existing stores, in which case some of the old locations may be converted into service facilities. |
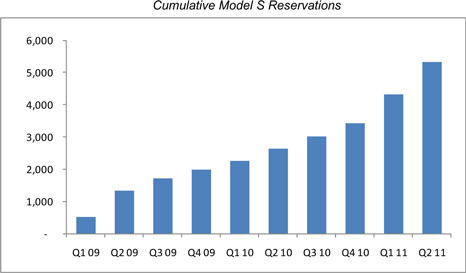
We continue to see strong reservations growth for Model S. At the end of June, we had over 5,300 reservations, and through July, this number has grown to over 5,600. The reservations rate has increased substantially in the last couple of quarters. These reservations require a minimum $5,000, refundable deposit, and thus far, we have undertaken minimal marketing activities focused on selling Model S.
| Solid Powertrain Execution
We executed well on our existing powertrain contracts during the second quarter. Both our production agreements with Daimler and our development services agreement with Toyota produced combined revenue of approximately $31 million in the period, the highest figure to date. Powertrain component related sales accounted for just over $11 million this quarter, as unit sales of the components for both the Smart fortwo and the A-Class were delivered according to Daimlers demand schedule. We expect to complete all deliveries to Daimler by the end of this year.
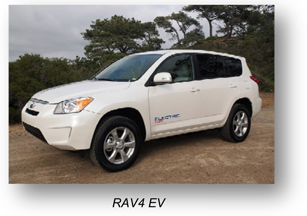
We continue to make excellent progress on the development of the RAV4 EV with Toyota. Once again, we met all of the |
|
|
| milestones planned for the quarter in the development contract for the RAV4 EVs full powertrain system. This drove record development services revenue of approximately $19 million for the second quarter. |
||
We expect that the RAV4 EV development program, and the associated development services revenues, will be completed by early 2012. Thereafter, as we have announced, we plan to begin shipping RAV4 EV production parts to Toyota. This multi-year contract, which we just recently signed, is for approximately $100 million. Under this contract, we plan to deliver the entire powertrain system to Toyota to install into the RAV4 EV. Toyota has announced that the RAV4 EV will be available in 2012. Further details on the RAV4 EV will be provided directly by Toyota in the coming weeks. It is exciting for us to participate with Toyota in the revival of the electric RAV4!
Strong Financial Performance & Improved Outlook
Given the strong demand we are seeing for our Tesla Roadsters and continued execution in our powertrain activities, we now project that full year revenue will be between $180-190 million, up from our prior guidance of $170-185 million. We expect that gross margin will continue to fluctuate based on the mix of automotive sales and development services revenue. Also, as we have indicated previously, timing differences between recognition of revenue and the underlying costs can cause the gross margin of development service contracts to vary from quarter to quarter.
Our operating expenses continue to reflect our investments in new vehicle development and the build-out of our infrastructure. Our total operating expenses were $77 million on a GAAP basis and $71 million on a non-GAAP basis, which excludes stock-based compensation expense. A full reconciliation between the non-GAAP and GAAP information is included at the end of this Shareholder Letter.
Almost two thirds of our operating expenses relate to our investments in research and development. This quarter, we had very significant R&D activities related to the validation and testing of the Alpha fleet, the start of the Beta build, and development work related to our manufacturing facility. The entire increase in our operating expenses was due to our growth in R&D spending, as our SG&A expenses remained flat for the second quarter in a row. We are continuing to keep a watchful eye on spending, as reflected in our flat SG&A expenses from the prior quarter.
R&D spending is expected to rise moderately from the Q2 level in the second half of 2011 as we continue with the engineering, and testing of Model S, prepare our manufacturing facility for production next year, accelerate the advanced engineering work on Model X, and pursue additional strategic projects. Capital expenditures increased as expected to about $54 million this quarter as we continued to build out our Fremont manufacturing facility and invest in tooling for the Model S components. We now anticipate capital expenditures for 2011 to be between $220 and $245 million, up from our previous guidance of $190 to $215 million, as we continue to execute on our various projects.
As we have indicated before, most of the spending for Model S and its manufacturing, including capital expenditures, are reimburseable under our $465 million loan facility with the United States Department of Energy (DoE).
In total, our net non-GAAP loss for the quarter was $52 million, or $0.53 per share. Our increased weighted average basic share count of 97.8 million shares reflects only one month of the incremental 8.1 million shares issued in our follow-on offering. We would therefore expect that our share count will be approximately 104 million next quarter when the 8.1 million shares get a full quarters weighting.
Sufficient Capital Resources for Model S and Model X
At the beginning of June, we successfully raised $231 million through a follow-on offering and concurrent private placements. This financing included a $41 million investment by our CEO, and $18 million investment from Blackstar, the investment arm of our strategic partner, Daimler AG. This quarter, we also drew down $32 million from our DoE loan facility.
This new capital increased our cash resources on hand to $331 million. Combining this cash with the additional $331 million we have left to draw on our loan facility with the DoE, we now have approximately $662 million in available capital resources. We believe that these funds will be sufficient to develop Model S and Model X, based on our current plans.
In Closing
We are exceptionally proud of the progress our teams continue to make throughout our business. Over 150 extraordinary people joined us during the quarter, bringing our total team to over 1,400. Were staying focused on delighting our customers by delivering vehicles and powertrains that are nothing less than exceptional.
Thanks for your interest in Tesla Motors.
Sincerely,
| /s/ Elon Musk |
/s/ Deepak Ahuja | |
| Elon Musk, Chairman, Product Architect and CEO | Deepak Ahuja, Chief Financial Officer |
Webcast Information
Tesla will provide a live webcast of its second quarter 2011 financial results conference call beginning at 2:30 p.m. PDT on August 3, 2011 at ir.teslamotors.com. This webcast will also be available for replay for approximately two weeks thereafter.
Forward-Looking Statements
Certain statements in this shareholder letter, including statements relating to the progress Tesla is making with respect to the development, testing, performance, attributes, schedule of development and launch, and volume expectations of Model S; the schedule, development, volume expectations and pricing of, and the ability of Tesla to leverage the Model S platform for, Model X; the ability to achieve revenue, gross margin and spending targets; the ability of Tesla to produce vehicles at the Tesla Factory in Fremont, California as well as the plans and schedule for the Tesla Factory and the equipment there; the schedules related to, and the financial results expected from,Teslas development programs with Daimler and Toyota; our ability to execute multiple product development programs simultaneously; the sufficiency of current available funds to develop Model S and Model X; and the ability of Tesla to execute on its new interactive retail strategy and future store opening plans are forward-looking statements that are subject to risks and uncertainties. These forward-looking statements are based on managements current expectations, and as a result of certain risks and uncertainties actual results may differ materially from those projected. The following important factors, without limitation, could cause actual results to differ materially from those in the forward-looking statements: Teslas future success depends on its ability to design and achieve market acceptance of new vehicle models, specifically Model S and Model X; the risk of delays in the design, manufacture, launch and financing of Model S, including the build-out of its planned Model S manufacturing facility; the risk of a decline in revenues prior to the launch of Model S; consumers willingness to adopt electric vehicles and electric cars in particular; Teslas ability to fully draw down on its facility from the U.S. Department of Energy; risks associated with the ability to achieve the expected financial results from the production of powertrain systems for the Toyota RAV4 EV; risks associated with sales and anticipated delivery schedule of the Tesla Roadster; competition in the automotive market generally and the alternative fuel vehicle market in particular; Teslas ability to establish, maintain and strengthen the Tesla brand; the unavailability, reduction or elimination of governmental and economic incentives for electric vehicles; Teslas ability to establish, maintain and strengthen its relationships with strategic partners such as Daimler, Toyota and Panasonic; and Teslas ability to execute on its plans for its new interactive retail strategy and for new store openings. More information on potential factors that could affect the Companys financial results is included from time to time in Teslas Securities and Exchange Commission filings and reports, including the risks identified under the section captioned Risk Factors in its annual report on Form 10-K filed on March 3, 2011 and its registration statement on Form S-1 filed on June 2, 2011. Tesla disclaims any obligation to update information contained in these forward-looking statements whether as a result of new information, future events, or otherwise.
Non-GAAP Financial Information
Consolidated financial information has been presented in accordance with GAAP as well as on a non-GAAP basis. On a non-GAAP basis, financial measures exclude non-cash items such as stock-based compensation as well as the change in fair value related to Teslas warrant liability. Management believes that it is useful to supplement its GAAP financial statements with this non-GAAP information because management uses such information internally for its operating, budgeting and financial planning purposes. These non-GAAP financial measures also facilitate managements internal comparisons to Teslas historical performance as well as comparisons to the operating results of other companies. In addition, Tesla believes these non-GAAP financial measures are useful to investors because they allow for greater transparency into the indicators used by management as a basis for its financial and operational decision making. Non-GAAP information is not prepared under a comprehensive set of accounting rules and therefore, should only be read in conjunction with financial information reported under U.S. GAAP when understanding Teslas operating performance. A reconciliation between GAAP and non-GAAP financial information is provided below.
| Investor Relations Contact: | Press Contact: | |||
| Jeff Evanson | Khobi Brooklyn | |||
| 650-681-5050 | Tesla Motors | |||
| ir@teslamotors.com | kbrooklyn@teslamotors.com |
For additional information, please visit ir.teslamotors.com.
Tesla Motors, Inc.
Condensed Consolidated Statements of Operations
(Unaudited)
(In thousands, except per share data)
| Three Months Ended | Six Months Ended | |||||||||||||||||||
| June 30, 2011 |
Mar 31, 2011 |
June 30, 2010 |
June 30, 2011 |
June 30, 2010 |
||||||||||||||||
| Revenues |
||||||||||||||||||||
| Automotive sales |
$ | 39,028 | $ | 33,628 | $ | 23,971 | $ | 72,656 | $ | 44,556 | ||||||||||
| Development services |
19,143 | 15,402 | 4,434 | 34,545 | 4,661 | |||||||||||||||
|
|
|
|
|
|
|
|
|
|
|
|||||||||||
| Total revenues |
58,171 | 49,030 | 28,405 | 107,201 | 49,217 | |||||||||||||||
|
|
|
|
|
|
|
|
|
|
|
|||||||||||
| Cost of revenues |
||||||||||||||||||||
| Automotive sales |
30,528 | 26,961 | 20,266 | 57,489 | 37,124 | |||||||||||||||
| Development services |
9,135 | 4,041 | 1,878 | 13,176 | 1,980 | |||||||||||||||
|
|
|
|
|
|
|
|
|
|
|
|||||||||||
| Total cost of revenues (1) |
39,663 | 31,002 | 22,144 | 70,665 | 39,104 | |||||||||||||||
|
|
|
|
|
|
|
|
|
|
|
|||||||||||
| Gross profit |
18,508 | 18,028 | 6,261 | 36,536 | 10,113 | |||||||||||||||
| Operating expenses |
||||||||||||||||||||
| Research and development (1) |
52,531 | 41,162 | 15,416 | 93,693 | 28,681 | |||||||||||||||
| Selling, general and administrative (1) |
24,716 | 24,212 | 22,207 | 48,928 | 38,792 | |||||||||||||||
|
|
|
|
|
|
|
|
|
|
|
|||||||||||
| Total operating expenses |
77,247 | 65,374 | 37,623 | 142,621 | 67,473 | |||||||||||||||
|
|
|
|
|
|
|
|
|
|
|
|||||||||||
| Loss from operations |
(58,739 | ) | (47,346 | ) | (31,362 | ) | (106,085 | ) | (57,360 | ) | ||||||||||
| Interest income |
46 | 40 | 47 | 86 | 95 | |||||||||||||||
| Interest expense |
| | (464 | ) | | (694 | ) | |||||||||||||
| Other expense, net |
(71 | ) | (1,485 | ) | (6,729 | ) | (1,556 | ) | (9,950 | ) | ||||||||||
|
|
|
|
|
|
|
|
|
|
|
|||||||||||
| Loss before income taxes |
(58,764 | ) | (48,791 | ) | (38,508 | ) | (107,555 | ) | (67,909 | ) | ||||||||||
| Provision for income taxes |
139 | 150 | 9 | 289 | 127 | |||||||||||||||
|
|
|
|
|
|
|
|
|
|
|
|||||||||||
| Net loss |
$ | (58,903 | ) | $ | (48,941 | ) | $ | (38,517 | ) | $ | (107,844 | ) | $ | (68,036 | ) | |||||
|
|
|
|
|
|
|
|
|
|
|
|||||||||||
| Net loss per common share, basic and diluted (2)(3) |
$ | (0.60 | ) | $ | (0.51 | ) | $ | (5.04 | ) | $ | (1.12 | ) | $ | (9.10 | ) | |||||
|
|
|
|
|
|
|
|
|
|
|
|||||||||||
| Shares used in per share calculation, basic and diluted (2)(3) |
97,757 | 95,187 | 7,643 | 96,478 | 7,474 | |||||||||||||||
|
|
|
|
|
|
|
|
|
|
|
|||||||||||
| Notes: | ||||||||||||||||||||
| (1) Includes stock-based compensation expense of the following for the periods presented: |
|
|||||||||||||||||||
| Cost of revenues |
$ | 181 | $ | 154 | $ | 36 | $ | 335 | $ | 78 | ||||||||||
| Research and development |
3,018 | 2,299 | 551 | 5,317 | 832 | |||||||||||||||
| Selling, general and administrative |
3,727 | 3,473 | 5,528 | 7,200 | 8,592 | |||||||||||||||
|
|
|
|
|
|
|
|
|
|
|
|||||||||||
| Total stock-based compensation expense |
$ | 6,926 | $ | 5,926 | $ | 6,115 | $ | 12,852 | $ | 9,502 | ||||||||||
|
|
|
|
|
|
|
|
|
|
|
|||||||||||
| (2) | On July 2, 2010, the Company completed its initial public offering (IPO), pursuant to which the Company sold 11,880,600 shares of common stock. Concurrent with the closing of the IPO, the Company issued 2,941,176 shares of common stock to Toyota Motor Corporation in a private placement. |
Upon the completion of the IPO, all convertible preferred stock automatically converted into 70,226,844 shares of common stock. Additionally, 445,047 shares of common stock were issued upon the net exercise of all outstanding warrants, excluding the Department of Energy warrant.
| (3) | On June 8, 2011, the Company completed its follow-on public offering, pursuant to which the Company sold 6,095,000 shares of common stock. Concurrent with the closing of the offering, the Company issued 1,416,000 shares of common stock to Elon Musk and 637,475 shares of common stock to an affiliate of Daimler AG in a private placement at the public offering price. |
Tesla Motors, Inc.
Condensed Consolidated Balance Sheets
(Unaudited)
(In thousands)
| June 30, | December 31, | |||||||
| 2011 | 2010 | |||||||
| Assets |
||||||||
| Cash and cash equivalents |
$ | 319,380 | $ | 99,558 | ||||
| Restricted cash - current |
11,251 | 73,597 | ||||||
| Accounts receivable |
23,308 | 6,710 | ||||||
| Inventory |
54,312 | 45,182 | ||||||
| Prepaid expenses and other current assets |
9,507 | 10,839 | ||||||
| Operating lease vehicles, net |
10,533 | 7,963 | ||||||
| Property and equipment, net |
189,647 | 114,636 | ||||||
| Restricted cash - noncurrent |
5,433 | 4,867 | ||||||
| Other assets |
22,784 | 22,730 | ||||||
|
|
|
|
|
|||||
| Total assets |
$ | 646,155 | $ | 386,082 | ||||
|
|
|
|
|
|||||
| Liabilities and Stockholders Equity |
||||||||
| Accounts payable and accrued liabilities |
$ | 82,192 | $ | 49,896 | ||||
| Deferred revenue |
6,295 | 7,418 | ||||||
| Reservation payments |
53,187 | 30,755 | ||||||
| Common stock warrant liability |
7,849 | 6,088 | ||||||
| Capital lease obligations |
646 | 775 | ||||||
| Long-term debt |
134,177 | 71,828 | ||||||
| Other long-term liabilities |
13,357 | 12,274 | ||||||
|
|
|
|
|
|||||
| Total liabilities |
297,703 | 179,034 | ||||||
| Stockholders equity |
348,452 | 207,048 | ||||||
|
|
|
|
|
|||||
| Total liabilities and stockholders equity |
$ | 646,155 | $ | 386,082 | ||||
|
|
|
|
|
|||||
Tesla Motors, Inc.
Supplemental Consolidated Financial Information
(Unaudited)
(In thousands)
| Three Months Ended | Six Months Ended | |||||||||||||||||||
| June 30, 2011 |
Mar 31, 2011 |
June 30, 2010 |
June 30, 2011 |
June 30, 2010 |
||||||||||||||||
| Selected Cash Flow Information |
||||||||||||||||||||
| Cash flows used in operating activities |
$ | 22,488 | $ | 43,297 | $ | 20,247 | $ | 65,785 | $ | 47,576 | ||||||||||
| Cash flows provided by (used in) investing activities |
(23,122 | ) | 10,111 | (7,689 | ) | (13,011 | ) | (17,068 | ) | |||||||||||
| Cash flows provided by financing activities |
264,335 | 34,283 | 13,694 | 298,618 | 42,321 | |||||||||||||||
| Other Selected Financial Information |
||||||||||||||||||||
| Capital expenditures |
$ | 54,314 | $ | 20,476 | $ | 9,815 | $ | 74,790 | $ | 15,287 | ||||||||||
| Depreciation and amortization |
4,317 | 3,517 | 2,483 | 7,835 | 4,624 | |||||||||||||||
| June 30, 2011 |
Mar 31, 2011 |
|||||||
| Cash |
||||||||
| Cash and cash equivalents |
$ | 319,380 | $ | 100,655 | ||||
| Restricted cash - current |
11,251 | 42,943 | ||||||
| Restricted cash - noncurrent |
5,433 | 4,934 | ||||||
Tesla Motors, Inc.
Reconciliation of GAAP to Non-GAAP Financial Information
(Unaudited)
(In thousands, except per share data)
| Three Months Ended | Six Months Ended | |||||||||||||||||||
| June 30, 2011 |
Mar 31, 2011 |
June 30, 2010 |
June 30, 2011 |
June 30, 2010 |
||||||||||||||||
| Research and development expenses (GAAP) |
$ | 52,531 | $ | 41,162 | $ | 15,416 | $ | 93,693 | $ | 28,681 | ||||||||||
| Stock-based compensation expense |
(3,018 | ) | (2,299 | ) | (551 | ) | (5,317 | ) | (832 | ) | ||||||||||
|
|
|
|
|
|
|
|
|
|
|
|||||||||||
| Research and development expenses (Non-GAAP) |
$ | 49,513 | $ | 38,863 | $ | 14,865 | $ | 88,376 | $ | 27,849 | ||||||||||
|
|
|
|
|
|
|
|
|
|
|
|||||||||||
| Selling, general and administrative expenses (GAAP) |
$ | 24,716 | $ | 24,212 | $ | 22,207 | $ | 48,928 | $ | 38,792 | ||||||||||
| Stock-based compensation expense |
(3,727 | ) | (3,473 | ) | (5,528 | ) | (7,200 | ) | (8,592 | ) | ||||||||||
|
|
|
|
|
|
|
|
|
|
|
|||||||||||
| Selling, general and administrative expenses (Non-GAAP) |
$ | 20,989 | $ | 20,739 | $ | 16,679 | $ | 41,728 | $ | 30,200 | ||||||||||
|
|
|
|
|
|
|
|
|
|
|
|||||||||||
| Net loss (GAAP) |
$ | (58,903 | ) | $ | (48,941 | ) | $ | (38,517 | ) | $ | (107,844 | ) | $ | (68,036 | ) | |||||
| Stock-based compensation expense |
6,926 | 5,926 | 6,115 | 12,852 | 9,502 | |||||||||||||||
| Change in fair value of warrant liabilities |
340 | 1,421 | 6,349 | 1,761 | 8,681 | |||||||||||||||
|
|
|
|
|
|
|
|
|
|
|
|||||||||||
| Net loss (Non-GAAP) |
$ | (51,637 | ) | $ | (41,594 | ) | $ | (26,053 | ) | $ | (93,231 | ) | $ | (49,853 | ) | |||||
|
|
|
|
|
|
|
|
|
|
|
|||||||||||
| Net loss per common share, basic and diluted (GAAP) |
$ | (0.60 | ) | $ | (0.51 | ) | $ | (5.04 | ) | $ | (1.12 | ) | $ | (9.10 | ) | |||||
| Stock-based compensation expense |
0.07 | 0.06 | 0.80 | 0.13 | 1.27 | |||||||||||||||
| Change in fair value of warrant liabilities |
0.00 | 0.01 | 0.83 | 0.02 | 1.16 | |||||||||||||||
|
|
|
|
|
|
|
|
|
|
|
|||||||||||
| Net loss per common share, basic and diluted (Non-GAAP) |
$ | (0.53 | ) | $ | (0.44 | ) | $ | (3.41 | ) | $ | (0.97 | ) | $ | (6.67 | ) | |||||
|
|
|
|
|
|
|
|
|
|
|
|||||||||||
| Shares used in per share calculation, basic and diluted (GAAP and Non-GAAP) |
97,757 | 95,187 | 7,643 | 96,478 | 7,474 | |||||||||||||||
|
|
|
|
|
|
|
|
|
|
|
|||||||||||
Non-GAAP Financial Information
Consolidated financial information has been presented in accordance with GAAP as well as on a non-GAAP basis. On a non-GAAP basis, financial measures exclude non-cash items such as stock-based compensation as well as the change in fair value related to Teslas warrant liabilities. Management believes that it is useful to supplement its GAAP financial statements with this non-GAAP information because management uses such information internally for its operating, budgeting and financial planning purposes. These non-GAAP financial measures also facilitate managements internal comparisons to Teslas historical performance as well as comparisons to the operating results of other companies. Non-GAAP information is not prepared under a comprehensive set of accounting rules and therefore, should only be read in conjunction with financial information reported under U.S. GAAP when understanding Teslas operating performance. A reconciliation between GAAP and non-GAAP financial information is provided above.