FleetMatics Group PLC 10-K 2014-12-31
Sign in or join
Add a note by highlighting text or Replying to an existing note.
Add a note by highlighting text or Replying to an existing note.
UNITED STATES
SECURITIES AND EXCHANGE COMMISSION
Washington, D.C. 20549
Form 10-K
| x | ANNUAL REPORT PURSUANT TO SECTION 13 OR 15(d) OF THE SECURITIES EXCHANGE ACT OF 1934 |
For the fiscal year ended: December 31, 2014
or
| ¨ | TRANSITION REPORT PURSUANT TO SECTION 13 OR 15(d) OF THE SECURITIES EXCHANGE ACT OF 1934 |
For the transition period from to .
Commission File Number 001-35678
FLEETMATICS GROUP PLC
(Exact Name of registrant as specified in its charter)
| Ireland | 27-3112485 | |
| (State or other jurisdiction of incorporation or organization) |
(I.R.S. Employer Identification Number) |
|
| Block C, Cookstown Court Belgard Road Tallaght Dublin 24 Ireland |
||
| (Address of principal executive offices) | ||
Registrants telephone number, including area code: +353 (1) 413 1250
Securities registered pursuant to Section 12(b) of the Act:
| Title of Each Class |
Name of Exchange on Which Registered |
|
| Ordinary Shares, 0.015 nominal value | New York Stock Exchange |
Securities to be registered pursuant to Section 12(g) of the Act:
None
Indicate by check mark if the registrant is a well-known seasoned issuer, as defined in Rule 405 of the Securities Act. Yes x No ¨
Indicate by check mark if the registrant is not required to file reports pursuant to Section 13 or Section 15(d) of the Act. Yes ¨ No x
Indicate by check mark whether the registrant (1) has filed all reports required to be filed by Section 13 or 15(d) of the Securities Exchange Act of 1934 during the preceding 12 months (or for such shorter period that the registrant was required to file such reports), and (2) has been subject to such filing requirements for the past 90 days. Yes x No ¨
Indicate by check mark whether the registrant has submitted electronically and posted on its corporate Web site, if any, every Interactive Data File required to be submitted and posted pursuant to Rule 405 of Regulation S-T (§ 232.405 of this chapter) during the preceding 12 months (or for such shorter period that the registrant was required to submit and post such files). Yes x No ¨
Indicate by check mark if disclosure of delinquent filers pursuant to Item 405 of Regulation S-K is not contained herein, and will not be contained, to the best of registrants knowledge, in definitive proxy or information statements incorporated by reference in Part III of this Form 10-K or any amendment to this Form 10-K. ¨
Indicate by check mark whether the registrant is a large accelerated filer, an accelerated filer, a non-accelerated filer or a smaller reporting company. See definition of accelerated filer and large accelerated filer and smaller reporting company in Rule 12b-2 of the Exchange Act (Check one):
| Large accelerated filer | x | Accelerated filer | ¨ | |||
| Non-accelerated filer | ¨ (Do not check if small reporting company) | Smaller reporting company | ¨ |
Indicate by check mark whether the registrant is a shell company (as defined in rule 12b-2 of the Exchange Act). Yes ¨ No x
The aggregate market value of the voting and non-voting stock held by non-affiliates of the registrant, as of June 30, 2014, was approximately $1.19 billion (based on the closing price of the registrants ordinary shares, 0.015 par value per share, on June 30, 2014, of $32.34 per share).
The number of shares outstanding of the registrants ordinary shares, 0.015 par value per share, as of January 30, 2015 was 37,897,383.
DOCUMENTS INCORPORATED BY REFERENCE
The registrant intends to file an amendment to this Annual Report on Form 10-K not later than 120 days after the close of the fiscal year ended December 31, 2014. Portions of such amendment are incorporated by reference into Part III of this Annual Report on Form 10-K.
ANNUAL REPORT ON FORM 10-K
YEAR ENDED DECEMBER 31, 2014
| Page No. |
||||||
| Part I |
|
|||||
| Item 1. |
3 | |||||
| Item 1A. |
17 | |||||
| Item 1B. |
37 | |||||
| Item 2. |
37 | |||||
| Item 3. |
37 | |||||
| Item 4. |
38 | |||||
| Part II |
||||||
| Item 5. |
39 | |||||
| Item 6. |
42 | |||||
| Item 7. |
Managements Discussion and Analysis of Financial Condition and Results of Operations |
45 | ||||
| Item 7A. |
70 | |||||
| Item 8. |
71 | |||||
| Item 9. |
Changes in and Disagreements with Accountants on Accounting and Financial Disclosure |
110 | ||||
| Item 9A. |
110 | |||||
| Item 9B. |
110 | |||||
| Part III |
||||||
| Item 10. |
111 | |||||
| Item 11. |
111 | |||||
| Item 12. |
Security Ownership of Certain Beneficial Owners and Management and Related Stockholder Matters |
111 | ||||
| Item 13. |
Certain Relationships and Related Transactions, and Director Independence |
111 | ||||
| Item 14. |
111 | |||||
| Part IV |
||||||
| Item 15. |
112 | |||||
| 113 | ||||||
2
PART I
Except for the historical information contained herein, the matters discussed in this Annual Report on Form 10-K are forward-looking statements within the meaning of Section 27A of the Securities Act of 1933, as amended, or the Securities Act and Section 21E of the Securities Exchange Act of 1934, as amended, or the Exchange Act. These forward-looking statements involve risks and uncertainties. Fleetmatics makes such forward-looking statements under the provision of the Safe Harbor section of the Private Securities Litigation Reform Act of 1995. Any forward-looking statements should be considered in light of the factors described below in Item 1A Risk Factors. Actual results may vary materially from those projected, anticipated or indicated in any forward-looking statements. In this Annual Report on Form 10-K, the words anticipates, believes, expects, intends, future, could, and similar words or expressions (as well as other words or expressions referencing future events, conditions or circumstances) identify forward-looking statements. Unless the context otherwise requires, all references to Fleetmatics, we, our, us, our company, the Company or the Corporation in this Annual Report on Form 10-K refer to Fleetmatics Group PLC and its subsidiaries.
| Item 1. | Business |
Fleetmatics is a leading global provider of fleet management solutions delivered as software-as-a-service, or SaaS. Our mobile software platform enables businesses to meet the challenges associated with managing their local fleets of commercial vehicles and improve productivity by extracting actionable business intelligence from real-time and historical vehicle and driver behavioral data. We offer intuitive, cost-effective Web-based and mobile application solutions that provide fleet operators with visibility into vehicle location, fuel usage, speed and mileage and other insights into their mobile workforce, enabling them to reduce operating and capital costs, as well as increase revenue. Our integrated, full-featured mobile workforce management application provides additional efficiencies related to job management by empowering the field worker and expediting the job completion process from quote through payment. As of December 31, 2014, we had approximately 25,000 customers who collectively deployed our solutions in approximately 552,000 vehicles worldwide. The substantial majority of our customers are small and medium-sized businesses, or SMBs, each of which deploys our solutions in 500 or fewer vehicles. During the year ended December 31, 2014, we collected an average of approximately 62 million data points per day from subscribers and have aggregated over 74 billion data points since our inception, which we believe provides a valuable data set that we may consider in the development of complementary business intelligence solutions and additional sources of revenue.
In April 2014, Fleetmatics announced the release of its new software platform and the launch of the three new product offerings with new and, in some cases, patented features: Fleetmatics REVEAL, a business-intelligence based fleet management solution for SMBs; Fleetmatics REVEAL+, which extends Fleetmatics REVEAL to larger enterprises and is configurable to customers requiring integration capabilities with third-party workflow solutions; and Fleetmatics WORK, a field service management solution. The new software platform is an analytics-based, extensible foundation to deliver solutions, features, insights and applications that optimize how a mobile workforce gets work done and how a business manages its mobile assets. The three product offerings that fall under the software platform offer a solution for service fleet and field service management designed to help businesses maximize their return on fleet and mobile workforce investments.
In August 2013, Fleetmatics acquired Sydney, Australia-based, Connect2Field Holdings Pty Limited (Connect2Field), a privately-held provider of cloud-based software solutions for service businesses and their mobile workers. The Connect2Field product became the foundation of Fleetmatics WORK. The acquisition of Connect2Field supported our ability to execute on our vision of enabling field service businesses globally to leverage the prevalence of wireless data and mobile devices and giving them tools they need to automate, manage, simplify and improve their operations. We believe that our field service management solution, particularly among SMBs where they are replacing manual processes that are often prone to inefficiency and errors, will help our customers improve customer service levels, increase mobile productivity and enhance savings.
3
In May 2014, Fleetmatics acquired Florence, Italy-based KKT Srl (KKT), the privately-held developer of Routist, a SaaS-based, intelligent vehicle routing solution for businesses looking to optimize the utilization of their fleets and mobile resources. Via its sophisticated algorithms, Routist provides optimized route plans for vehicles making multiple stops daily, and provides opportunities for companies to achieve significant cost savings by helping to reduce miles driven, fuel consumption, and vehicle maintenance costs. Routists complex and flexible optimization engine is able to take into consideration locations, vehicles, time windows, technician skills, costs and capacities, among other inputs, while remaining simple and intuitive for customers to use.
Many SMBs manage their local fleets by using manual processes, such as entering data on time sheets and communicating with mobile employees using cellular phones, which generate minimal actionable business intelligence. Furthermore, existing technology-based solutions, including long haul-focused solutions, can be cost-prohibitive and difficult for SMBs to implement and use. Our multi-tenant SaaS solutions are designed to meet the needs of SMBs, overcome existing barriers to adoption, and leverage the volumes of data transmitted to us from in-vehicle devices over cellular networks that we aggregate and analyze from our large and growing subscriber base. By using our solutions to extract actionable business intelligence from the data on their fleet and mobile workforce, fleet operators gain greater control over fuel, maintenance, labor and other costs while improving the return on capital invested in their fleet.
We have developed a differentiated, cost-effective customer acquisition sales model based on leads sourced through both Web-based digital advertising, such as search engine marketing and optimization, email marketing and our websites, and targeted outbound sales efforts. We design our Web-based marketing programs to drive visitors to our direct Web and field sales forces that use disciplined processes to qualify and convert these leads into paying customers. New fleet management customers typically enter into initial 36-month subscription agreements with monthly billing and new field service management customers typically enter into initial 12-month subscription agreements with monthly billing, providing us with a high degree of visibility into future revenue.
We have grown our customer base, the number of vehicles using our solutions and our revenue in each year since our incorporation in 2004. The following chart shows the aggregate number of vehicles under subscription for our fleet management solution as of December 31 for each of the years presented:
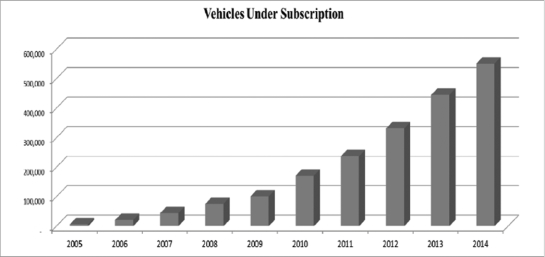
The chart above includes the number of vehicles under subscription with our subsidiary SageQuest LLC, or SageQuest, since our acquisition of SageQuest in July 2010.
Our subscription revenue in 2014 grew 30.6% to $231.6 million compared to $177.4 million in 2013, an increase of 39.2% compared to $127.5 million in 2012. We reported net income in 2014 of $27.5 million
4
compared to $30.5 million in 2013 and $5.4 million in 2012. Our Adjusted EBITDA in 2014 grew 30.9% to $73.9 million compared to $56.5 million in 2013, an increase of 66.7% from $33.9 million in 2012.(1)
| (1) | Adjusted EBITDA is a non-GAAP financial measure. For a definition of Adjusted EBITDA, an explanation of our managements use of this measure and a reconciliation of our Adjusted EBITDA to our net income (loss), see Item 6Selected Financial Data. |
Our Solutions
Fleet Management
Our SaaS fleet management solution enables businesses to meet the challenges associated with managing their local fleets by extracting actionable business intelligence from vehicle and driver behavioral data. Our highly scalable multi-tenant architecture leverages Global Positioning Satellite, or GPS, data transmitted from in-vehicle devices over cellular networks. Customers remotely access business intelligence reports through our intuitive interface using a standard Web browser or mobile application.
Field Service Management
Our SaaS field service management solutions enable owners to easily organize their business, improve time management, and simplify the backend processes. Customer information, invoices, inventory and service history are stored in the cloud, enabling our customers to automate their back office activities and reduce the amount of paperwork needed to run their business at an additional price. This offering is typically sold to small and medium-sized fleets both as a standalone offering as well as and interfaced with our fleet management solution.
Customers that purchase both our fleet management solution and our field service management solution can benefit from additional capabilities enabling improved dispatch decisions and greater clarity into workforce productivity. Fleetmatics WORK connects work orders to historical vehicle activity, providing additional reports and dashboard metrics, improved accuracy and visibility into work order arrival time, actual on site time and more.
We believe that our fleet and field service management solutions benefit customers in the following ways:
Reduced operating costs. Our solutions help businesses reduce operating costs by automating fleet tracking and optimizing related processes. Businesses that use our solutions can monitor and manage route efficiency and reduce idle time, resulting in lower fuel costs and labor expenses, such as overtime pay. In addition, our software helps companies to monitor vehicle speeds, identify unauthorized usage, minimize fleet wear and tear as well as the likelihood of fines, and increase the prospects of recovering stolen vehicles.
Increased worker productivity and revenues. Our solutions enable our customers to enhance worker productivity by minimizing wasted time on and traveling to job sites, detecting extended breaks and unauthorized detours, and provide our customers with the ability to better align compensation with productivity. Additionally, our monitoring and reporting capabilities shorten customer response times by facilitating the deployment of the nearest, most appropriate vehicle to a location, thereby improving customer service.
Designed for SMBs. Our Fleetmatics-branded products are competitively priced solutions designed to meet the needs of SMB fleet operators. Our solutions are easily and quickly implemented with the assistance of our large network of third-party installers, which generally allows businesses to begin using our solutions shortly after entering into a service contract. Our software is Web-based and can be accessed and used on mobile applications. Additionally, our solutions feature an intuitive graphical user interface with analytical dashboards, reports and alerts designed specifically for SMB fleet operators, which allows them to use the product without significant training or dedicated staff.
A robust platform for data aggregation. We aggregate data that is generated from the use of our solutions with data provided through partnerships, integration with third-party products, commercial or publicly available
5
sources, and from our customers. This capability provides us with an opportunity to recognize trends and provide insights that complement our core product reports, such as long-term trending and driver scoring statistics, to help our customers optimize the performance of their fleet.
Highly scalable, reliable and cost-effective SaaS platform. We utilize a SaaS delivery model, which lowers operators costs by eliminating their need to own and support software or associated technology infrastructure. We have built our solutions to scale and support geographically-distributed fleets of any size as they grow. We support our solutions with redundant servers and other infrastructure in three principal data centers in the United States and Europe, providing global reach and security. Our data centers maintained over 99.9% system uptime during the year ended December 31, 2014. Our fleet management solutions can be deployed, maintained and used without significant hardware costs, dedicated information technology personnel and infrastructure.
Ability to integrate third-party products and services. Our software architecture facilitates integration with third-party applications and services such as fuel cards, mapping and work order integration solutions and other value-added software and services. This enables fleet operators of any size to leverage our solutions across their existing software platforms and gain access to a broader spectrum of fleet management tools that we offer including enhanced reporting for fleet operators and other efficiency tools for drivers.
Device and network agnostic. Our fleet management solutions can be accessed over personal computers, tablets or smart phones, providing our customers with significant flexibility in how they access the business insights we provide. Our solutions are hardware and network agnosticwe can collect and analyze large volumes of complex vehicle and behavior data irrespective of the hardware generating the data or the cellular network over which the data is transmitted.
Our Key Competitive Strengths
We believe that the following competitive strengths differentiate us from our competitors and are key to our success:
Efficient and scalable customer acquisition model. We have developed a scalable sales and marketing model that is focused on the efficient generation of a large number of customer leads, primarily through digital advertising, such as search engine marketing and optimization and email marketing as well as targeted outbound sales efforts. These techniques provide us with a flow of low-cost, qualified leads, both in the U.S. and internationally. Our sales and marketing team uses disciplined processes to convert these leads into paying subscribers. In particular, our Web sales team has historically increased our overall sales productivity while lowering the aggregate cost of customer acquisition by focusing on sales to customers using phone and live Web demonstrations rather than traditional in-person meetings. We believe our marketing approach provides us with a cost-efficient and highly effective means of targeting and accessing the vast and geographically diverse SMB market and converting leads into paying subscribers.
Business intelligence approach to fleet management. Our approach to fleet management is based on our proprietary business intelligence software that enables our customers to analyze large volumes of complex vehicle and driver behavioral data by accessing dozens of pre-built reports online through an intuitive dashboard. Our technology platform enables users to consolidate large, disparate data sets and identify relationships and long-term historical trends within data through proactive prompts or when requested by the user. We believe that our solutions provide our customers with insights that help them make more informed and timely business decisions.
Software-as-a-Service model. Our SaaS-based solutions are offered through a subscription over the Internet and use a multi-tenant architecture, which enables us to run a single instance of our software code, add subscribers with minimal incremental expense and deploy new applications and upgrades quickly and efficiently. Our SaaS model is particularly well suited for SMBs, which typically lack the personnel qualified to support on-premises deployments and generally wish to avoid large up-front software and hardware expenditures. Initial
6
subscription agreements are typically 36 months in duration for fleet management customers and 12 months in duration for field service management customers, providing significant revenue visibility to us.
Deep domain expertise. From inception, we have focused on small and medium-sized fleet markets. This focus enables us to understand the specific needs of SMB fleet operators as they evolve. We possess significant experience and expertise in fleet management solutions, which enable us to develop, implement and sell SaaS solutions purpose-built for our existing and prospective customers.
Large and growing ecosystem of fleets and vehicles. As of December 31, 2014, we had approximately 25,000 customers who deployed our solutions in approximately 552,000 vehicles worldwide. In addition, our customers generated billions of data points in 2014. This vast amount of data not only provides valuable information for our business intelligence offerings, but also provides us with opportunities for increased revenue. We also believe that the data that we collect and analyze represents a significant, rapidly-growing and valuable asset, which we can use to generate industry-specific benchmarking statistics. For example, we organize and aggregate this data, render it anonymous and sell it to traffic reporting vendors. Our large deployment footprint also provides us with an audience to whom we can market and sell incremental solutions, such as integration with fuel cards and GPS navigation devices, or third-party complementary products and services. Our established customer base also contributes to our brand recognition and economies of scale.
Our Offerings
We offer fleet management and field service management software solutions that our customers use to gain visibility into their fleet and mobile workforce. Our fleet management and field service management solutions are purpose-built to meet the needs of SMB customers using a multi-tenant architecture that we host in third-party data centers. Our solutions are accessed through a Web browser or mobile application and provide our customers with actionable business intelligence.
Our fleet management offering consists of the following easy-to-use components:
Tracking Alerts. Our Fleet Tracking Alerts allow fleet operators to set driver performance thresholds and receive email notifications when unwanted driving behavior occurs. Notifications are sent when a vehicle enters or exits specified areas, moves during specified times, or when a vehicles speed or idle time exceeds specified thresholds.
Route Replay. Our Route Replay feature allows customers to play back each journey taken by their vehicles, from start up to shut down and provides customers with minute-by-minute location and speed details. Fleet operators can start, stop, pause, and change the speed of the journey replay using intuitive playback controls to monitor and analyze driver behavior. Integration with Google Maps enables customers to pinpoint vehicle location with satellite, street views and zooming capabilities.
Timeline View. Our Timeline View is a visual, interactive representation of vehicle activity enabling customers to easily consume vehicle and driver activity information without investing time in reading detail-intensive reports. Customers can scan activity for multiple vehicles at a time, quickly revealing exceptions such as late starts, early finishes, long idles or long stops and drill directly down to the incident details. The level of interactivity and drill down capabilities of this feature sets a new standard for the industry.
Places. Our Places feature allows customers to easily designate geofences, or areas on the map, in which vehicles are allowed or not allowed to travel. Fleet operators receive notifications when a vehicle enters or exits an unauthorized location and reports are generated detailing time spent in unauthorized areas. These geofences are an important building block of any vehicle tracking solution, making the location data more relevant and useful to a customer. However, traditionally many customers do not invest the time to create geofences or, if they do, they often draw the geofence incorrectly, losing visibility into important activity. Fleetmatics makes it easy by automatically creating and categorizing geofences and then, through a patented hot spot algorithm, suggest corrections to geofences based on customer driving activity, a unique and powerful industry first.
7
FleetTracking Dashboard. Our FleetTracking Dashboard provides fleet operators with a convenient way to monitor overall fleet performance through an intuitive graphical summary. This interface allows fleet operators to evaluate performance categories across their fleet, including average speed, engine on-time, vehicle idling, vehicle mileage and number of stops. Fleet operators can also view individual vehicle performance.
Fleet Reports. We provide our customers with dozens of pre-built on-demand reports that they can easily access to analyze fleet data. Our reports contain detailed information about vehicle movement and use, including vehicle location, ignition on and off time, engine idle time, arrival and departure times, distance traveled, hours worked, and vehicle speed. Additionally, customers can set acceptable threshold limits for these performance metrics and have reports generated that detail exceptions. Reports can be run at any time or be scheduled to run automatically with the results emailed to any number of recipients on a daily or weekly basis.
Mobile App. Our Mobile App is a full-featured, portable software application that fleet operators can use to access current actionable business intelligence and insights over mobile devices. It includes the FleetTracking Dashboard, Reports, Tracking Alerts, Route Replay, and Places.
Speed Limits. Most GPS vehicle tracking solutions limit visibility into speeding on only interstates and highways. With our Speed Limits feature, we provide a comprehensive source of speed limit information across all types of roads and geographies, including local and residential roads. Speed Limits is powered by Fleetmatics RoadSpeed, a specialized database of average speed values derived from billions of points of vehicle movement.
Panoramic Reporting and Benchmarking. Our panoramic reporting engine features in-depth historical trending analyses and strategic comparative information from the customers, such as driver and organizational performance benchmarking. Many of our customers want the perspective of knowing how their fleet should be performing when compared to those of similar businesses, industries and locations. Our industry benchmarking feature provides that analysis for the users individual needs, providing deep insight into each vehicles performance and identifying impactful opportunities for improvement. We believe we have one of the largest subscriber bases in the vehicle tracking industry and billions of position points received and that we are in a strong position to provide industry benchmarks with high credibility and relevance at a local level.
Driver-Centricity. One of a fleets biggest opportunities to drive savings and productivity comes from coaching their workforce and changing driver behavior. As drivers change vehicles, however, reporting becomes incomplete or inaccurate, and capturing which driver is assigned to a vehicle using a key fob or card swipe is not sufficient to solve the problem. Our solution provides comprehensive flexibility to organize business intelligence by either the vehicle or the driver.
Money-based Metrics. Activity metrics such as mileage or hours fall short of demonstrating the true impact that activity in the field has on the bottom line for a fleet or mobile workforce. Our solution translates performance data into operational costs measured in currency that make opportunities to drive savings easy to see.
We also offer the following additional features for our fleet management customers at an additional cost:
Fuel Card Reporting Integration. Our Fuel Card Reporting Integration feature integrates customers current fuel card usage information into our fleet management software platform. It provides our customers with an on-demand fuel usage summary for an entire fleet as well as detailed information on individual vehicles. Reports are generated that compare fuel purchases with vehicle location data.
Fleetmatics Fuel Card. As an expansion of Fuel Card Reporting, we have partnered with a leading independent global fleet card provider to deliver a Universal Platinum MasterCard. This partnership delivers flexible billing and payment options, personal assistance and training to establish controls and optimize savings, and strong and customizable purchasing controls.
8
Navigation Unit Integration. Our Navigation Unit Integration feature, currently with Garmin GPS navigation devices, streamlines dispatching and communication by integrating our fleet management software with our customers GPS navigation devices. It provides customers with turn-by-turn directions, notification of job status, estimated time of arrival to the next job site, and easy-to-use messaging capabilities. Drivers receive automatic job updates, eliminating the need to manually enter addresses while driving.
All of these components are fully integrated into our SaaS solutions.
Our field service management offering consists of the following easy-to-use components:
Dashboard. Our Dashboard provides our customers with a real time snapshot of what is happening at any moment in their field service business including number of jobs per field worker and number of jobs per month.
Client Management. Our Client Management enables our customers to easily view customer details, including notes, documents, images and phone calls in one location.
Dispatch. Dispatch enables our customer to instantly dispatch vehicles to a job in the field. Using Short Message Service, or SMS, email or push notifications, Dispatch sends work orders to field teams quickly and accurately.
Fleet Scheduling. Our fleet scheduling software enables our customers to see availability and schedule open slots in a simple calendar format.
Invoicing. Invoicing enables our customers to invoice their clients directly from Fleetmatics WORK while also recording payments directly. Fleetmatics WORK enables our customers to customize invoices, charge appropriate varying rates, and better manage their billing process.
Integration with Accounting Packages. Fleetmatics WORK integrates seamlessly into a number of accounting packages including QuickBooks, Saasu, MYOB and Xero. Our customers can also download invoices directly into their accounting system and allow their employees to create invoices without giving them full access.
Quoting. Quoting enables our customers to simply and easily create quotes for their customers.
Alerting. Alerting enables our customers to receive alerts via a mobile device as well as send updates to the office from the jobsite. Alerts can be sent to fieldworkers either as SMS, email or push notifications.
Marketing and Sales
Marketing
Our marketing programs target owners and managers in the service and distribution industries that operate fleets of commercial vehicles and/or manage a team of field technicians. Our marketing strategy is focused on building brand awareness, generating quality leads and reinforcing customer engagement and thought leadership.
Lead generation is a core function of our business processes. We generate leads through a combination of Web-driven inbound activities and traditional outbound marketing activities.
Inbound leads. Our inbound leads are largely generated through Web-based marketing efforts. This involves extensive search engine marketing, search engine optimization, digital advertising, email marketing, direct Web traffic and programs with digital media companies.
Our demand generation programs vary depending on our target industry or fleet size, and include marketing activities, such as integrated programs on the Web, outbound marketing campaigns targeted to prospects in key
9
industries and geographies, attendance and sponsorship of trade shows, email lead generation and prospect follow-up and traditional public relations and website properties. We make use of social media to engage customers and prospects to generate interest, demand and leads.
Outbound leads. We accumulate marketing lists, or outbound leads, through a variety of sources, including purchased lists selected by industry and geographic demographics. We filter prospects by using industry group and vertical market benchmarks to identify quality targets. Additionally, we utilize research techniques and analytic lead scoring models to identify those outbound leads that we believe have the greatest likelihood for us to convert to a sales presentation and a subscription.
Sales
We sell our subscriptions to our fleet management and mobile workforce solutions through our direct sales organization. Maintaining direct control of our sales force allows us to efficiently target SMBs with a local fleet or a team of field technicians. We have direct sales operations in the U.S. as well as internationally in the United Kingdom, Ireland, Australia, and the Netherlands.
The focus of our sales efforts is to drive a high volume of transactions through a standardized and highly repeatable methodology. We focus on the core challenges that operators face in managing their fleet or team of field technicians. We are able to provide our prospects with an anticipated return on investment, or ROI, calculation that enables us to tangibly demonstrate the benefits of our solutions and how they address the challenges that our prospects face. We highlight the insights that managers gain from our reports and alerts and how they can use those insights to improve productivity, increase operating profits and solve key business problems.
We effectively sell our Fleetmatics REVEAL+ solution to large enterprise customers because this solution satisfies their administrative, mapping and integration requirements. We have dedicated sales and marketing teams for our Fleetmatics REVEAL, REVEAL+ and WORK products that utilize the following sales channels, depending on our customers needs and fleet sizes:
Web sales. Our primary sales channel and a key component of our go-to-market strategy, the Web sales team has historically increased its sales productivity while lowering the aggregate cost of customer acquisition. The Web sales team conducts its selling activities over the phone using live Web demonstrations to convert sales leads to customers.
Field sales. Our field sales team meets face-to-face with prospects and focuses on sales to customers with larger fleet sizes. A team of inside telesales representatives supports this field sales team.
Existing customer account sales. We have a sales team dedicated exclusively to existing accounts that focus on up-selling and cross-selling additional products to our customer base, such as Fleetmatics WORK, securing renewal agreements, and promoting our customer referral program. This team is also focused on assisting customers that are adding units through fleet expansion or broader use of additional features across their fleet. This team monitors customer usage to ensure that our customers are deriving the maximum benefit from our offering.
Technology, Operations, and Development
Technology
We designed our SaaS solutions architecture so that our customers may access them via a Web browser or mobile application. Updates to our solutions are distributed instantaneously to all of our customers over the Web. Our solutions have been specifically built to deliver:
| | a consistent, intuitive end-user experience to limit the need for training and to encourage high levels of end-user adoption and engagement; |
10
| | turnkey, out-of-the-box functionality; |
| | flexibility to design customized reports and alerts that enable our clients to gain insights into their existing fleet and mobile assets; |
| | integration with other systems such as fuel cards, GPS navigation devices, and customer information technology systems, such as work order management and enterprise resource management systems; |
| | scalability to match the needs of our growing customer base and their fleets; and |
| | rigorous security standards and high levels of system performance and availability demanded by our customers. |
Our fleet management system is comprised of an in-vehicle device that incorporates off-the-shelf components, including a cellular modem, GPS receiver and memory capacity sufficient to run our proprietary firmware, which reports vehicle coordinates, time, speed, ignition status, and mileage from satellite readings. This information is collected at a predefined frequency (generally every 30-90 seconds) and then sent to our receivers at third-party data centers, via a commercial cellular network. The information is then processed and delivered to our customers providing a wide range of live reporting, mapping and alerts designed to give customers business intelligence. This information can be accessed by our customers via a Web browser or mobile application as well as be sent to customers by email, an Extensible Markup Language, or XML, feed or Web services.
Our SaaS solutions are deployed using a multi-tenant architecture that scales rapidly to support additional new subscribers through the addition of incremental commodity processing and storage hardware. This architecture flexibility allows us to sustain high levels of uptime without degradation of system performance despite significant subscriber growth. Our existing architecture and infrastructure has been designed with sufficient capacity to meet our current and anticipated future needs.
We are standardized on Microsoft .NET frameworks and write the majority of our software in industry-standard software programming languages, such as C#. We use technologies, such as AJAX, extensively to enhance the usability, performance, and overall user experience of our solutions. Microsoft SQL Server software is deployed for our relational database management system. Apart from these and other third-party industry standard technologies, our fleet management solutions have been specifically built and upgraded by our in-house development team.
In 2014, we collected an average of approximately 62 million data points per day. Since our inception, we have aggregated over 74 billion data points. We analyze, cleanse and mine customer-specific data to deliver business intelligence upon which our customers can base business decisions. We also use this information to provide our customers with long-term trending, driver scoring and industry-wide competitive benchmarking.
Operations
We physically host our SaaS solutions for our customers principally in three secure third-party data centers, in Solon, Ohio, Denver, Colorado, and Dublin, Ireland. These data management facilities provide us with both physical security, including manned security 365 days a year, 24 hours a day, seven days a week, biometric access controls and systems security, including firewalls, encryption, redundant power and environmental controls. Our data centers maintained over 99.9% system uptime in 2014. We believe that our third-party hosting facilities are adequate for our current needs and that suitable additional capacity will be available as needed to accommodate planned expansion of our operations. We believe our agreements with these third-party data centers are generally consistent with competitive market terms and conditions.
Our infrastructure includes firewalls, switches, routers, load balancers, IDS/IPS and application firewalls from top-tier suppliers to serve as the networking infrastructure and high levels of security for the environment. We use rack-mounted servers to run our solutions and for content caching. We use storage area network, or SAN,
11
hardware with fibre channel and solid-state drives at our data center locations. These SAN systems have been architected for high performance and data-loss protection, and we believe that these systems have the capacity and scalability to support our anticipated growth for the foreseeable future.
We leverage our third-party network of approximately 850 installers worldwide to install our in-vehicle devices. Upon contracting with a new customer, we dispatch the nearest installer to the customers place of business or a central location for installation of our in-vehicle devices. Typically, the full installation cycle is accomplished within 15 days from the date of contract. If an in-vehicle device malfunctions in the field, we also call on our installer network to replace the device.
Customers and Support
We sell our solutions to three different customer groups: SMBs which we define as operators of fleets of less than 75; mid-major which we define as operators of fleets between 75 and 500; and enterprise which we define as operators of fleets greater than 500. As of December 31, 2014, we served a large and diverse group of approximately 25,000 customers with an aggregate of approximately 552,000 vehicles under subscription. We serve a wide range of customers in the service and delivery industries, including plumbing, heating, construction, engineering services, transportation, electrical and various other services. Approximately two-thirds of our U.S. customers vehicles travel fewer than 200 miles per day and nearly 90% operate within a 50 mile radius each day. In addition, we have found that our solutions, particularly when integrated with work order management systems, provide value to larger field service organizations, including in the cable and telecommunications industries. For example, we count the regional service organizations for many cable and telecommunication companies as customers. In 2014 and 2013, our largest customer accounted for approximately 5% and 4%, respectively, of our subscription revenue and our top 25 customers represented approximately 14% and 13%, respectively, of our subscription revenue. We measure customer satisfaction on an annual basis by surveying our customers. Based on these surveys, we believe that our overall customer satisfaction is strong.
We provide customer support as part of our subscription. Our internal teams are proactive and contact our customers by phone to help them utilize additional features of our solutions and answer questions. Additional assistance is available via phone, chat or email.
Research and Development
The responsibilities of our research and development organization include product management, product development, quality assurance and technology operations. Our research and development expenses were $17.1 million in 2014, $11.0 million in 2013, and $7.4 million in 2012. Our primary research and development organization is based in Dublin, Ireland. We also have research and development operations in Solon, Ohio and Florence, Italy. Based on feedback from our clients and prospects, we work to develop new functionality while enhancing and maintaining our core offering.
Intellectual Property
Our intellectual property rights are important to our business. We rely on a combination of copyright, trade secret, trademark, patent, and other rights in the United States and other jurisdictions, as well as confidentiality procedures and contractual provisions to protect our proprietary technology, processes and other intellectual property.
We own four U.S. patents and five foreign national patents (one of each in Ireland, U.K., Germany, France, and the Netherlands).
| | U.S. Patent No. 7,388,518 (the 518 Patent) and the five foreign national patents belong to the same patent family and are directed to vehicle tracking systems central host. The 518 Patent expires on December 13, 2016. All five foreign national patents expire on May 9, 2026. |
12
| | U.S. Patent No. 8,751,163 (the 163 Patent) is directed to a computer systems, methods and computer program products for providing an electronic representation of a route. The 163 Patent expires on September 9, 2031. |
| | U.S. Patent No. 8,918,243 (the 243 Patent) is directed to a computer system and method for storing and processing GPS data for a plurality of vehicles to provide speed reports and alerts for fleets of vehicles, including alerts for speed data. The 243 Patent expires on November 17, 2032. |
| | U.S. Patent No. 8,626,419 (the 419 Patent) is directed to a system and method for processing GPS event data to identify frequent stop locations. The 419 Patent expires on April 27, 2032. |
We also own nine pending U.S. utility patent applications; nine international applications filed under the Patent Cooperation Treaty, i.e., PCT applications; and seven European patent applications (EP applications). Our patenting activities in the past four years are as follows.
In 2011, we filed three U.S. nonprovisional patent applications. One application was issued as the 163 Patent, described above. Two applications are pending. One pending application is directed to systems and methods for vehicle tracking using GPS data. The other pending application is directed to providing electronic representations of vehicle routes for a fleet. In 2012, we filed three corresponding EP applications based on the three U.S. applications. All three EP applications are currently pending.
In 2012, we filed four U.S. nonprovisional patent applications. Two applications were issued as the 243 Patent and the 419 Patent, described above. One application was abandoned. One application is pending and is directed to a computer system and method for peer comparison of vehicles and vehicle fleets. In 2012 and 2013, we filed three corresponding EP applications. All three EP applications are currently pending.
In 2013, we filed six U.S. nonprovisional patent applications. One application is directed to a system and method for managing fleet workflow. One application is directed to managing driver timekeeping. Four applications are directed to a system and method for proprietary fleet management technology. In 2013, we also filed two corresponding EP applications and two PCT applications.
In 2014, we filed four corresponding PCT applications based on the four U.S. nonprovisional applications that are directed to systems and methods for proprietary fleet management technology.
We have fifteen trademark applications/registrations in the United States, one trademark registration in the U.K., eleven trademark registrations in Ireland, two trademark registrations in Australia, three trademark registrations in Mexico, and eleven trademark applications/registrations in the European Community. These trademark applications/registrations relate to Fleetmatics and SageQuests products and services, names, and logos.
We also license technology from third parties. We believe our license agreements for third-party software and other intellectual property are generally consistent with industry standard terms and conditions. See Risk FactorsRisks Related to our BusinessWe rely on third-party software and other intellectual property to develop and provide our solutions and significant increases in licensing costs or defects in third-party software could harm our business.
Although the protection afforded by copyright, trade secret, trademark and patent law, written agreements and common law may provide some advantages, we believe that the following factors help us to maintain a competitive advantage:
| | the technological skills of our research and development personnel; |
| | frequent enhancements to our solutions; and |
| | continued expansion of our proprietary technology. |
13
We generally enter into confidentiality and other written agreements with our employees, consultants and partners, and through these and other written agreements, we attempt to control access to and distribution of our software, documentation and other proprietary technology and other information.
Competition
We compete with point-to-point solution providers as well as other companies with service offerings designed to address similar needs as our solutions. The market for fleet management solutions is highly fragmented. Some of our actual and potential competitors may enjoy competitive advantages over us, such as greater name recognition, longer operating histories, more varied services, and larger marketing budgets, as well as greater financial, technical, and other resources.
We believe that the key competitive factors in the local services and distribution market include:
| | ease of initial setup and use; |
| | product functionality, performance and reliability; |
| | features that best meet the needs of SMB fleet operators; |
| | business intelligence capabilities; |
| | architecture scalability; and |
| | cost. |
We believe that our efficient customer acquisition model, business intelligence approach to fleet management, SaaS delivery model, deep domain expertise and large user base enable us to compete effectively. We believe that many of our competitors rely on up-front hardware sales to finance their operations. Their business models are a significant investment hurdle for SMB customers. Additionally, many of these competitive offerings are difficult to deploy and use and lack other features required by SMB customers.
Some of our competitors have made or may make acquisitions or enter into partnerships or other strategic relationships to offer a more comprehensive service than we do. These combinations may make it more difficult for us to compete effectively, including on the basis of price, sales and marketing programs, technology, or service functionality. We expect these trends to continue as companies attempt to strengthen or maintain their market positions.
Employees
As of December 31, 2014, we had 836 full-time employees. Fleetmatics has employees in Italy who are covered by collective bargaining agreements. We consider our relationship with employees to be good.
Organizational Structure
We were incorporated in Ireland on October 28, 2004 as a private limited company. Before commencing our initial public offering, a public limited company known as Fleetmatics Group PLC became the holding company of the Fleetmatics group by way of a share-for-share exchange in which the shareholders of Fleetmatics Group Limited exchanged their shares in Fleetmatics Group Limited for identical shares in Fleetmatics Group PLC.
Our registered and principal office is located at Block C, Cookstown Court, Belgard Road, Tallaght, Dublin 24, Ireland. Our U.S. headquarters office is located at 1100 Winter Street, Waltham, Massachusetts and our telephone number is (781) 577-4600. We have additional offices in Rolling Meadows, Illinois, Charlotte, North Carolina, Clearwater, Florida, Scottsdale, Arizona and Solon, Ohio in the United States, Reading, Berkshire in the United Kingdom, Dublin, Ireland, Florence, Italy, Utrecht, the Netherlands, Mriehel, Malta, and Sydney, Australia.
14
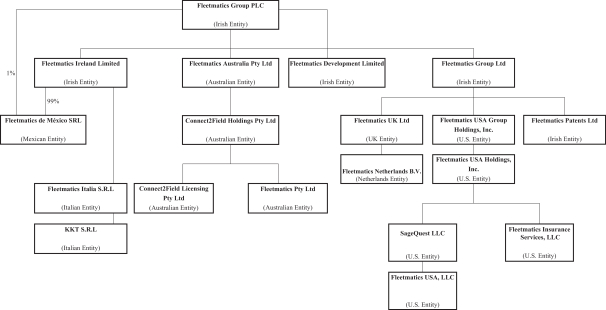
We are a holding company and conduct substantially all of our business through our wholly-owned operating subsidiaries, Fleetmatics Ireland Limited, Fleetmatics (UK) Limited, Fleetmatics USA, LLC, Fleetmatics Netherlands B.V., Fleetmatics de México Srl, and Fleetmatics Pty Ltd.
We have other non-operating, wholly-owned entities in our group, including Fleetmatics Development Limited, which holds certain group intellectual property.
Additionally, we may, from time to time, incorporate subsidiaries for specific purposes or to carry out particular functions.
The following chart shows our current corporate structure:
Taxation in Ireland
Stamp Duty
Irish stamp duty typically arises on the transfer of shares in an Irish incorporated company.
Shares Held Through Depository Trust Company
A transfer of our shares effected by means of the transfer of book entry interests in Depository Trust Company, or DTC, should not be subject to Irish stamp duty.
Shares Transferred Into or Out of DTC
A shareholder may transfer our shares into (or out of) DTC without giving rise to Irish stamp duty so long as:
| (a) | there is no change in the ultimate beneficial ownership of the shares as a result of the transfer; and |
| (b) | the transfer into (or out of) DTC is not in contemplation of a sale of the shares by the beneficial owner to a third party. |
15
Shares Held Outside of DTC
A transfer of our shares where any of the parties to the transfer hold the shares outside of DTC, may be subject to Irish stamp duty (currently at the rate of 1% of the higher of the price paid or the market value of the shares acquired). The transferee of the shares is typically the person that is liable to pay stamp duty.
Due to the potential Irish stamp duty on transfers of our shares, we strongly recommend that shareholders hold their shares through DTC (or through a broker who holds such shares through DTC).
DTC Requirement
In order for DTC, Cede & Co. and National Securities Clearing Corporation, or NSCC, which provides clearing services for securities that are eligible for the depository and book-entry transfer services provided by DTC and registered in the name of Cede & Co., which entities are referred to collectively as the DTC Parties, to agree to provide services with respect to our ordinary shares, the Company has concluded a composition agreement with the Revenue Commissioners of Ireland under which we have assumed any obligation of paying the liability for any Irish stamp duty or similar Irish transfer or documentary tax with respect to our ordinary shares, on (a) transfers to which any of the DTC Parties is a party, or (b) which may be processed through the services of any of the DTC Parties and the DTC Parties have received confirmation from the Revenue Commissioners of Ireland that while such composition agreement remains in force, the DTC Parties shall not be liable for any Irish stamp duty with respect to our ordinary shares.
In addition, to assure the DTC Parties that they will not be liable for any Irish stamp duty or similar Irish transfer or documentary tax with respect to our ordinary shares under any circumstances (including as a result of a change in applicable law), and to make other provisions with respect to our ordinary shares required by the DTC Parties, we and Computershare Trust Company, NA., or Computershare, a U.S. national banking association acting as our transfer agent, entered into a Special Eligibility Agreement for Securities, with DTC, Cede & Co. and NSCC, or the DTC Eligibility Agreement.
The DTC Eligibility Agreement provides for certain indemnities of the DTC Parties by us and Computershare (as to which we have agreed to indemnify Computershare) and also provides that DTC may impose a global lock on our ordinary shares or otherwise limit transactions in the shares, or cause the shares to be withdrawn, and NSCC may, in its sole discretion, exclude our ordinary shares from its Continuous Net Settlement service or any other service, and any of the DTC Parties may take other restrictive measures with respect to our ordinary shares as it may deem necessary and appropriate, without any liability on the part of any of the DTC Parties, (i) at any time that it may appear to any of the DTC Parties, in any such partys sole discretion, that to continue to hold or process transactions in our ordinary shares will give rise to any Irish stamp duty or similar Irish transfer or documentary tax liability with respect to our ordinary shares on the part of any of the DTC Parties or (ii) otherwise as the DTCs rules or the NSCCs rules provide.
Available Information
Our Internet website address is http://www.fleetmatics.com. Our Annual Report on Form 10-K, Quarterly Reports on Form 10-Q, Current Reports on Form 8-K and amendments to those reports filed or furnished pursuant to Section 13(a) or 15(d) of the Securities Exchange Act of 1934 are available free of charge through the investor relations page of our Internet website as soon as reasonably practicable after we electronically file such material with, or furnish it to, the Securities and Exchange Commission, or SEC. The information found on our website is not part of this or any other report we file or furnish to the SEC.
Investors and others should note that we announce material financial information to our investors using our investor relations website (http://ir.fleetmatics.com), SEC filings, press releases, public conference calls and webcasts. We use these channels as well as social media to communicate with our members and the public about our company, our services and other issues. It is possible that the information we post on social media could be
16
deemed to be material information. Therefore, we encourage investors, the media, and others interested in our company to review the information we post on the social media channels listed on our website. Fleetmatics has used, and intends to continue to use, our investor relations website, as well as our Twitter account (@fleetmatics) and Facebook page, as means of disclosing material non-public information and for complying with its disclosure obligations under Regulation FD. Further corporate governance information, including our governance guidelines, board committee charters, and code of business conduct and ethics, is also available on our investor relations website under the heading Corporate Governance. The contents of our websites are not intended to be incorporated by reference into this Annual Report on Form 10-K or in any other report or document we file with the SEC, and any references to our websites are intended to be inactive textual references only.
You may read and copy any materials we file with the SEC at the SECs Public Reference Room at 100 F Street, NE, Washington, DC 20549. You may obtain information on the operation of the Public Reference Room by calling the SEC at 1-800-SEC-0330. The SEC also maintains an Internet website that contains reports, proxy and information statements, and other information regarding Fleetmatics and other issuers that file electronically with the SEC. The SECs Internet website address is http://www.sec.gov.
Information about Segment and Geographic Revenue
Information about segment and geographic revenue is set forth in Note 21 of the Notes to Consolidated Financial Statements under Item 8 of this Annual Report on Form 10-K.
| Item 1A. | Risk Factors |
You should carefully consider the following risk factors and all other information contained in this Annual Report on Form 10-K before deciding to invest in our ordinary shares. The risks and uncertainties described below and elsewhere in this Annual Report on Form 10-K, including in the section headed Managements Discussion and Analysis of Financial Condition and Results of Operations, could materially adversely affect our business. Any of the following risks, as well as other risks not currently known to us, could adversely affect our business, financial condition, cash flow and results of operations. In such case, the trading price of our ordinary shares could decline, and you could lose some or all of your investment.
Risks Related to Our Business
Failure to effectively and efficiently attract, sell to and retain SMB customers would adversely affect our operating results.
We primarily market and sell our solutions to SMBs. SMB customers are challenging to reach, acquire and retain in a cost-effective manner. To grow our revenue, we must add new customers, sell additional functionality to existing customers and encourage existing customers to renew their subscriptions. Selling to and retaining SMB customers is more difficult than selling to and retaining enterprise customers because SMB customers generally:
| | have high failure rates; |
| | are price sensitive; |
| | are difficult to reach with targeted sales campaigns; |
| | have high churn rates in part because of the scale of their businesses and the ease of switching services; and |
| | generate less revenue per customer and per transaction. |
If we are unable to market and sell our solutions to SMBs with competitive pricing and in a cost-effective manner, our ability to grow our revenue and maintain and grow our profitability will be harmed.
17
We may not be able to retain and increase sales to our existing customers, which could negatively impact our financial results.
We generally license our solutions pursuant to customer agreements with an initial term of 36 months for fleet management customers and 12 months for field service management customers. Most agreements provide for renewal automatically for one-year intervals unless the customer elects otherwise, although our customers have no obligation to renew these agreements after their term expires. We also actively seek to sell additional solutions to our existing customers. If our efforts to satisfy our existing customers are not successful, we may not be able to retain them or sell additional functionality to them and, as a result, our revenue and ability to grow would be adversely affected. We track our historical data with respect to customer renewal rates, particularly by measuring the number of new subscriptions added, less the number of subscriptions terminated, divided by the total average customers during a period, which we refer to as net churn. However, we may not be able to accurately predict future trends in customer renewals and the resulting churn. Customers may choose not to renew their subscriptions for many reasons, including the belief that our service is not required for their business needs or is otherwise not cost-effective, a desire to reduce discretionary spending, or a belief that our competitors services provide better value. Additionally, our customers may not renew for reasons entirely out of our control, such as the dissolution of their business, which is particularly common for SMB customers. A significant increase in our churn would have an adverse effect on our business, financial condition, and operating results.
A part of our growth strategy is to sell additional new features and solutions to our existing customers. Our ability to sell new features to customers will depend in significant part on our ability to anticipate industry evolution, practices and standards and to continue to enhance existing solutions, such as integration with fuel cards and GPS navigation devices, or introduce or acquire new solutions on a timely basis to keep pace with technological developments both within our industry and in related industries such as our recent acquisition of a field service job management and scheduling application. However, we may prove unsuccessful either in developing new features or in expanding the third-party software and products with which our solutions integrate. In addition, the success of any enhancement or new feature depends on several factors, including the timely completion, introduction and market acceptance of the enhancement or feature. Any new solutions we develop or acquire might not be introduced in a timely or cost-effective manner and might not achieve the broad market acceptance necessary to generate significant revenue. If any of our competitors implements new technologies before we are able to implement them or better anticipates the innovation and integration opportunities in related industries, those competitors may be able to provide more effective or cheaper solutions than ours.
Another part of our growth strategy is to sell additional subscriptions to existing customers as their fleet sizes increase. We cannot be assured that our customers fleet sizes will continue to increase. A significant decrease in our ability to sell existing customers additional functionality or subscriptions would have an adverse effect on our business, financial condition, and operating results.
Adverse economic conditions or reduced spending on information technology solutions, particularly by small and medium-sized local service and distribution businesses, may adversely impact our revenue and profitability.
Uncertainty about future economic conditions makes it difficult for us to forecast operating results and to make decisions about future investments. We are unable to predict the likely duration and severity of the current adverse economic conditions in the U.S. and other countries, particularly in Europe, but the longer the duration, the greater risks we face in operating our business. Furthermore, our solutions are designed predominately for small and medium-sized local service and distribution businesses, which frequently have limited budgets and may be more likely to be significantly affected by economic downturns and other macroeconomic factors affecting spending behavior than larger enterprises. SMB customers may choose to spend the limited funds that they have on items other than our solutions and may experience higher failure and bankruptcy rates, which would negatively affect the overall demand for our products, increase customer attrition and could cause our revenue to
18
decline. We cannot assure you that current economic conditions, worsening economic conditions or prolonged poor economic conditions will not have a significant adverse impact on the demand for our solutions, and consequently on our results of operations and prospects.
Failure of local service and distribution businesses to adopt fleet management solutions could negatively impact our revenue.
We derive, and expect to continue to derive, substantially all of our revenue from the sale of subscriptions to our fleet management solutions. As a result, widespread acceptance and use of fleet management solutions is critical to our future revenue growth and success. If the market for fleet management solutions fails to grow or grows more slowly than we currently anticipate, demand for our solutions could be negatively affected.
Changes in customer preferences for fleet management solutions may have a disproportionately greater impact on us than if we offered multiple products and services. The market for fleet management solutions is subject to changing customer demand and trends in preferences. Some of the potential factors that could affect interest in and demand for our fleet management solutions include:
| | awareness of our brand and fleet management solutions generally; |
| | the reliability of our solutions; |
| | actual and perceived fuel and vehicle maintenance costs, including decreases in fuel prices; |
| | assumptions regarding general mobile workforce inefficiency; |
| | the price, performance, features, and availability of products and services that compete with ours; |
| | our ability to maintain high levels of customer satisfaction; and |
| | the rate of growth in online solutions generally. |
Our dependence on various lead generation programs could adversely affect our operating results if we need to pay more for such programs or we are unable to attract new customers at the same rate.
We use a number of lead generation programs to promote our solutions. Significant increases in the pricing of one or more of our lead generation channels would increase our overall lead generation costs or cause us to choose less expensive and perhaps less effective channels. For example, a portion of our potential customers locate our website through search engines, such as Google, Bing, and Yahoo!, representing one of the most efficient means for generating cost-effective SMB customer leads. If search engine companies modify their search algorithms in a manner that reduces the prominence of our listing, or if our competitors search engine optimization efforts are more successful than ours, fewer potential customers may click through to our website. In addition, the cost of purchased listings has increased in the past and may continue to increase in the future. As we add to or change the mix of our lead generation strategies, we may need to expand further into channels with significantly higher costs than our current programs, which could adversely affect our operating results. If we are unable to maintain effective advertising programs, our ability to attract new customers could be adversely affected, our advertising and marketing expenses could increase substantially, and our operating results may suffer.
If we are unable to successfully convert customer sales leads into customers on a cost-effective basis, our revenue and operating results would be adversely affected.
We generate substantially all of our revenue from the sale of subscriptions to our solutions. In order to grow, we must continue to efficiently convert customer leads, many of whom have not previously used fleet management solutions, into customers. Our Web-based sales team is the primary driver of cost-effective conversion of customer leads into customers, particularly in the case of SMB customers who are more difficult to reach with targeted sales campaigns and who tend to generate less revenue per transaction. Our Web-based sales
19
team is able to sell our solutions to the geographically-disparate SMB market much more efficiently than a traditional field-based direct sales force. To execute our growth plan, we must continue to attract and retain highly qualified Web-based sales personnel. We may experience difficulty in hiring and retaining highly skilled Web-based sales and marketing employees. An inability to convert customer sales leads into customers on a cost-effective basis could adversely affect our revenue and operating results.
Our quarterly operating results have fluctuated in the past and may fluctuate in the future, which could cause declines or volatility in the price of our ordinary shares.
Our quarterly operating results have fluctuated in the past and may fluctuate in the future as a result of a variety of factors, many of which are outside of our control. If our quarterly operating results or guidance fall below the expectations of research analysts or investors, the price of our ordinary shares could decline substantially. The following factors, among others, could cause fluctuations in our quarterly operating results:
| | our ability to attract new customers and retain existing customers; |
| | our ability to accurately forecast revenue and appropriately plan our expenses; |
| | our ability to introduce new features, including integration of our existing solutions with third-party software and devices; |
| | the actions of our competitors, including consolidation within the industry, pricing changes or the introduction of new services; |
| | our ability to effectively manage our growth; |
| | our ability to successfully manage any future acquisitions of businesses, solutions, or technologies; |
| | our ability to successfully sell into additional geographies utilizing our current lead generation and sales model; |
| | the timing and cost of developing or acquiring technologies, services, or businesses; |
| | the timing, operating costs, and capital expenditures related to the operation, maintenance, and expansion of our business; |
| | service outages or security breaches and any related occurrences which could impact our reputation; |
| | the impact of worldwide economic, industry, and market conditions, including disruptions in financial markets and the deterioration of the underlying economic conditions in some countries, and those conditions specific to Internet usage and online businesses; |
| | trade protection measures (such as tariffs and duties) and import or export licensing requirements; |
| | fluctuations in currency exchange rates; |
| | costs associated with defending intellectual property infringement and other claims; and |
| | changes in government regulation affecting our business. |
We believe that our quarterly revenue and operating results may vary significantly in the future and that period-to-period comparisons of our operating results may not be meaningful. You should not rely on the results of one quarter as an indication of future performance.
If we fail to maintain an effective system of internal controls, we may not be able to accurately report our financial results or prevent fraud. As a result, our shareholders could lose confidence in our financial reporting, which could harm our business and the trading price of our ordinary shares.
We have complied with Section 404 of the Sarbanes-Oxley Act of 2002 by assessing, strengthening and testing our system of internal controls. Even though we concluded our internal controls over financial reporting were effective as of the end of the period covered by this report, we need to continue to maintain our processes
20
and systems and adapt them to changes as our business evolves and we rearrange management responsibilities and reorganize our business accordingly. This continuous process of maintaining and adapting our internal controls and complying with Section 404 is expensive and time-consuming and requires significant management attention. We cannot be certain that our internal control measures will continue to provide adequate control over our financial processes and reporting and ensure compliance with Section 404. Furthermore, as our business changes and if we expand through acquisitions of other companies, our internal controls may become more complex and we will require significantly more resources to ensure our internal controls remain effective. Failure to implement required new or improved controls, or difficulties encountered in their implementation, could harm our operating results or cause us to fail to meet our reporting obligations. If we or our independent registered public accounting firm identify material weaknesses, the disclosure of that fact, even if quickly remediated, could reduce the markets confidence in our financial statements and harm our stock price.
If the accounting estimates we make, and the assumptions on which we rely, in preparing our financial statements prove inaccurate, our actual results may be adversely affected.
Our financial statements have been prepared in accordance with accounting principles generally accepted in the United States of America. The preparation of these financial statements requires us to make estimates and judgments about, among other things, taxes, revenue recognition, stock-based compensation costs, capitalization of internal-use software, investments, contingent obligations, allowance for doubtful accounts, and intangible assets. These estimates and judgments affect the reported amounts of our assets, liabilities, revenues and expenses, the amounts of charges accrued by us, and related disclosure of contingent assets and liabilities. We base our estimates on historical experience and on various other assumptions that we believe to be reasonable under the circumstances and at the time they are made. If our estimates or the assumptions underlying them are not correct, actual results may differ materially from our estimates and we may need to, among other things, accrue additional charges that could adversely affect our results of operations, which in turn could adversely affect our stock price. In addition, new accounting pronouncements and interpretations of accounting pronouncements have occurred and may occur in the future that could adversely affect our reported financial results.
We are exposed to fluctuations in currency exchange rates, which could expose us to losses.
A significant portion of our business is conducted outside the U.S., and as such, we face exposure to movements in non-U.S. currency exchange rates. These exposures may change over time as business practices evolve and could have a material adverse impact on our financial results and cash flows. Fluctuation in currency exchange rates impacts our operating results. Currently, we do not actively hedge against these exposures. We intend to hedge only against those currency exposures associated with certain assets and liabilities denominated in non-functional currencies, which will be intended to offset the impact of currency exchange rate fluctuations on certain non-functional currency assets and liabilities. Our future attempts to hedge against these risks could be unsuccessful and expose us to losses.
We have an accumulated deficit and may not be able to sustain profitability, which may negatively impact our ability to achieve our business objectives.
We reported net income of $27.5 million for 2014, $30.5 million for 2013, and $5.4 million for 2012. We cannot predict if we will be able to sustain profitability. We expect to continue making significant expenditures to develop and expand our business. In addition, as a public company, we will continue to incur additional significant accounting, legal and other expenses that we did not incur as a private company. These increased expenditures make it harder for us to sustain profitability. The recent growth in our revenue and customer base may not be sustainable, and we may not generate sufficient revenue to sustain profitability. We may incur significant losses in the future for a number of reasons, including the other risks described in this section, and we may encounter unforeseen expenses, difficulties, complications and delays and other unknown events. Accordingly, we may not be able to sustain profitability and the failure to fund our capital requirements may negatively impact our ability to achieve our business objectives.
21
The market in which we participate is highly fragmented and competitive, with low barriers to entry. If we do not compete effectively, our operating results may be harmed.
The market for fleet management solutions is highly fragmented, consisting of a significant number of vendors, competitive and rapidly changing, with relatively low barriers to entry. Competition in our market is based primarily on the level of difficulty in installing, using and maintaining solutions, total cost of ownership, product performance, functionality, interoperability, brand and reputation, distribution channels, industries and the financial resources of the vendor. We expect competition to intensify in the future with the introduction of new technologies and market entrants. Mobile service and software providers, such as Google and makers of GPS navigation devices, such as Garmin, provide limited services at lower prices or no charge, such as basic GPS-based mapping, tracking and turn-by-turn directions that could be expanded or further developed to more directly compete with our solutions. We primarily compete with Teletrac, Telogis, Inc., Masternaut Limited and, to a lesser extent, other companies. Competition could result in reduced operating margins, increased sales and marketing expenses and the loss of market share, any of which would likely cause serious harm to our operating results.
Industry consolidation may result in increased competition, which could result in a loss of customers or a reduction in revenue.
Some of our competitors have made or may make acquisitions or may enter into partnerships or other strategic relationships to offer more comprehensive services than they individually had offered or achieve greater economies of scale. In addition, new entrants not currently considered to be competitors may enter our market through acquisitions, partnerships or strategic relationships. For example, CalAmp Corp., our primary supplier of in-vehicle devices, previously announced the acquisition of Wireless Matrix Corporation, which offers fleet management applications and FleetCor, one of our fuel card providers, who acquired NexTraq and more recently a minority interest in Masternaut, both of which offer fleet management solutions. We expect these trends to continue as companies attempt to strengthen or maintain their market positions. Many of the potential entrants, particularly those providing enterprise-level solutions and those who historically focused on the long-haul industry, may have competitive advantages over us, such as greater name recognition, longer operating histories, more varied services and larger marketing budgets, as well as greater financial, technical and other resources. The companies resulting from combinations or that expand or vertically integrate their business to include the SMB market that we address may create more compelling service offerings and may offer greater pricing flexibility than we can or may engage in business practices that make it more difficult for us to compete effectively, including on the basis of price, sales and marketing programs, technology or service functionality. These pressures could result in a substantial loss of our customers or a reduction in our revenue.
Our inability to adapt to rapid technological change in our industry and related industries could impair our ability to remain competitive and adversely affect our results of operations.
The industry in which we compete and related industries are characterized by rapid technological change, frequent introductions of new products and evolving industry standards. In addition to the fleet management solutions industry, we are subject to changes in the automotive, mobile handset, GPS navigation device and work flow software industries. As the technology used in each of these industries evolves, we will face new integration and competition challenges. For example, as automobile manufacturers evolve in-vehicle technology, GPS tracking devices may become standard equipment and compete against our solutions. Furthermore, major gains in fuel efficiency may lead to a relative decrease in the demonstrable return on investment of our solutions perceived by our customers. If we are unable to adapt to rapid technological change, it could adversely affect our results of operations and our ability to remain competitive.
An assertion by a third party that we are infringing its intellectual property could subject us to costly and time-consuming litigation or expensive licenses and our business could be harmed.
The fleet management and technology industries are characterized by the existence of a large number of patents, copyrights, trademarks and trade secrets and by frequent litigation based on allegations of infringement
22
or other violations of intellectual property rights. Much of this litigation involves patent holding companies or other adverse patent owners who have no relevant product revenues of their own, and against whom our own patent portfolio may provide little or no deterrence.
On December 19, 2013, GPNE Corp. filed a complaint against the Company (GPNE Corp. v. Fleetmatics USA, LLC, Civil Action No. 13-2049) in the United States District Court for the District of Delaware alleging infringement of U.S. Patent No. 7,555,267 entitled Network Communication System Wherein a Node Obtains Resources For Transmitting Data By Transmitting Two Reservation Requests (the 267 Patent) and U.S. Patent No. 8,086,240 (the 240 patent) entitled Data Communication System Using A Reserve Request And Four Frequencies To Enable Transmitting Data Packets Which Can Include A Count Value And Termination Indication Information (the 240 Patent). On May 6, 2014, the parties filed a joint stipulation dismissing the 267 patent with prejudice. On May 7, 2014, GPNE Corp. filed an amended complaint alleging that we infringed the 240 patent and U.S. Patent No. 7,570,954, entitled Communication System Wherein A Clocking Signal From A Controller, A Request From A Node, Acknowledgement Of The Request, And Data Transferred From The Node Are All Provided on Different Frequencies, Enabling Simultaneous Transmission Of These Signals (the 954 Patent). In response to GPNEs amended complaint, we denied infringement, asserted invalidity, and counterclaimed with state-law claims for tortious interference with business relations and unfair competition. On November 12, 2014, the parties filed a joint stipulation dismissing the 240 patent with prejudice. As a result, of the three patents asserted by GPNE, only the 954 patent currently remains in the litigation. GPNE Corp. seeks damages and not an injunction. At this stage of the litigation, we are unable to estimate whether a loss is reasonably possible. While we do not believe that this litigation will have a material adverse effect on our business, financial condition, operating results, or cash flows, we cannot assure you that this will be the case.
We cannot assure you that we will prevail in any current or future intellectual property infringement or other litigation given the complex technical issues and inherent uncertainties in such litigation. Defending such claims, regardless of their merit, could be time-consuming and distracting to management, result in costly litigation or settlement, cause development delays, or require us to enter into royalty or licensing agreements. In addition, we could be obligated to indemnify our customers against third parties claims of intellectual property infringement based on our solutions. If our solutions violate any third-party intellectual property rights, we could be required to withdraw those solutions from the market, re-develop those solutions or seek to obtain licenses from third parties, which might not be available on reasonable terms or at all. Any efforts to re-develop our solutions, obtain licenses from third parties on favorable terms or license a substitute technology might not be successful and, in any case, might substantially increase our costs and harm our business, financial condition and operating results. Withdrawal of any of our solutions from the market could harm our business, financial condition and operating results.
In addition, we incorporate open source software into our platform. Given the nature of open source software, third parties might assert copyright and other intellectual property infringement claims against us based on our use of certain open source software programs. The terms of many open source licenses to which we are subject have not been interpreted by U.S. or courts of other jurisdictions, and there is a risk that those licenses could be construed in a manner that imposes unanticipated conditions or restrictions on our ability to commercialize our solutions. In that event, we could be required to seek licenses from third parties in order to continue offering our solutions, to re-develop our solutions, to discontinue sales of our solutions, or to release our proprietary software source code under the terms of an open source license, any of which could adversely affect our business.
If we are unable to protect our intellectual property and proprietary technologies, our business may be adversely affected.
Our future success and competitive position depend in large part on our ability to protect our intellectual property and proprietary technologies. We rely on a combination of trademark, patent, copyright, and trade secret laws, as well as confidentiality procedures and contractual restrictions, to establish and protect our intellectual property rights, all of which provide only limited protection and may not currently or in the future provide us
23
with a competitive advantage. We cannot assure you that any future trademark registrations will be issued for pending or future applications or that any registered trademarks will be enforceable or provide adequate protection of our proprietary rights. We have four issued U.S. patents and nine pending U.S. patent applications. We have one Irish patent and one European patent that has been validated in the UK, France, Germany, and the Netherlands. We also have nine pending international patent applications filed under the Patent Cooperation Treaty and seven European patent applications. We have fifteen trademark applications/registrations in the U.S. We also have eleven registered trademarks in Ireland, one in the U.K., two in Australia, and three in Mexico. In addition, we have eleven trademark registrations/applications in the European Community. We cannot assure you that any patents or trademarks will issue from any of our pending or future patent or trademark applications, that any patents or trademarks that issue from such applications will give us the protection that we seek, or that any such patents or trademarks will not be challenged, invalidated, or circumvented. Any patents or trademarks that may issue in the future from our pending or future patent and trademark applications may not provide sufficiently broad protection and may not be enforceable in actions against alleged infringers.
We cannot assure you that the steps we take will be adequate to protect our technologies and intellectual property, our patent and trademark applications will lead to issued patents or registered trademarks, others will not develop or patent similar or superior technologies or solutions, or that our patents, trademarks, and other intellectual property will not be challenged, invalidated, or circumvented by others. Furthermore, effective patent, trademark, copyright, and trade secret protection may not be available in every country in which our solutions are available or where we have employees or independent contractors. In addition, the legal standards relating to the validity, enforceability, and scope of protection of intellectual property rights in Internet-related industries are uncertain and still evolving.
The steps we have taken and will take may not prevent unauthorized use, reverse engineering, or misappropriation of our technologies and we may not be able to detect any of the foregoing. Others may independently develop technologies that infringe on our intellectual property rights. Defending and enforcing our intellectual property rights may result in litigation, which can be costly and divert management attention and resources. Any such litigation may not be successful even if such rights have been infringed, and an adverse decision could limit the scope of such rights. If our efforts to protect our technologies and intellectual property are inadequate, the value of our intangible assets may be diminished and competitors may be able to replicate our solutions and methods of operations. Any of these events could have a material adverse effect on our business, financial condition, and operating results.
We depend in part on confidentiality agreements that may not adequately protect our trade secrets and proprietary information, which could adversely affect our business.
We have devoted substantial resources to the development of our proprietary technologies and related processes. In order to protect our proprietary technologies and processes, we rely in part on trade secret laws and confidentiality agreements with our employees, licensees, independent contractors, and advisors. These agreements may not effectively prevent disclosure of confidential information and may not provide an adequate remedy in the event of unauthorized disclosure of confidential information. In addition, others may independently discover our trade secrets or develop similar technologies and processes, and, in either event we would not be able to assert trade secret rights. Further, laws in certain jurisdictions may afford little or no trade secret protection, and any changes in, or unexpected interpretations of, the intellectual property laws in any country in which we operate may compromise our ability to enforce our intellectual property rights. Costly and time-consuming litigation could be necessary to enforce and determine the scope of our intellectual property rights, and failure or inability to obtain or maintain trade secret protection or otherwise protect our intellectual property rights could adversely affect our business.
We rely on third-party software and other intellectual property to develop and provide our solutions and significant increases in licensing costs or defects in third-party software could harm our business.
We rely on software and other intellectual property licensed from third parties to develop and offer our solutions, including mapping software and data from Google to provide solutions to our customers. In addition,
24
we may need to obtain future licenses from third parties to use software or other intellectual property associated with our solutions. We cannot assure you that these licenses will be available to us on acceptable terms, without significant price increases or at all. Any loss of the right to use any such software or other intellectual property required for the development and maintenance of our solutions could result in delays in the provision of our solutions until equivalent technology is either developed by us, or, if available from others, is identified, obtained, and integrated, which could harm our business. Any errors or defects in third-party software could result in errors or a failure of our solutions, which could harm our business.
Our solutions integrate with third-party technologies and if our solutions become incompatible with these technologies, our solutions would lose functionality and our customer acquisition and retention could be adversely affected.
Our solutions integrate with third-party software and devices to allow our solutions to perform key functions. For example, we offer integration with work flow software products, such as ARRIS Solutions, Garmin GPS navigation devices and fuel card providers such as FleetCor, among others. Although to date this integration has been accomplished using open software interfaces and simple physical linkages, we cannot guarantee that this ease of integration will continue or that we will be able to integrate with other products as easily or without additional cost. Our field service application integrates with MYOB, Quicken, Xero, Saasu and KashFlow, and we plan to add others over time. Errors, viruses or bugs may be present in third-party software that our customers use in conjunction with our solutions. Changes to third-party software that our customers use in conjunction with our solutions could also render our solutions inoperable. Customers may conclude that our software is the cause of these errors, bugs or viruses and terminate their subscriptions. The inability to easily integrate with, or any defects in, any third-party software could result in increased costs, or in delays in software releases or updates to our products until such issues have been resolved, which could have a material adverse effect on our business, financial condition, results of operations, cash flows and future prospects and could damage our reputation.
We are migrating to a new accounting system and, if this new system proves ineffective, we may be unable to timely or accurately prepare financial reports.
We are in the process of standardizing our accounting systems to provide us with the necessary accounting controls needed for our continued financial reporting requirements as a public company. Any problems or delays associated with the implementation of our unified accounting platform or the failure to complete such implementation on a timely basis could adversely affect our ability to report financial information as our company grows, including the filing of our quarterly or annual reports with the SEC on a timely and accurate basis. After converting from prior systems and processes, we may discover data integrity problems or other issues that, if not corrected, could impact our business or financial results.
We have experienced rapid growth in recent periods. If we fail to manage our growth effectively, we may be unable to execute our business plan, maintain high levels of service or address competitive challenges adequately.
We increased our number of full-time employees to 836 at December 31, 2014 from 659 at December 31, 2013, 476 at December 31, 2012, 408 at December 31, 2011 and 290 at December 31, 2010. Our subscription revenue increased to $231.6 million in 2014 from $177.4 million in 2013, $127.5 million in 2012, $92.3 million in 2011, and $64.7 million in 2010. Our growth has placed, and may continue to place, a significant strain on our managerial, administrative, operational, financial and other resources. We intend to further expand our overall business, customer base, headcount and operations both domestically and internationally. Creating a global organization and managing a geographically dispersed workforce will require substantial management effort and significant additional investment in our infrastructure. We will be required to continue to improve our operational, financial and management controls and our reporting procedures and we may not be able to do so effectively. As such, we may be unable to manage our expenses effectively in the future, which may negatively impact our gross profit or operating expenses in any particular quarter.
25
The loss of one or more of our key personnel, or our failure to attract, train and retain other highly qualified personnel, could harm our business.
We depend on the continued service and performance of our key personnel, including our senior management. In addition, the sales and customer service-driven focus of our business and employees is vital to our growth plan. The loss of key personnel, including key members of our management team, as well as certain of our key marketing, sales, product development, or technology personnel, could disrupt our operations and have an adverse effect on our ability to grow our business. To execute our growth plan, we must attract and retain highly qualified personnel. Competition for these employees is intense, and we may not be successful in attracting and retaining qualified personnel. We may experience difficulty in hiring and retaining highly skilled employees with appropriate qualifications. New hires require significant training and, in most cases, take significant time before they achieve full productivity. Our recent hires and planned hires may not become as productive as we expect, and we may be unable to hire or retain sufficient numbers of qualified individuals. If we fail to attract and train new personnel, or fail to retain, focus and motivate our current personnel, our business and growth prospects could be severely harmed.
We may expand by acquiring or investing in other companies, which may divert our managements attention, result in dilution to our shareholders, and consume resources that are necessary to sustain our business.
We may in the future acquire complementary products, services, technologies, or businesses. In May 2014, we acquired KKT, the developer of Routist, a SaaS-based, intelligent vehicle routing solution which we are integrating with our Fleetmatics REVEAL and Fleetmatics WORK offerings. In August 2013, we acquired Connect2Field, which provided us a field service job management and scheduling application which we have integrated as part of our fleet management system as well as continued to make available on a stand-alone basis. We also may enter into relationships with other businesses to expand our portfolio of solutions or our ability to provide our solutions in foreign jurisdictions. Negotiating these transactions can be time-consuming, difficult and expensive, and our ability to complete these transactions may often be subject to conditions or approvals that are beyond our control. Consequently, these transactions, even if undertaken and announced, may not close.
An acquisition, investment, or new business relationship may result in unforeseen operating difficulties and expenditures. In particular, we may encounter difficulties assimilating or integrating the businesses, technologies, products, personnel, or operations of acquired companies, particularly if the key personnel of the acquired company choose not to work for us, the acquired companys technology is not easily adapted to be compatible with ours, or we have difficulty retaining the customers of any acquired business due to changes in management or otherwise. Acquisitions may also disrupt our business, divert our resources, and require significant management attention that would otherwise be available for the development of our business. Moreover, the anticipated benefits of any acquisition, investment, or business relationship may not be realized or we may be exposed to unknown liabilities, including litigation against the companies we may acquire. For one or more of those transactions, we may:
| | issue additional equity securities that would dilute our shareholders; |
| | use cash that we may need in the future to operate our business; |
| | incur debt on terms unfavorable to us or that we are unable to repay or that may place burdensome restrictions on our operations; |
| | incur large charges or substantial liabilities; or |
| | become subject to adverse tax consequences, or substantial depreciation, deferred compensation or other acquisition-related accounting charges. |
Any of these risks could harm our business and operating results.
26
We face many risks associated with our plans to expand internationally, which could harm our business, financial condition, and operating results.
We anticipate that our efforts to expand internationally will entail the marketing and advertising of our solutions and brand. While our software and websites are designed for ease of localization, we do not have substantial experience localizing our website and software into foreign languages. We also do not have substantial experience in selling our solutions in international markets outside of the U.S., Canada, the U.K. and Ireland or in conforming to the local cultures, standards, or policies necessary to successfully compete in those markets, and we may be required to invest significant resources in order to do so. We may not succeed in these efforts or achieve our customer acquisition or other goals. In some international markets, customer preferences and buying behaviors may be different, and we may use business or pricing models that are different from our traditional subscription model to provide fleet management solutions to customers in those markets or we may be unsuccessful in implementing the appropriate business model. Our revenue from new foreign markets may not exceed the costs of establishing, marketing, and maintaining our international offerings. In addition, the current instability in the Eurozone could have many adverse consequences on our international expansion, including sovereign default, liquidity and capital pressures on Eurozone financial institutions, reducing the availability of credit and increasing the risk of financial sector failures and the risk of one or more Eurozone member states leaving the euro, resulting in the possibility of capital and exchange controls and uncertainty about the impact of contracts and currency exchange rates.
In addition, conducting expanded international operations subjects us to new risks that we have not generally faced in our current markets. These risks include:
| | localization of our solutions, including the addition of foreign languages and adaptation to new local practices and regulatory requirements; |
| | lack of experience in other geographic markets; |
| | strong local competitors; |
| | the cost and burden of complying with, lack of familiarity with, and unexpected changes in, foreign legal and regulatory requirements; |
| | difficulties in managing and staffing international operations; |
| | fluctuations in currency exchange rates or restrictions on foreign currency; |
| | potentially adverse tax consequences, including the complexities of transfer pricing, value added or other tax systems, double taxation and restrictions and/or taxes on the repatriation of earnings; |
| | dependence on third parties, including commercial partners with whom we do not have extensive experience; |
| | increased financial accounting and reporting burdens and complexities; |
| | political, social, and economic instability, terrorist attacks, and security concerns in general; and |
| | reduced or varied protection for intellectual property rights in some countries. |
Operating in international markets also requires significant management attention and financial resources. The investment and additional resources required to establish operations and manage growth in other countries may not produce desired levels of revenue or profitability.
Our software contains encryption technologies, certain types of which are subject to U.S. and foreign export control regulations and, in some foreign countries, restrictions on importation and/or use. Any failure on our part to comply with encryption or other applicable export control requirements could result in financial penalties or other sanctions under the U.S. export regulations, including restrictions on future export activities, which could harm our business and operating results. Regulatory restrictions could impair our access to technologies needed to improve our solutions and may also limit or reduce the demand for our solutions outside of the U.S.
27
Our solutions rely on cellular and GPS networks and any disruption, failure or increase in costs could impede our profitability and harm our financial results.
Two critical links in our current solutions are between in-vehicle devices and GPS satellites and between in-vehicle devices and cellular networks, which allow us to obtain location data and transmit it to our system. Increases in the fees charged by cellular carriers for data transmission or changes in the cellular networks, such as a cellular carrier discontinuing support of the network currently used by our in-vehicle devices, requiring retrofitting of our in-vehicle devices could increase our costs and impact our profitability. We have migrated new installations to the next generation of cellular network compatibility in order to maximize expected useful life of our in-vehicle devices, however, cellular carriers could in the future migrate allotted bandwidth from one network to another. Also, while we have included the ability to store GPS data in our in-vehicle devices in case of temporary cellular network connectivity failure, widespread disruptions or extended failures of the cellular networks would adversely affect our solutions functionality and utility and harm our financial results. Our field service job management and scheduling application utilizes the field workers smartphone and communicates over their cellular networks.
GPS is a satellite-based navigation and positioning system consisting of a constellation of orbiting satellites. These satellites and their ground support systems are complex electronic systems subject to electronic and mechanical failures and possible sabotage and it is not certain that the U.S. government will remain committed to the operation and maintenance of GPS satellites over a long period. In addition, technologies that rely on GPS depend on the use of radio frequency bands and any modification of the permitted uses of these bands may adversely affect the functionality of GPS and, in turn, our solutions. The satellites and their ground control and monitoring stations are maintained and operated by the U.S. Department of Defense. The Department of Defense does not currently charge users for access to the satellite signals, but we cannot assure you that they will not do so in the future.
Evolving regulation and changes in applicable laws relating to the Internet and data privacy may increase our expenditures related to compliance efforts or otherwise limit the solutions we can offer, which may harm our business and adversely affect our financial condition.
As Internet commerce continues to evolve, increased regulation by federal, state or foreign agencies becomes more likely. We are particularly sensitive to these risks because the Internet is a critical component of our SaaS business model. In addition, taxation of services provided over the Internet or other charges imposed by government agencies or by private organizations for accessing the Internet may be imposed. Any regulation imposing greater fees for Internet use or restricting information exchange over the Internet could result in a decline in the use of the Internet and the viability of Internet-based services, which could harm our business.
Our solutions and products enable us to collect, manage and store a wide range of data related to fleet management such as vehicle location and fuel usage, speed and mileage and, in the case of our field service application, includes customer information, job data, schedule and invoice information. A valuable component of our solutions is our ability to analyze this data to present the user with actionable business intelligence. We obtain our data from a variety of sources, including our customers and third-party providers. We cannot assure you that the data we require for our proprietary data sets will be available from these sources in the future or that the cost of such data will not increase. The United States and various state governments have adopted or proposed limitations on the collection, distribution and use of personal information. Several foreign jurisdictions, including the European Union and the United Kingdom, have adopted legislation (including directives or regulations) that increase or change the requirements governing data collection and storage in these jurisdictions. If our privacy or data security measures fail to comply, or are perceived to fail to comply, with current or future laws and regulations, we may be subject to litigation, regulatory investigations or other liabilities. Moreover, if future laws and regulations limit our clients ability to use and share this data or our ability to store, process and share data with our clients over the Internet, demand for our solution could decrease, our costs could increase, and our results of operations and financial condition could be harmed.
28
Failure to maintain the security of our information and technology networks, including information relating to our customers and employees, could adversely affect us. Furthermore, if security breaches in connection with the delivery of our services allow unauthorized third parties to obtain control or access of our fleet and field management solutions, our reputation, business, results of operations and financial condition could be harmed.
We are dependent on information technology networks and systems, including the Internet, to process, transmit and store electronic information and, in the normal course of our business, we collect and retain certain information pertaining to our customers and employees. The protection of customer and employee data is critical to us. We devote significant resources to addressing security vulnerabilities in our products and information technology systems, however, the security measures put in place by us cannot provide absolute security, and our information technology infrastructure may be vulnerable to criminal cyber-attacks or data security incidents due to employee or customer error, malfeasance, or other vulnerabilities. Cybersecurity attacks are increasingly sophisticated, change frequently, and often go undetected until after an attack has been launched. We may fail to identify these new and complex methods of attack, or fail to invest sufficient resources in security measures. We cannot be certain that advances in cyber-capabilities or other developments will not compromise or breach the technology protecting the networks that access our services.
If a security breach occurs, our reputation, business, results of operations and financial condition could be harmed. Though it is difficult to determine what harm may directly result from any specific interruption or security breach, any failure or perceived failure to maintain performance, reliability, security and availability of systems or the actual or potential theft, loss, fraudulent use or misuse of our products or the personally identifiable data of a customer or employee, could result in:
| | harm to our reputation or brand, which could lead some customers to seek to stop using certain of our services, reduce or delay future purchases of our services, use competing services, or materially and adversely affect the overall market perception of the security and reliability of our services; |
| | individual and/or class action lawsuits, which could result in financial judgments against us and which would cause us to incur legal fees and costs; |
| | state or federal enforcement action, which could result in fines and/or penalties and which would cause us to incur legal fees and costs; and/or |
| | additional costs associated with responding to the interruption or security breach, such as investigative and remediation costs, the costs of providing customers with notice of the breach, legal fees, the costs of any additional fraud detection activities, or the costs of prolonged system disruptions or shutdowns. |
Any of these actions could materially adversely impact our business and results of operations.
Our software may contain undetected errors, defects or software errors, which could result in damage to our reputation or harm to our operating results.
We warrant that our software will be free of defects for various periods of time. We must update our solutions quickly to keep pace with the rapidly changing market and the third-party software and devices with which our solutions integrate, and we have a history of frequently introducing new versions. Our solutions could contain undetected errors or defects, especially when first introduced or when new versions are released. In general, our software may not be free from errors or defects, which could result in damage to our reputation or harm to our operating results.
Any significant disruption in service on our websites or in our computer systems could damage our reputation and result in a loss of customers, which would harm our business and operating results.
Our brand, reputation, and ability to attract, retain, and serve our customers are dependent upon the reliable performance of our service and our customers ability to access our solutions at all times. Our customers rely on our solutions to make operating decisions related to their fleet, as well as to measure, store and analyze valuable
29
data regarding their businesses. Our solutions are vulnerable to interruption and our data centers are vulnerable to damage or interruption from human error, intentional bad acts, computer viruses or hackers, earthquakes, hurricanes, floods, fires, war, terrorist attacks, power losses, hardware failures, systems failures, telecommunications failures, and similar events, any of which could limit our customers ability to access our solutions. Prolonged delays or unforeseen difficulties in connection with adding capacity or upgrading our network architecture may cause our service quality to suffer. Any event that significantly disrupts our service or exposes our data to misuse could damage our reputation and harm our business and operating results, including reducing our revenue, causing us to issue credits to customers, subjecting us to potential liability, harming our churn rates, or increasing our cost of acquiring new customers.
We host our solutions and serve all of our customers from our network servers, which are principally located at third-party data center facilities in the Cleveland, Ohio, Denver, Colorado and Dublin, Ireland areas. While we control and have access to our servers and all of the components of our network that are located in our external data centers, we do not control the operation of these facilities. Problems faced by our third-party data center locations, with the telecommunications network providers with whom we or they contract, or with the systems by which our telecommunications providers allocate capacity among their customers, including us, could adversely affect the experience of our customers. Our third-party data center operators could decide to close their facilities without adequate notice. In addition, any financial difficulties, such as bankruptcy, faced by our third-party data center operators or any of the service providers with whom we or they contract may have negative effects on our business, the nature and extent of which are difficult to predict. Additionally, if our data centers are unable to keep up with our growing needs for capacity, this could have an adverse effect on our business. Our disaster recovery systems are located at our third-party hosting facilities. While we are increasing redundancy, our systems have not been tested under actual disaster conditions and may not have sufficient capacity to recover all data and services in the event of an outage. In the event of a disaster in which our disaster recovery systems are irreparably damaged or destroyed, we would experience interruptions in access to our products. Any changes in third-party service levels at our data centers or any errors, defects, disruptions, or other performance problems with our solutions could harm our reputation and may damage our data. Interruptions in our services might reduce our revenue, cause us to issue credits or refunds to customers, subject us to potential liability, or harm our churn rates.
We provide minimum service level commitments to certain of our customers, and our failure to meet them could cause us to issue credits for future subscriptions or pay penalties, which could harm our results of operations.
Certain of our customer agreements currently, and may in the future, provide minimum service level commitments regarding items such as uptime, functionality or performance. If we are unable to meet the stated service level commitments for these customers or suffer extended periods of service unavailability, we are or may be contractually obligated to provide these customers with credits for future subscriptions, provide services at no cost or pay other penalties, which could adversely impact our revenue. We do not currently have any reserves on our balance sheet for these commitments.
Changes in our effective tax rate may reduce our net income in future periods.
While we believe that our organization as an Irish entity should improve our ability to maintain a competitive worldwide effective corporate tax rate, we cannot give any assurance as to what our effective tax rate will be because of, among other things, uncertainty regarding the tax policies of the jurisdictions where we operate. In general, under current Irish legislation, a company is regarded as resident for tax purposes in Ireland if it is centrally managed and controlled in Ireland, or, in certain circumstances, if it is incorporated in Ireland. Trading income of an Irish resident company is generally taxable at the Irish corporation tax rate of 12.5%. Non-trading income of an Irish resident company (e.g., interest income, rental income, dividends or other passive income) is taxable at a rate of 25%. It is possible that in the future, whether as a result of a change in law or the practice of any relevant tax authority or as a result of any change in the conduct of our affairs, we could become, or be regarded as having become tax resident in a jurisdiction other than Ireland. Should we cease to be an Irish
30
tax resident, we may be subject to a charge to Irish capital gains tax as a result of a deemed disposal of our assets. Our actual effective tax rate may vary from our expectation and that variance may be material. Additionally, the tax laws of Ireland, the U.S. and other jurisdictions could change in the future, and such changes could cause a material change in our effective tax rate.
Effective for 2015, our legal entity which is the owner of our intellectual property has become a non-resident Irish entity in compliance with European Union, or EU, migration laws. We expect that the effect of this will be to reduce our consolidated taxation.
A number of factors may increase our future effective tax rates, including:
| | the jurisdictions in which profits are determined to be earned and taxed; |
| | the resolution of issues arising from tax audits with various tax authorities; |
| | changes in the valuation of our deferred tax assets and liabilities; |
| | increases in expense not deductible for tax purposes, including transaction costs and impairments of goodwill in connection with acquisitions; |
| | changes in available tax credits; |
| | changes in share-based compensation; |
| | changes in tax laws or the interpretation of such tax laws, and changes in generally accepted accounting principles; and |
| | challenges to the transfer pricing policies related to our structure. |
Our tax position could be adversely impacted by changes in tax rates generally, tax laws, tax treaties or tax regulations or changes in the interpretation of such laws, treaties or regulations by the tax authorities in Ireland, the U.S. and other jurisdictions. For example, any amendments to the current double taxation treaties between Ireland and other jurisdictions, including the U.S., could subject us to increased taxation. In the normal course of business, we are subject to examination by various taxing authorities. As of December 31, 2014, we remain subject to examination in our material jurisdictions: the United States for tax years 2011 through 2014, in Ireland for tax years 2009 through 2014, and in the United Kingdom for tax years 2010 through 2014.
Failure to manage the risks associated with such changes, or misinterpretation of the laws relating to taxation, could result in increased charges, financial loss, including penalties, and reputational damage and materially and adversely affect our results, financial condition and prospects.
Increases in credit card processing fees would increase our operating expenses and adversely affect our operating results.
A majority of our customers purchase our solutions with credit cards and electronic funds transfers, and our business depends upon our ability to offer credit card payment options, which we offer using third-party processing services. We cannot assure you that credit card issuers will not increase their credit card processing fees, which could in turn lead to increases in the fees charged by our third-party processors. In addition, our third-party processors, like any credit card issuer, could increase their credit card processing fees if we experience excessive chargebacks or for other reasons. Given the percentage of our revenue received from credit card purchases, any increase in processing fees could adversely affect our business and operating results.
If the security of our customers confidential information stored in our system is breached or otherwise subjected to unauthorized access, we could be subject to financial liability, our reputation could be harmed and customers may be reluctant to use our solutions.
We rely on third-party encryption and authentication technology to provide secure transmission of confidential information over the Internet, including customer credit card and bank account numbers. Advances
31
in technological capabilities, new discoveries in the field of cryptography or other events or developments could result in a compromise or breach of the technology we use to protect sensitive transaction data. Any security breaches, unauthorized access, unauthorized usage, virus or similar breach or disruption could result in loss of confidential information, personal data and customer content, damage to our reputation, early termination of our contracts, litigation, regulatory investigations or other liabilities. If any such compromise of our security, or the security of our customers or service providers, were to occur as a result of third-party action, employee error, malfeasance or otherwise, it could result in misappropriation of proprietary information or interruptions in operations and have an adverse impact on our reputation or the reputation of our customers. If we are unable to detect and prevent unauthorized access to our systems or use of credit cards and bank account numbers, our business could suffer.
Our operating results may be harmed if we are required to collect sales, services or other related taxes for our solutions in jurisdictions where we have not historically done so.
We do not believe that we are required to collect sales, use, services or other similar taxes from our customers in certain jurisdictions. However, one or more countries or states may seek to impose sales, use, services, or other tax collection obligations on us, including for past sales. A successful assertion by one or more jurisdictions that we should collect sales or other taxes on the sale of our solutions could result in substantial tax liabilities for past sales and decrease our ability to compete for future sales. Each country and each state has different rules and regulations governing sales and use taxes and these rules and regulations are subject to varying interpretations that may change over time. We review these rules and regulations periodically and, when we believe sales and use taxes apply in a particular jurisdiction, voluntarily engage tax authorities in order to determine how to comply with their rules and regulations. We cannot assure you that we will not be subject to sales and use taxes or related penalties for past sales in jurisdictions where we presently believe sales and use taxes are not due. We reserve estimated sales and use taxes on our financial statements but we cannot be certain that we have made sufficient reserves to cover taxes.
Providers of goods or services are typically held responsible by taxing authorities for the collection and payment of any applicable sales and similar taxes. If one or more taxing authorities determines that taxes should have, but have not, been paid with respect to our solutions, we may be liable for past taxes in addition to being required to collect sales or similar taxes in respect of our solutions going forward. Liability for past taxes may also include very substantial interest and penalty charges. Our client contracts provide that our clients must pay all applicable sales and similar taxes. Nevertheless, clients may be reluctant to pay back taxes and may refuse responsibility for interest or penalties associated with those taxes or we may determine that it would not be feasible to seek reimbursement. If we are required to collect and pay back taxes and the associated interest and penalties and if our clients do not reimburse us for all or a portion of these amounts, we will have incurred unplanned expenses that may be substantial. Moreover, imposition of such taxes on our solutions going forward will effectively increase the cost of such solutions to our clients.
Many states are also pursuing legislative expansion of the scope of goods and services that are subject to sales and similar taxes as well as the circumstances in which a vendor of goods and services must collect such taxes. Furthermore, legislative proposals have been introduced in Congress that would provide states with additional authority to impose such taxes. Accordingly, it is possible that either federal or state legislative changes may require us to collect additional sales and similar taxes from our clients in the future.
Risk Related to Ownership of Ordinary Shares
Our failure to raise additional capital or generate the cash flows necessary to expand our operations and invest in our business could reduce our ability to compete successfully.
We anticipate that our available funds will be sufficient to meet our cash needs for at least the next 12 months. We may, however, need, or could elect to seek, additional financing at any time. Our ability to obtain financing will depend on, among other things, our development efforts, business plans, operating performance
32
and condition of the capital markets at the time we seek financing. If we need to raise additional funds, we may not be able to obtain additional debt or equity financing on favorable terms, if at all. If we raise additional equity financing, our shareholders may experience significant dilution of their ownership interests, and the per share value of our ordinary shares could decline. If we engage in additional debt financing, we may be required to accept terms that further restrict our ability to incur additional indebtedness and force us to maintain specified liquidity or other ratios and limit the operating flexibility of our business. If we need additional capital and cannot raise it on acceptable terms, we may not be able to, among other things:
| | develop or enhance our solutions; |
| | continue to expand our development, sales, and marketing teams; |
| | acquire complementary technologies, products, or businesses; |
| | expand our operations in the U.S. or internationally; |
| | hire, train, and retain employees; |
| | respond to competitive pressures or unanticipated working capital requirements; or |
| | continue our operations. |
Our share price has been volatile and may be volatile in the future, which could result in substantial losses for investors in our ordinary shares.
Our ordinary shares were sold to the public in our October 2012 initial public offering at $17.00 per share, and as of January 31, 2015, our ordinary shares have subsequently traded as high as $52.28 per share and as low as $19.20 per share. Market prices for securities of companies like ours have historically been particularly volatile in response to various factors, some of which are beyond our control. Some of the factors that may cause the market price for our ordinary shares to fluctuate include:
| | fluctuations in our quarterly financial results or the quarterly financial results of companies perceived to be similar to us; |
| | actual or anticipated fluctuations in our key operating metrics, financial condition, and operating results; |
| | loss of existing customers or inability to attract new customers; |
| | actual or anticipated changes in our growth rate; |
| | announcements of technological innovations or new offerings by us or our competitors; |
| | our announcement of actual results for a fiscal period that are lower than projected or expected or our announcement of revenue or earnings guidance that is lower than expected; |
| | changes in estimates of our financial results or recommendations by securities analysts; |
| | failure of any of our solutions to achieve or maintain market acceptance; |
| | changes in market valuations of similar companies; |
| | success of competitive products or services; |
| | changes in our capital structure, such as future issuances of securities or the incurrence of debt; |
| | announcements by us or our competitors of significant products or services, contracts, acquisitions, or strategic alliances; |
| | regulatory developments in the U.S. or other countries; |
| | actual or threatened litigation involving us or our industry; |
| | additions or departures of key personnel; |
33
| | general perception of the future of the fleet management market or our solutions; |
| | share price and volume fluctuations attributable to inconsistent trading volume levels of our shares; |
| | further issuances of ordinary shares by us; |
| | sales of ordinary shares by our shareholders; |
| | repurchases of ordinary shares; and |
| | changes in general economic, industry, and market conditions. |
In addition, the stock market in general, and the market for technology companies in particular, has experienced extreme price and volume fluctuations that have often been unrelated or disproportionate to the operating performance of those companies. Securities class action litigation has often been instituted against companies following periods of volatility in the overall market and in the market price of a companys securities. This litigation, if instituted against us, could result in very substantial costs, divert our managements attention and resources, and harm our business, operating results, and financial condition. In addition, recent fluctuations in the financial and capital markets have resulted in volatility in securities prices.
If securities or industry analysts cease publishing research or reports about us, our business, or our market, or if they change their recommendations, price targets, or forward financial estimates regarding our shares adversely, our share price and trading volume could decline.
The trading market for our ordinary shares will be influenced by the research and reports that industry or securities analysts may publish about us, our business, our market, or our competitors. If any of the analysts who cover us change their recommendation regarding our shares adversely, or provide more favorable relative recommendations about our competitors, our share price would likely decline. If any of the analysts who cover us were to cease coverage or fail to regularly publish reports on us, we could lose visibility in the financial markets, which in turn could cause our share price or trading volume to decline.
As a result of the loss of our emerging growth company status, we no longer are able to take advantage of certain exemptions from various reporting requirements, which will cause us to incur significant legal, accounting and other expenses.
As of June 30, 2014, we determined that we no longer qualify as an emerging growth company as defined in the JOBS Act which means that we are no longer able to take advantage of certain exemptions from various reporting requirements that are applicable to other public companies that are emerging growth companies including, but not limited to, not being required to comply with the auditor attestation requirements of Section 404 for an extended period of time, reduced disclosure obligations regarding executive compensation in our periodic reports and proxy statements, and exemptions from the requirements of holding a nonbinding advisory vote on executive compensation and shareholder approval of any golden parachute payments not previously approved. As a result of such compliance, the regulatory and compliance costs to us may be significantly higher than the cost we would incur as an emerging growth company and therefore, we expect that the loss of emerging growth company status will increase our legal and financial compliance costs and would make some activities highly time consuming and costly.
We do not currently intend to pay dividends on our ordinary shares and, consequently, your ability to achieve a return on your investment will depend on appreciation in the price of our ordinary shares.
We have never declared or paid any cash dividends on our ordinary shares and do not intend to do so for the foreseeable future. We currently intend to retain all available funds and any future earnings to support the operation of, and to finance the growth and development of, our business. Any future determination to declare cash dividends will be made at the discretion of our Board of Directors, subject to compliance with applicable laws (including the Irish Companies Acts which require Irish companies to have profits available for
34
distribution before they can pay dividends) and covenants under current or future credit facilities, which may restrict or limit our ability to pay dividends and will depend on our financial condition, operating results, capital requirements, general business conditions and other factors that our Board of Directors may deem relevant. As a result, a return on your investment may only occur if our share price appreciates.
Provisions contained in our articles of association, as well as provisions of Irish law, could impair a takeover attempt.
Our articles of association and certain provisions of the Irish Companies Acts contain provisions that could have the effect of delaying or preventing changes in control or changes in our management without the consent of our Board of Directors. In addition, our articles of association provide that our Board of Directors is divided into three classes, class I, class II and class III, with each class serving three-year staggered terms so that only one third of our Board of Directors will be subject to re-election in any one year.
There are a number of mechanisms for acquiring an Irish public limited company, including a court-approved scheme of arrangement under the Irish Companies Acts, through a tender offer by a third party and by way of a merger with a company incorporated in the European Economic Area under the European Communities (Cross-Border Mergers) Regulations 2008. Each method requires shareholder approval or acceptance and different thresholds apply.
In addition, we are subject to the Irish Takeover Rules, which will govern a takeover or attempted takeover of the company by means of a court-approved scheme of arrangement or a tender offer. These Rules contain detailed provisions for takeovers including as to disclosure, dealing and timetable.
The Irish Takeover Rules could discourage an investor from acquiring 30% or more of the outstanding ordinary shares of the company unless such investor was prepared to make a bid to acquire all outstanding ordinary shares.
Our Board of Directors may be limited by the Irish Takeover Rules in its ability to defend an unsolicited takeover attempt.
We are subject to the Irish Takeover Rules, under which we will not be permitted to take certain actions which might frustrate an offer for our ordinary shares once our Board of Directors has received an offer, or has reason to believe an offer is or may be imminent, without the approval of more than 50% of shareholders entitled to vote at a general meeting of our shareholders and/or the consent of the Irish Takeover Panel. This could limit the ability of our Board of Directors to take defensive actions even if it believes that such defensive actions would be in the best interests of our company and shareholders.
Irish law differs from the laws in effect in the U.S. and may afford less protection to holders of our securities.
It may not be possible to enforce court judgments obtained in the U.S. against us in Ireland based on the civil liability provisions of the U.S. federal or state securities laws. In addition, there is some uncertainty as to whether the courts of Ireland would recognize or enforce judgments of U.S. courts obtained against us or our directors or officers based on the civil liabilities provisions of the U.S. federal or state securities laws or hear actions against us or those persons based on those laws. We have been advised that the U.S. currently does not have a treaty with Ireland providing for the reciprocal recognition and enforcement of judgments in civil and commercial matters. Therefore, a final judgment for the payment of money rendered by any U.S. federal or state court based on civil liability, whether or not based solely on U.S. federal or state securities laws, would not automatically be enforceable in Ireland.
As an Irish company, we are governed by Irish law, which differs in some material respects from laws generally applicable to U.S. corporations and shareholders, including, among others, differences relating to interested director and officer transactions and shareholder lawsuits. Likewise, the duties of directors and officers
35
of an Irish company generally are owed to the company only. Shareholders of Irish companies generally do not have a personal right of action against directors or other officers of the company and may exercise such rights of action on behalf of the company only in limited circumstances. Accordingly, holders of Fleetmatics Group PLC shares may have more difficulty protecting their interests than would holders of shares of a corporation incorporated in a jurisdiction of the U.S.
The rights of our shareholders may differ from the rights typically offered to shareholders of a U.S. corporation and these differences may make our ordinary shares less attractive to investors.
We are incorporated under Irish law and, therefore, certain of the rights of holders of our shares are governed by Irish law, including the provisions of the Irish Companies Acts, and by our articles of association. These rights differ in certain respects from the rights of shareholders in typical U.S. corporations and these differences may make our ordinary shares less attractive to investors. The principal differences include the following:
| | under Irish law, dividends may only be declared if we have, on an individual entity basis, profits available for distribution, within the meaning of the Irish Companies Acts; |
| | under Irish law, each shareholder generally has preemptive rights to subscribe on a proportionate basis to any issuance of shares. Under U.S. law, shareholders generally do not have preemptive rights unless specifically granted in the certificate of incorporation or otherwise. Pre-emption rights may be disapplied under Irish law for renewable five year periods by Irish companies by way of a provision in their articles of association or special resolution of their shareholders, which is an option we availed ourselves of prior to our initial public offering; |
| | under Irish law, certain matters require the approval of shareholders holding 75% or more of the voting share capital at the general meeting, including amendments to our articles of association. This may make it more difficult for us to complete corporate transactions deemed advisable by our Board of Directors. Under U.S. law, generally only majority shareholder approval is required to amend the certificate of incorporation or to approve other significant transactions; |
| | under Irish law, a bidder seeking to acquire us would need, on a tender offer, to receive shareholder acceptance in respect of 80% of our outstanding shares. If this 80% threshold is not achieved in the offer, under Irish law, the bidder cannot complete a second step merger to obtain 100% control of us. Accordingly, tender of 80% of our outstanding shares is likely to be a condition in a tender offer to acquire us, not 50% as is more common in tender offers for corporations organized under U.S. law; and |
| | under Irish law, shareholders may be required to disclose information regarding their equity interests upon our request, and the failure to provide the required information could result in the loss or restriction of rights attaching to the shares, including prohibitions on the transfer of the shares, as well as restrictions on voting, dividends and other payments. Comparable provisions generally do not exist under U.S. law. |
A future transfer of your ordinary shares, other than one effected by means of the transfer of book entry interests in DTC, may be subject to Irish stamp duty.
Transfers of ordinary shares effected by means of the transfer of book entry interests in the Depositary Trust Company, or DTC, should not be subject to Irish stamp duty. It is anticipated that the majority of ordinary shares will be traded through DTC, either directly or through brokers who hold such ordinary shares on behalf of customers through DTC. However, if you hold your ordinary shares directly rather than beneficially through DTC (or through a broker that holds your ordinary shares through DTC), any transfer of your ordinary shares could be subject to Irish stamp duty (currently at the rate of 1% of the higher of the price paid or the market value of the ordinary shares acquired). Payment of Irish stamp duty is generally a legal obligation of the transferee. The potential for stamp duty to arise could adversely affect the price of our ordinary shares.
36
U.S. Holders of our shares could be subject to material adverse tax consequences if we are considered a passive foreign investment company for U.S. federal income tax purposes.
We do not believe that we are a passive foreign investment company, and we do not expect to become a passive foreign investment company. However, our status in any taxable year will depend on our assets and activities in each year, and because this is a factual determination made annually after the end of each taxable year, there can be no assurance that we will not be considered a passive foreign investment company for the current taxable year or any future taxable year. If we were a passive foreign investment company while a taxable U.S. holder held our shares, such U.S. holder would generally be subject to an interest charge on any deferred taxation and any excess distributions and gain upon the sale of our stock would generally be taxed as ordinary income to such U.S. holder.
| Item 1B. | Unresolved Staff Comments |
None.
| Item 2. | Properties |
Our registered and principal office is located at Block C, Cookstown Court, Belgard Road, Tallaght, Dublin 24, Ireland. Our U.S. headquarters office is located in Waltham, Massachusetts. We own no real estate. We have a lease for 42,912 square feet of office space in Waltham, Massachusetts for our U.S. headquarters which is effective through October 2020. We lease approximately 31,200 square feet of office and warehouse space in Solon, Ohio under operating leases that expire in November 2017. We lease 16,587 square feet of office space in Ireland for our registered office and for our research and development and sales teams under operating leases that expire in May 2022. We have a lease for 2,200 square feet of office space in Templeogue Village, Dublin, which expires in 2036. We lease office space in Rolling Meadows, Illinois, Clearwater, Florida, Charlotte, North Carolina, Scottsdale, Arizona, Sydney, Australia, Reading, Berkshire in the United Kingdom, and Utrecht, the Netherlands for our sales, marketing and customer care organizations under lease agreements that expire at various dates through 2019. We lease office space in Florence, Italy primarily for research and development employees.
| Item 3. | Legal Proceedings |
From time to time, the Company may become subject to legal proceedings, claims and litigation arising in the ordinary course of business. In addition, the Company may receive notification alleging infringement of patent or other intellectual property rights. The Company is not a party to any material legal proceedings, nor is the Company aware of any pending or threatened litigation, that, in its opinion, would have a material adverse effect on its business or its consolidated financial position, results of operations or cash flows should such litigation be resolved unfavorably. The Company accrues contingent liabilities when it is probable that future expenditures will be made and such expenditures can be reasonably estimated.
On May 19, 2014, Rothschild Location Technologies, LLC (Rothschild) filed a complaint against the Company (Rothschild Location Technologies, LLC v. Fleetmatics USA, LLC, Civil Action No. 14-635) in the United States District Court for the District of Delaware alleging infringement of U.S. Patent No. 8,606,503, entitled Device, System and Method for Remotely Entering, Storing and Sharing Addresses for a Positional Information Device. The parties executed an agreement to settle the claims for an amount not material to the business of the Company and on December 1, 2014 Rothschild filed a notice of dismissal with the court dismissing the case with prejudice. All claims have now been paid pursuant to the settlement and the case is now closed.
On December 19, 2013, GPNE Corp. filed a complaint against the Company (GPNE Corp. v. Fleetmatics USA, LLC, Civil Action No. 13-2049) in the United States District Court for the District of Delaware alleging infringement of U.S. Patent No. 7,555,267 entitled Network Communication System Wherein a Node Obtains Resources For Transmitting Data By Transmitting Two Reservation Requests (the 267 Patent) and U.S.
37
Patent No. 8,086,240 (the 240 patent) entitled Data Communication System Using A Reserve Request And Four Frequencies To Enable Transmitting Data Packets Which Can Include A Count Value And Termination Indication Information (the 240 Patent). On May 6, 2014, the parties filed a joint stipulation dismissing the 267 patent with prejudice. On May 7, 2014, GPNE Corp. filed an amended complaint alleging that we infringed the 240 patent and U.S. Patent No. 7,570,954, entitled Communication System Wherein A Clocking Signal From A Controller, A Request From A Node, Acknowledgement Of The Request, And Data Transferred From The Node Are All Provided on Different Frequencies, Enabling Simultaneous Transmission Of These Signals (the 954 Patent). In response to GPNEs amended complaint, we denied infringement, asserted invalidity, and counterclaimed with state-law claims for tortious interference with business relations and unfair competition. On November 12, 2014, the parties filed a joint stipulation dismissing the 240 patent with prejudice. As a result, of the three patents asserted by GPNE, only the 954 patent currently remains in the litigation. GPNE Corp. seeks damages and not an injunction. At this stage of the litigation, the Company is unable to estimate whether a loss is reasonably possible. While the Company does not believe that this litigation will have a material adverse effect on its business, financial condition, operating results, or cash flows, the Company cannot assure you that this will be the case.
| Item 4. | Mine Safety Disclosures |
Not applicable.
38
PART II
| Item 5. | Market for Registrants Common Equity, Related Stockholder Matters and Issuer Purchases of Equity Securities |
Our ordinary shares have been listed and traded on the New York Stock Exchange under the symbol FLTX since our initial public offering. Prior to this time, there was no public market for our ordinary shares.
The following table sets forth, for the periods indicated, the high and low closing sales prices for our ordinary shares on the New York Stock Exchange in dollars, for the past eight quarters:
| High | Low | |||||||
| 2014 |
||||||||
| First Quarter |
$ | 43.66 | $ | 32.06 | ||||
| Second Quarter |
$ | 34.27 | $ | 26.20 | ||||
| Third Quarter |
$ | 35.96 | $ | 29.77 | ||||
| Fourth Quarter |
$ | 38.90 | $ | 28.02 | ||||
| 2013 |
||||||||
| First Quarter |
$ | 27.20 | $ | 23.31 | ||||
| Second Quarter |
$ | 33.99 | $ | 22.28 | ||||
| Third Quarter |
$ | 51.13 | $ | 31.91 | ||||
| Fourth Quarter |
$ | 43.25 | $ | 30.98 | ||||
On January 30, 2015, the last reported sale price for our ordinary shares on the New York Stock Exchange was $35.41 per ordinary share.
Dividend Policy
Fleetmatics currently intends to retain any earnings for its use in its business. We have not paid any cash dividends on our ordinary shares in the last two completed fiscal years and do not currently anticipate paying any cash dividends on our ordinary shares in the foreseeable future.
Stockholders
As of January 30, 2015, there were 7 holders of record of Fleetmatics ordinary shares.
Stock Performance Graph
The following graph compares the total stockholder return on a cumulative basis of $100 invested in Fleetmatics ordinary shares for the period from our initial listing on October 9, 2012 through December 31, 2014 to the Nasdaq Composite Index and the S&P 500 Index, over the same period. The chart assumed the reinvestment of dividends, if any. The graph assumes our closing sales price on October 9, 2012 of $21.90 per share as the initial value of our ordinary shares and not the initial offering price to the public of $17.00 per share.
39
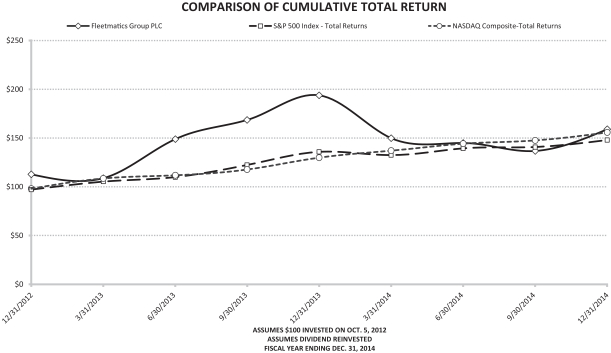
| 12/31/12 | 3/31/13 | 6/30/13 | 9/30/13 | 12/31/13 | 3/31/14 | 6/30/14 | 9/30/14 | 12/31/14 | ||||||||||||||||||||||||||||
| Fleetmatics Group PLC |
112.83 | 108.74 | 149.01 | 168.39 | 193.95 | 150.00 | 145.02 | 136.77 | 159.15 | |||||||||||||||||||||||||||
| Nasdaq Composite Index |
98.17 | 108.59 | 111.75 | 117.61 | 129.97 | 136.93 | 144.20 | 147.43 | 155.83 | |||||||||||||||||||||||||||
| S&P 500 Index |
96.88 | 105.13 | 109.89 | 122.19 | 135.81 | 132.32 | 139.25 | 140.82 | 147.76 | |||||||||||||||||||||||||||
The Stock Performance Graph furnished shall not be deemed filed for purposes of Section 18 of the Exchange Act or otherwise subject to the liabilities of that section, nor shall it be deemed incorporated by reference in any filing under the Exchange Act.
Equity Compensation Plan Information
The information regarding securities authorized for issuance under the Companys equity compensation plans is incorporated herein by reference to an amendment to our Annual Report on Form 10-K to be filed within 120 days of our fiscal year end.
Sales of Unregistered Securities
Not applicable.
Use of Proceeds from Public Offering of Ordinary Shares
On October 4, 2012, our registration statement on Form F-1 (File No. 333-183441) was declared effective for our initial public offering. On October 11, 2012, we closed our initial public offering of 6,250,000 ordinary shares by us and 2,734,375 ordinary shares by selling shareholders at an offering price of $17.00 per share. The managing underwriters of the offering were Barclays Capital Inc., Merrill Lynch, Pierce, Fenner & Smith Incorporated. Following the sale of the shares in connection with the closing of our initial public offering, the offering terminated. As a result of the offering we received net proceeds of approximately $93.3 million, after
40
deducting total expenses of approximately $12.9 million, consisting of underwriting discounts and commissions of $7.4 million and offering-related expenses of $5.5 million. None of such payments were direct or indirect payments to any of our directors or officers or their associates, to persons owning 10% or more of our common stock, or to any of our affiliates. We received no proceeds from the sale of ordinary shares by the selling shareholders.
We used $8.3 million of the net proceeds from our initial public offering to repay certain indebtedness. None of such payments were direct or indirect payments to any of our directors or officers or their associates, to persons owning 10% or more of our common stock, or to any of our affiliates.
On July 25, 2013, our registration statement on Form F-1 (File No. 333-189699) was declared effective for a secondary public offering. On July 30, 2013, we closed this secondary public offering of 1,000,000 ordinary shares by us and 9,925,000 ordinary shares by selling shareholders at an offering price of $33.00 per share. The managing underwriters of the offering were Barclays Capital Inc. and Merrill Lynch, Pierce, Fenner & Smith Incorporated. Following the sale of the shares in connection with the closing of our secondary public offering, the offering terminated. As a result of the offering we received net proceeds of approximately $32.1 million, after deducting underwriting discounts and commissions and offering-related expenses paid by the Company. None of such payments were direct or indirect payments to any of our directors or officers or their associates, to persons owning 10% or more of our common stock, or to any of our affiliates. We received no proceeds from the sale of ordinary shares by the selling shareholders.
We used $6.9 million of the net proceeds from the July 2013 secondary public offering to fund our acquisition of Connect2Field. None of such payments were direct or indirect payments to any of our directors or officers or their associates, to persons owning 10% or more of our common stock, or to any of our affiliates.
There has been no material change in the planned use of proceeds from our initial public offering as described in our final prospectuses filed with the SEC on October 5, 2012 and July 25, 2013 pursuant to Rule 424(b) under the Securities Act.
Purchases of Equity Securities by the Issuer or Affiliated Purchasers
During 2014, the Company purchased 125,534 restricted shares from employees to cover withholding taxes due from the employees at the time the shares vested, 9,241 of these were purchased in the fourth quarter of 2014, at an average price per share of $33.37. The following table provides information about Fleetmatics purchases of restricted shares for the year ended December 31, 2014:
| Total Number of Shares Purchased |
Average Price Paid Per Share |
|||||||
| February 1, 2014February 28, 2014 |
3,368 | $ | 39.15 | |||||
| March 1, 2014March 31, 2014 |
54,028 | $ | 35.58 | |||||
| April 1, 2014April 30, 2014 |
759 | $ | 30.03 | |||||
| May 1, 2014May 31, 2014 |
47,053 | $ | 30.99 | |||||
| June 1, 2014June 30, 2014 |
2,848 | $ | 32.91 | |||||
| July 1, 2014July 31, 2014 |
701 | $ | 32.10 | |||||
| August 1, 2014August 31, 2014 |
1,518 | $ | 34.17 | |||||
| September 1, 2014September 30, 2014 |
6,018 | $ | 32.81 | |||||
| October 1, 2014October 31, 2014 |
6,678 | $ | 28.84 | |||||
| November 1, 2014November 30, 2014 |
759 | $ | 35.30 | |||||
| December 1, 2014December 31, 2014 |
1,804 | $ | 38.67 | |||||
|
|
|
|
|
|||||
| Total |
125,534 | $ | 33.37 | |||||
|
|
|
|
|
|||||
41
| Item 6. | Selected Financial Data |
We derived the consolidated statements of operations data for the years ended December 31, 2014, 2013 and 2012 and the consolidated balance sheet data as of December 31, 2014 and 2013 from our audited consolidated financial statements included elsewhere in this Annual Report on Form 10-K. We derived the consolidated statements of operations data for the years ended December 31, 2011 and 2010 and the consolidated balance sheet data as of December 31, 2011 and 2010 from our audited consolidated financial statements not included in this Annual Report on Form 10-K.
Our historical results are not necessarily indicative of the results to be expected in any future period and should be read in conjunction with the Risk Factors, Managements Discussion and Analysis of Financial Condition and Results of Operations and the consolidated financial statements and related notes included in this Annual Report on Form 10-K.
| Year Ended December 31, | ||||||||||||||||||||
| 2014 | 2013 | 2012 | 2011 | 2010 | ||||||||||||||||
| (In thousands, except per share data) | ||||||||||||||||||||
| Consolidated Statement of Operations Data: |
||||||||||||||||||||
| Subscription revenue |
$ | 231,581 | $ | 177,350 | $ | 127,451 | $ | 92,317 | $ | 64,690 | ||||||||||
| Cost of subscription revenue |
57,505 | 43,858 | 35,507 | 28,631 | 22,941 | |||||||||||||||
|
|
|
|
|
|
|
|
|
|
|
|||||||||||
| Gross profit |
174,076 | 133,492 | 91,944 | 63,686 | 41,749 | |||||||||||||||
| Operating expenses: |
||||||||||||||||||||
| Sales and marketing |
78,885 | 56,589 | 41,138 | 33,391 | 20,447 | |||||||||||||||
| Research and development |
17,090 | 11,036 | 7,379 | 6,021 | 4,061 | |||||||||||||||
| General and administrative |
42,765 | 36,375 | 31,047 | 18,309 | 14,628 | |||||||||||||||
|
|
|
|
|
|
|
|
|
|
|
|||||||||||
| Total operating expenses |
138,740 | 104,000 | 79,564 | 57,721 | 39,136 | |||||||||||||||
|
|
|
|
|
|
|
|
|
|
|
|||||||||||
| Income from operations |
35,336 | 29,492 | 12,380 | 5,965 | 2,613 | |||||||||||||||
| Interest income (expense), net |
(704 | ) | (1,999 | ) | (2,075 | ) | (2,386 | ) | (1,012 | ) | ||||||||||
| Foreign currency transaction gain (loss), net |
832 | (1,139 | ) | (24 | ) | 155 | (907 | ) | ||||||||||||
| Loss on extinguishment of debt |
| | (934 | ) | | | ||||||||||||||
| Other income (expense), net |
(1 | ) | | (32 | ) | | | |||||||||||||
|
|
|
|
|
|
|
|
|
|
|
|||||||||||
| Income before income taxes |
35,463 | 26,354 | 9,315 | 3,734 | 694 | |||||||||||||||
| Provision for (benefit from) income taxes |
7,988 | (4,103 | ) | 3,907 | 865 | 1,430 | ||||||||||||||
|
|
|
|
|
|
|
|
|
|
|
|||||||||||
| Net income (loss) |
27,475 | 30,457 | 5,408 | 2,869 | (736 | ) | ||||||||||||||
| Accretion of redeemable convertible preferred shares to redemption value |
| | (335 | ) | (446 | ) | (418 | ) | ||||||||||||
| Modification of redeemable convertible preferred shares |
| | | | (6,542 | ) | ||||||||||||||
| Net income (loss) attributable to participating securities |
| | | (2,294 | ) | | ||||||||||||||
|
|
|
|
|
|
|
|
|
|
|
|||||||||||
| Net income (loss) attributable to ordinary shareholders |
$ | 27,475 | $ | 30,457 | $ | 5,073 | $ | 129 | $ | (7,696 | ) | |||||||||
|
|
|
|
|
|
|
|
|
|
|
|||||||||||
| Net income (loss) per share attributable to ordinary shareholders(1): |
||||||||||||||||||||
| Basic |
$ | 0.73 | $ | 0.85 | $ | 0.58 | $ | 0.09 | $ | (0.77 | ) | |||||||||
| Diluted |
$ | 0.71 | $ | 0.82 | $ | 0.50 | $ | 0.08 | $ | (0.77 | ) | |||||||||
| Weighted average ordinary shares outstanding(1): |
||||||||||||||||||||
| Basic |
37,473 | 35,722 | 8,822 | 1,497 | 10,051 | |||||||||||||||
| Diluted |
38,552 | 37,140 | 10,085 | 2,078 | 10,051 | |||||||||||||||
42
| Year Ended December 31, | ||||||||||||||||||||
| 2014 | 2013 | 2012 | 2011 | 2010 | ||||||||||||||||
| (dollars in thousands) | ||||||||||||||||||||
| Other Financial and Operating Data: |
||||||||||||||||||||
| Total vehicles under subscription(2) |
552,000 | 445,000 | 331,000 | 237,000 | 172,000 | |||||||||||||||
| Adjusted EBITDA(3) |
$ | 73,946 | $ | 56,472 | $ | 33,886 | $ | 21,748 | $ | 11,171 | ||||||||||
| Net churn(4) |
4.1 | % | 7.9 | % | 6.2 | % | 3.2 | % | (1.3 | )% | ||||||||||
| Year Ended December 31, | ||||||||||||||||||||
| 2014 | 2013 | 2012 | 2011 | 2010 | ||||||||||||||||
| (In thousands) | ||||||||||||||||||||
| Consolidated Balance Sheet Data: |
||||||||||||||||||||
| Cash |
$ | 175,400 | $ | 137,171 | $ | 100,087 | $ | 8,615 | $ | 23,054 | ||||||||||
| Working capital (deficit)(5) |
158,213 | 131,685 | 88,579 | (8,858 | ) | (368 | ) | |||||||||||||
| Total assets |
346,696 | 286,539 | 210,625 | 99,576 | 104,352 | |||||||||||||||
| Total debt (net of discount), including capital lease obligations |
25,440 | 24,391 | 24,767 | 17,986 | 16,881 | |||||||||||||||
| Redeemable convertible preferred shares |
| | | 130,839 | 130,393 | |||||||||||||||
| Total shareholders equity (deficit) |
252,285 | 201,808 | 121,022 | (111,065 | ) | (115,514 | ) | |||||||||||||
| (1) | See Note 16 to our consolidated financial statements for further details on the calculation of basic and diluted net income (loss) per share attributable to ordinary shareholders. |
| (2) | This metric represents the number of vehicles under subscription by our customers utilizing one or more of our fleet management software-as-a-service (SaaS) solutions at the end of the period presented. This number includes the number of vehicles under subscription with SageQuest before and after our acquisition of SageQuest in July 2010. Since our revenue is primarily driven by the number of vehicles under subscription to our SaaS solutions, we believe that total vehicles under subscription is an important metric to monitor. This number excludes any subscriptions associated with Fleetmatics WORK. |
| (3) | We present Adjusted EBITDA in this Annual Report on Form 10-K to provide investors with a supplemental measure of our operating performance. Adjusted EBITDA is a non-GAAP financial measure. We define Adjusted EBITDA as net income (loss) before income taxes, interest income (expense), foreign currency transaction (gain) loss, depreciation and amortization of property and equipment, amortization of capitalized in-vehicle devices owned by customers, amortization of intangible assets, share-based compensation, acquisition-related transaction costs, certain non-recurring litigation and settlement costs, certain non-recurring secondary public offering costs, acquisition-related transaction costs, expenses incurred under our Management Services Agreement dated November 23, 2010, or Management Services Agreement, with Privia Enterprises Limited, or Privia (see Management Discussion and AnalysisPrivia Management Services Agreement), and loss on extinguishment of debt. See Adjusted EBITDA below for more information and for a reconciliation of Adjusted EBITDA to net income (loss), the most directly comparable financial measure calculated and presented in accordance with U.S. generally accepted accounting principles, or GAAP. |
| (4) | We calculate our net churn for a period by dividing (i) the number of vehicles under subscription added from existing customers less vehicles under subscription lost from existing customers over that period by (ii) the total vehicles under subscription at the beginning of that period. When the number of vehicles under subscription added from existing customers exceeds the number of vehicles under subscription lost from existing customers in the period, this formula generates a positive number. SageQuest vehicles under subscription and vehicles under subscription lost are not reflected as part of the churn calculation prior to July 2010 when we acquired it. |
| (5) | We define working capital (deficit) as current assets less current liabilities. |
43
Adjusted EBITDA
To provide investors with additional information regarding our financial results, we have disclosed in the table above and within this Annual Report on Form 10-K Adjusted EBITDA, a non-GAAP financial measure. We define Adjusted EBITDA as net income (loss) before income taxes, interest income (expense), foreign currency transaction (gain) loss, depreciation and amortization of property and equipment, amortization of capitalized in-vehicle devices owned by customers, amortization of intangible assets, share-based compensation, acquisition-related transaction costs, certain non-recurring litigation and settlement costs, certain non-recurring secondary public offering costs, expenses incurred under our Management Services Agreement with Privia, and loss on extinguishment of debt. We have provided a reconciliation below of Adjusted EBITDA to net income (loss), the most directly comparable financial measure presented in accordance with GAAP.
We have included Adjusted EBITDA in this Annual Report on Form 10-K because it is a key measure used by our management and Board of Directors to understand and evaluate our core operating performance and trends, to prepare and approve our annual budget and to develop short and long-term operational plans, and to allocate resources to expand our business. In particular, the exclusion of certain expenses in calculating Adjusted EBITDA can provide a useful measure for period-to-period comparisons of our core business. Additionally, Adjusted EBITDA is a key financial measure used by the compensation committee of our Board of Directors in connection with the payment of bonuses to our executive officers. Accordingly, we believe that Adjusted EBITDA provides useful information to investors and others in understanding and evaluating our operating results in the same manner as our management and Board of Directors.
Our use of Adjusted EBITDA has limitations as an analytical tool, and you should not consider this performance measure in isolation from or as a substitute for analysis of our results as reported under GAAP. Some of these limitations are:
| | although depreciation and amortization are non-cash charges, the assets being depreciated and amortized may have to be replaced in the future, and Adjusted EBITDA does not reflect cash capital expenditure requirements for such replacements or for new capital expenditure requirements; |
| | Adjusted EBITDA does not reflect changes in, or cash requirements for, our working capital needs; |
| | Adjusted EBITDA does not consider the potentially dilutive impact of equity-based compensation; |
| | Adjusted EBITDA does not reflect tax payments that may represent a reduction in cash available to us; |
| | Adjusted EBITDA does not reflect the interest expense or the cash requirements necessary to service interest payments on our debt or any losses on the extinguishment of our debt; |
| | Adjusted EBITDA does not reflect the costs of certain non-recurring litigation and settlement payments; |
| | Adjusted EBITDA does not reflect certain non-recurring secondary public offering costs; |
| | Adjusted EBITDA does not reflect acquisition-related transaction costs; |
| | Adjusted EBITDA does not include foreign currency transaction gains and losses; and |
| | other companies, including companies in our industry, may calculate Adjusted EBITDA differently, which reduces its usefulness as a comparative measure. |
44
Because of these limitations, you should consider Adjusted EBITDA alongside other financial performance measures, including various cash flow metrics, net income (loss) and our other GAAP results. The following unaudited table presents a reconciliation from net income (loss) to Adjusted EBITDA for each of the periods indicated:
| Year Ended December 31, | ||||||||||||||||||||
| 2014 | 2013 | 2012 | 2011 | 2010 | ||||||||||||||||
| (In thousands, except per share data) | ||||||||||||||||||||
| Reconciliation of Net Income (Loss) to Adjusted EBITDA: |
||||||||||||||||||||
| Net income (loss) |
$ | 27,475 | $ | 30,457 | $ | 5,408 | $ | 2,869 | $ | (736 | ) | |||||||||
| Provision for (benefit from) income taxes |
7,988 | (4,103 | ) | 3,907 | 865 | 1,430 | ||||||||||||||
| Interest (income) expense, net |
704 | 1,999 | 2,075 | 2,386 | 1,012 | |||||||||||||||
| Foreign currency transaction (gain) loss, net |
(832 | ) | 1,139 | 24 | (155 | ) | 907 | |||||||||||||
| Depreciation and amortization of property and equipment |
21,492 | 12,994 | 9,547 | 7,581 | 7,397 | |||||||||||||||
| Amortization of capitalized in-vehicle devices owned by customers |
1,123 | 960 | 668 | 344 | 36 | |||||||||||||||
| Amortization of intangible assets |
2,562 | 2,290 | 2,332 | 3,349 | 317 | |||||||||||||||
| Share-based compensation |
13,207 | 7,470 | 2,422 | 2,292 | 149 | |||||||||||||||
| Secondary public offering costs |
| 1,285 | | | | |||||||||||||||
| Litigation and settlements |
(81 | ) | 1,609 | 1,216 | | | ||||||||||||||
| Acquisition-related transaction costs |
308 | 372 | | | 428 | |||||||||||||||
| Management Services Agreement expense |
| | 5,353 | 2,217 | 231 | |||||||||||||||
| Loss on extinguishment of debt |
| | 934 | | | |||||||||||||||
|
|
|
|
|
|
|
|
|
|
|
|||||||||||
| Adjusted EBITDA (unaudited) |
$ | 73,946 | $ | 56,472 | $ | 33,886 | $ | 21,748 | $ | 11,171 | ||||||||||
|
|
|
|
|
|
|
|
|
|
|
|||||||||||
| Item 7. | Managements Discussion and Analysis of Financial Condition and Results of Operations |
You should read the following discussion and analysis of our financial condition and results of operations together with our consolidated financial statements and the related notes and other financial information included elsewhere in this Annual Report on Form 10-K. Some of the information contained in this discussion and analysis or set forth elsewhere in this Annual Report on Form 10-K, including information with respect to our plans and strategy for our business and related financing, includes forward-looking statements that involve risks and uncertainties. You should review the Risk Factors section of this Annual Report on Form 10-K for a discussion of important factors that could cause actual results to differ materially from the results described in or implied by the forward-looking statements contained in the following discussion and analysis.
This Annual Report on Form 10-K contains forward-looking statements that involve risks and uncertainties, as well as assumptions that, if they never materialize or prove incorrect, could cause our results to differ materially from those expressed or implied by such forward-looking statements. The statements contained in this Form 10-K that are not purely historical are forward-looking statements within the meaning of Section 27A of the Securities Act of 1933, and Section 21E of the Securities Exchange Act. Such forward-looking statements include any expectation of earnings, revenue or other financial items; any statements of the plans, strategies and objectives of management for future operations; factors that may affect our operating results; statements related to adding employees; statements related to future capital expenditures; statements related to future economic conditions or performance; statements as to industry trends and other matters that do not relate strictly to historical facts or statements of assumptions underlying any of the foregoing. Forward-looking statements are often identified by the use of words such as, but not limited to, anticipate, believe, can, continue, could, estimate, expect, intend, may, plan, project, seek, should, target, will, would, and similar expressions or variations intended to identify forward-looking statements. These statements are based on the beliefs and assumptions of our management based on information currently
45
available to management. Such forward-looking statements are subject to risks, uncertainties and other important factors that could cause actual results and the timing of certain events to differ materially from future results expressed or implied by such forward-looking statements. Factors that could cause or contribute to such differences include, but are not limited to, those discussed in the section titled Risk Factors in this Annual Report on Form 10-K. We operate in an evolving environment. New risks emerge from time to time, and it is not possible for our management to predict all risks, nor can we assess the effect of all factors on our business or the extent to which any factor, or combination of factors, may cause actual results to differ materially from those contained in any forward-looking statements. Forward-looking statements speak only as of the date of this Annual Report on Form 10-K. Except as required by law, we undertake no obligation to update any forward-looking statements to reflect events or circumstances after the date of such statements.
Overview
Fleetmatics is a leading global provider of mobile workforce solutions delivered as software-as-a-service, or SaaS. Our mobile software platform enables businesses to meet the challenges associated with managing their local fleets of commercial vehicles and improve productivity by extracting actionable business intelligence from vehicle and driver behavioral data. We offer intuitive, cost-effective Web-based and mobile application solutions that provide fleet operators with visibility into vehicle location, fuel usage, speed and mileage and other insights into their mobile workforce, enabling them to reduce operating and capital costs, as well as increase revenue. In addition, we offer an integrated, full-featured mobile workforce management application which provides additional efficiencies related to job management by empowering the field worker and expediting the job completion process from quote through payment. As of December 31, 2014, we had approximately 25,000 customers who collectively deployed our solutions in approximately 552,000 vehicles worldwide. The substantial majority of our customers are small and medium-sized businesses, or SMBs, each of which deploy our solutions in 500 or fewer vehicles. During the year ended December 31, 2014, we collected an average of approximately 62 million data points per day from these vehicles, and we have aggregated over 74 billion data points since our inception, which we believe provides valuable information that we may consider in the development of complementary solutions and additional sources of revenue.
We were founded in 2004 in Dublin, Ireland through a combination of two fleet management companies, WebSoft Ltd. and Moviltec Ltd. Since inception, our software has been designed to be delivered as a hosted, multi-tenant offering, accessed through a Web browser utilizing broadly available in-vehicle devices to transmit vehicle and driver behavioral data to our databases over cellular networks. In July 2010, we completed the acquisition of SageQuest LLC, or SageQuest, in exchange for a cash payment of approximately $37.0 million.
In April 2014, Fleetmatics announced the release of its new software platform and the launch of the three new product offerings with new and, in some cases, patented features: Fleetmatics REVEAL, a business-intelligence based fleet management solution for SMBs; Fleetmatics REVEAL+, which extends Fleetmatics REVEAL to enterprises and is configurable to customers requiring integration capabilities with third-party workflow solutions; and Fleetmatics WORK, a field service management solution. This software platform is an analytics-based, extensible foundation to deliver solutions, features, insights and applications that optimize how a mobile workforce gets work done, and how a business manages those mobile assets. The three product offerings that fall under the software platform offer a solution for service fleet and field service management designed to help businesses maximize their return on fleet and mobile workforce investments.
We derive substantially all of our revenues from subscription agreements to our solutions, which typically include the use of our SaaS fleet management solution and an in-vehicle device. We generate sales through lead-generating Web-based advertising and targeted outbound sales efforts, which we then work to convert into paying customers. Our in-vehicle devices are installed by our network of installation partners. Initial customer contracts are typically 36 months in duration for fleet management customers and 12 months in duration for field service management customers, both with renewal automatically for one-year intervals thereafter, unless the customer elects not to renew. These contract terms provide us with a high degree of visibility into future revenue. Our customer contracts are non-cancelable, and our customers generally are billed on a monthly basis.
46
We have achieved significant revenue growth historically. Our growth has been driven through a combination of selling to new customers, selling additional vehicle subscriptions to existing customers, as their number of vehicles under management increases, as well as selling additional features of our fleet management applications to our existing customers. Our customer acquisition model is designed to be efficient and scalable by focusing on acquiring large volumes of leads primarily through Web-based sales and marketing efforts. Through these efforts, we have successfully driven strong growth in sales among a relatively diverse and distributed SMB customer base. In 2014, 2013 and 2012, our largest customer accounted for approximately 5%, 4%, and 3%, respectively, of our subscription revenue and our top 25 customers represented approximately 14%, 13%, and 11%, respectively, of our subscription revenue.
As we pursue our growth strategy, we will have many opportunities and challenges. One of our key initiatives is to expand our business internationally and we expect to hire additional personnel as we pursue this expansion. We may also complete strategic acquisitions to help us expand our sales and operations internationally. We will have to address additional risks as we pursue this international expansion, including the difficulties of localizing our solutions, competing with local companies as well as the challenge of managing and staffing international operations. We also intend to explore opportunities to capitalize on the data we accumulate from our customers vehicles as we seek ways to monetize this valuable information. Over time, we may experience pressure on pricing as our products become more mature and as competition intensifies in various markets. Each of our strategic initiatives will require expenditure of capital and management focus and we may be unsuccessful as we execute our strategy.
In each quarter since our inception, we have increased our number of customers and the number of vehicles subscribed to our solutions. As of December 31, 2014, we had approximately 552,000 vehicles under subscription, an increase of 24.0% from approximately 445,000 as of December 31, 2013, which was an increase of 34.4% from approximately 331,000 as of December 31, 2012. Our subscription revenue in 2014 grew 30.6% to $231.6 million compared to $177.4 million in 2013, an increase of 39.2% from $127.5 million in 2012. As the business has grown, we have leveraged our scale to negotiate improved pricing associated with application hosting, procurement of in-vehicle devices, telecommunication services and third-party data subscription services. We reported net income in 2014 of $27.5 million as compared to $30.5 million in 2013 and $5.4 million in 2012. Our Adjusted EBITDA in 2014 grew 30.9% to $73.9 million compared to $56.5 million in 2013, an increase of 66.7% from $33.9 million in 2012.
On October 11, 2012, we completed the initial public offering of our ordinary shares, which resulted in the issuance and sale of 6,250,000 ordinary shares by us and the sale of 2,734,375 ordinary shares by selling shareholders at a price of $17.00 per ordinary share. We received net proceeds from the initial public offering of $93.3 million, based upon the initial public offering price of $17.00 per ordinary share and after deducting underwriting discounts and commissions and offering costs paid by us. We received no proceeds from the sale of ordinary shares by the selling shareholders. Upon the closing of our initial public offering, all of our outstanding redeemable convertible preferred shares converted into 26,653,383 ordinary shares.
On January 31, 2013, we completed a follow-on public offering of our ordinary shares which resulted in the sale of 7,700,000 ordinary shares at a price to the public of $25.00 per share. All of the shares sold in the offering were sold by Fleetmatics Investor Holdings, L.P., the principal stockholder of the Company. In addition, certain of the existing shareholders granted the underwriters an option to purchase an additional 1,155,000 ordinary shares. Fleetmatics did not receive any proceeds from the sale of these shares. The expenses of the offering, not including the underwriting discount, were approximately $0.8 million and were paid by us.
On July 30, 2013, we completed a follow-on public offering of our ordinary shares, which resulted in the sale of 1,000,000 ordinary shares by the Company and 9,925,000 ordinary shares by other selling shareholders at a price of $33.00 per ordinary share. The Company received net proceeds from this follow-on offering of $32.1 million, based upon the price of $33.00 per ordinary share and after deducting underwriting discounts and commissions and offering costs paid by the Company. The Company received no proceeds from the sale of ordinary shares by the selling shareholders.
47
On September 23, 2013, we completed a follow-on public offering of our ordinary shares, which resulted in the sale of 5,976,443 ordinary shares by the by other selling shareholders at a price of $46.79 per ordinary share. All of the shares sold in the offering were sold by Fleetmatics Investor Holdings, L.P., the principal stockholder of the Company. In addition, certain of the existing shareholders granted the underwriters an option to purchase an additional 597,644 ordinary shares. Fleetmatics did not receive any proceeds from the sale of these shares.
Key Financial and Operating Metrics
In addition to traditional financial metrics, we monitor the ongoing operation of our business using a number of financially and non-financially derived metrics that are not included in our consolidated financial statements.
| 2014 | 2013 | 2012 | ||||||||||
| Total vehicles under subscription |
552,000 | 445,000 | 331,000 | |||||||||
| Adjusted EBITDA |
$ | 73,946 | $ | 56,472 | $ | 33,886 | ||||||
| Net churn |
4.1 | % | 7.9 | % | 6.2 | % | ||||||
Total vehicles under subscription. This metric represents the number of vehicles managed by our customers utilizing one or more of our SaaS solutions at the end of the period. Since our revenue is primarily driven by the number of vehicles that subscribe to our SaaS solutions, we believe that total vehicles under subscription is an important metric to monitor.
Adjusted EBITDA. We define Adjusted EBITDA as net income (loss) plus provision for (benefit from) income taxes, interest (income) expense, net, foreign currency transaction gain (loss), net, depreciation and amortization of property and equipment, amortization of capitalized in-vehicle-devices owned by customers, amortization of intangible assets, share-based compensation, certain non-recurring litigation and settlement costs, certain non-recurring secondary public offering costs, acquisition-related transaction costs, costs associated with our Management Services Agreement with Privia Enterprises Limited, or Privia, and loss on extinguishment of debt.
We have included Adjusted EBITDA in this Annual Report on Form 10-K because it is a key measure used by our management and Board of Directors to understand and evaluate our core operating performance and trends; to prepare and approve our annual budget and to develop short and long-term operational plans; and to allocate resources to expand our business. In particular, the exclusion of certain expenses in calculating Adjusted EBITDA can provide a useful measure for period-to-period comparisons of our core business. For further explanation of our managements use of this measure, limitations of its use, and a reconciliation of our Adjusted EBITDA to our net income (loss), please see Summary Consolidated Financial DataAdjusted EBITDA.
Net churn. We calculate our net churn for a period by dividing (i) the number of vehicles under subscription added from existing customers less vehicles under subscription lost from existing customers over that period by (ii) the total vehicles under subscription at the beginning of that period. This provides us an appropriate measure of churn as it reflects the stability of our existing customer base before taking into account new customers as existing customers may remain a customer, but decrease the total number of subscribed vehicles at their contractual point of renewal, and conversely, may increase the number of vehicles under subscription at any point of time. When the number of vehicles under subscription added from existing customers exceeds the number of vehicles under subscription lost from existing customers in the period, this formula generates a positive number.
Privia Management Services Agreement
In November 2010, we entered into a consulting and non-compete agreement, or the Management Services Agreement, with Privia, a company controlled by certain of our former shareholders, one of whom continued to serve as a member of our Board of Directors through February 2012. Pursuant to this agreement, in exchange for
48
consulting services to be performed by Privia, we agreed to pay Privia up to $15.0 million in three separate installments if we sold a specified number of subscriptions, measured by unit installation, during each of the twelve months ending March 31, 2012, 2013 and 2014. These payments would be made after the conclusion of each measurement period and were scheduled to be paid as follows: $3.0 million for the period ending March 31, 2012, $5.0 million for the period ending March 31, 2013 and $7.0 million for the period ending March 31, 2014. On August 20, 2012, we paid Privia an aggregate of $7.8 million in full satisfaction of all present and future amounts that were payable by us under the Management Services Agreement. We recorded expense of $5.4 million, $2.2 million, and $0.2 million, respectively, for the years ended December 31, 2012, 2011 and 2010 in relation to this agreement.
Components of Results of Operations
Subscription Revenue
We derive substantially all of our revenue from subscription fees for our solutions, which typically include the use of our SaaS fleet management solution and an in-vehicle device. Our revenue is driven primarily by the number of vehicles under subscription and the price per vehicle under subscription. In addition, we generate revenue by selling our customers additional features, such as our fuel card integration, driving style option, and integration with Global Positioning Satellite, or GPS, navigation devices. We also generate revenue by selling aggregated, anonymous data to traffic subscription service providers.
Our contract terms generally are 36 months for fleet management customers and 12 months for field service management customers for their initial term with automatic annual renewals thereafter, unless the customer elects not to renew. We collect fees from our customers for a ratable portion of the contract on a periodic basis, generally on a monthly basis in advance. Prior to 2011, some customer contracts were paid in advance for the full, multiple-year term. Since that time, our payment terms are typically monthly in advance; however, we continue to enable our customers to prepay all or part of their contractual obligations quarterly, annually or for the full contract term in exchange for a prepayment discount that is reflected in the pricing of the contract.
Cost of Subscription Revenue
Cost of subscription revenue consists primarily of costs related to communications, third-party data and hosting costs (which include the cost of telecommunications charges for data; subscription fees paid to third-party providers of Internet maps; posted speed limit and other data; and costs of hosting of our software applications underlying our product offerings); third-party costs related to the maintenance and repair of installed in-vehicle devices, which we refer to as field service costs; depreciation of in-vehicle devices (including installation and shipping costs related to these devices); amortization of capitalized in-vehicle devices owned by customers; personnel costs (including share-based compensation) of our customer support activities and related to configuration of our solutions to interface with the customers workflow or other internal systems where necessary; amortization expense for internal-use capitalized software costs; amortization of developed technology acquired as part of our acquisition of KKT Srl, or KKT, in May 2014, Connect2Field Holdings Pty Limited, or Connect2Field, in August 2013 and SageQuest in July 2010; amortization of the patent for our vehicle tracking system; and an allocation of occupancy and general office related expenses, such as rent and utilities, based on headcount. We allocate a portion of customer support costs related to assisting in the sales process to sales and marketing expense.
We capitalize the cost of installed in-vehicle devices (including installation and shipping costs related to these devices) and depreciate these costs over the minimum estimated useful life of the devices or over the estimated average customer relationship period, which are both currently six years. If a customer subscription agreement is canceled or expires prior to the end of the expected useful life of the device under contract, the depreciation period is accelerated resulting in the carrying value being expensed in the then-current period. Furthermore, as a result of the decommissioning of its 2G network by one of our primary network providers, we
49
are incurring additional costs as we migrate customers from in-vehicle devices that support 2G networks to in-vehicle devices that support 3G networks. We expect to have the customer migration completed by the end of 2016.
The expenses related to our hosted software applications are only modestly affected by the number of customers who subscribe to our products because of the scalability of our software applications, data expansion and hosting infrastructure. However, many of the other components of our cost of subscription revenue, such as depreciation of in-vehicle devices and installation and shipping costs related to these devices, communications expense and subscription fees paid to our Internet map providers and for other third-party data are variable costs affected by the number of vehicles subscribed by customers.
We expect that the cost of subscription revenue in absolute dollars may increase in the future depending on the growth rate of subscription sales to new and existing customers and our resulting need to service and support those customers. We also expect that cost of subscription revenue as a percentage of subscription revenue will fluctuate from period to period.
Sales and Marketing
Sales and marketing expenses consist primarily of wages and benefits (including share-based compensation) for sales and marketing personnel, including the amortization of deferred commissions and travel related expenses; advertising and promotional costs; and an allocation of occupancy and general office related expenses, such as rent and utilities, based on headcount. Also included in our sales and marketing expenses is the amortization of the value of customer relationships and trademarks acquired as part of our SageQuest acquisition in 2010. Advertising costs consist primarily of pay-per-click advertising with search engines, other online and offline advertising media, as well as the costs to create and produce these advertisements. Advertising costs are expensed as incurred. We capitalize commission costs that are incremental and directly related to the acquisition of new customer contracts or renewals. For the majority of our customer contracts, we pay commissions in full when we receive the initial customer contract for a new subscription or a renewal subscription. For all other customer contracts, we pay commissions in full when we receive the initial customer payment for a new subscription or a renewal subscription. Commission costs are capitalized upon payment and are amortized as expense ratably over the term of the related non-cancelable customer contract, in proportion to the recognition of the subscription revenue. If a subscription agreement is terminated, the unamortized portion of any deferred commission cost is recognized as an expense immediately.
We plan to continue to invest in sales and marketing in order to drive growth in our sales and continue to build brand and category awareness. We expect sales and marketing expenses to increase in absolute dollars and to continue to be our largest operating expense in absolute dollars and as a percentage of subscription revenue, although they may fluctuate as a percentage of subscription revenue.
Research and Development
Research and development expenses consist primarily of wages and benefits (including share-based compensation) for product management and development personnel, costs of external consultants, and, to a lesser extent, an allocation of occupancy and general office related expenses, such as rent and utilities, based on headcount. We have focused our research and development efforts on improving ease of use, functionality and technological scalability of our existing products as well as on expanding and developing new offerings. The majority of our research and development employees are located in our development center in Ireland. Therefore, a majority of research and development expense is subject to fluctuations in foreign exchange rates. Research and development costs are expensed as incurred, except for certain internal-use software development costs that qualify for capitalization, such as costs related to software enhancements that add functionality, which are capitalized and amortized over their estimated useful life.
50
We believe that continued investment in our technology is important for our future growth, and as a result, we expect research and development expenses to increase in absolute dollars, although they may fluctuate as a percentage of subscription revenue.
General and Administrative
General and administrative expenses consist primarily of wages and benefits (including share-based compensation) for administrative services, human resources, internal information technology support, executive, legal, finance and accounting personnel; professional fees; expenses for business application software licenses; non-income related taxes; other corporate expenses, such as insurance; bad debt expenses; and an allocation of occupancy and general office related expenses, such as rent and utilities, based on headcount. Also included within our general and administrative expenses through 2012 are costs related to the Management Services Agreement we entered into in November 2010 with Privia, which was terminated on August 20, 2012.
We expect that general and administrative expenses will increase as we continue to add personnel in connection with the anticipated growth of our business.
Interest Income (Expense), net
Interest income (expense), net consists primarily of interest expense on our outstanding debt as well as on our capital lease obligations.
Foreign Currency Transaction Gain (Loss), net
Foreign currency transaction gain (loss), net consists primarily of the net unrealized gains and losses recognized upon revaluing the foreign currency-denominated intercompany payables and receivables of our various subsidiaries at each balance sheet date. To a lesser extent, foreign currency transaction gain (loss), net also consists of the transaction gains and losses recorded to revalue the foreign currency-denominated customer accounts receivable and vendor payables recorded by our subsidiaries that transact in currencies other than their functional currency. We currently do not engage in hedging activities related to our foreign currency-denominated intercompany balances or our customer receivables and other payables; as such, we cannot predict the impact of future foreign currency transaction gains and losses on our operating results. See Item 7AQuantitative and Qualitative Disclosures about Market Risk.
Provision for (Benefit from) Income Taxes
Provision for (benefit from) income taxes consists primarily of taxes in Ireland, the United States and the United Kingdom. There are two main drivers of our annual effective tax rate. First, as a multi-national company, we are subject to tax in various jurisdictions which apply various statutory rates of tax to our income. Each of these jurisdictions has its own tax law which is subject to interpretation on a jurisdiction by jurisdiction basis. In Ireland, our operating entity is subject to tax at a 12.5% tax rate and our non-operating entities are subject to tax at a 25% tax rate, while our foreign subsidiaries in the United States and the United Kingdom are subject to tax rates of approximately 39% and 22%, respectively. Second, as a result of our global business model, we engage in a significant number of cross-border intercompany transactions. As a result of these transactions, we have recorded reserves for uncertain tax positions related to how the different jurisdictions may conclude on the tax treatment of the transaction and how we might settle those exposures. There is no guarantee that how one jurisdiction might view a particular transaction will be respected by another jurisdiction. Additionally, there may be instances where our income is subject to taxation in more than one jurisdiction.
Critical Accounting Policies
Our consolidated financial statements are prepared in accordance with accounting principles generally accepted in the United States. The preparation of our financial statements and related disclosures requires us to make estimates, assumptions and judgments that affect the reported amount of assets, liabilities, revenue, costs
51
and expenses, and related disclosures. We believe that the estimates, assumptions and judgments involved in the accounting policies described below may have the greatest potential impact on our financial statements and, therefore, consider these to be our critical accounting policies. Accordingly, we evaluate our estimates and assumptions on an ongoing basis. Our actual results may differ from these estimates under different assumptions and conditions. See also Note 2 of our consolidated financial statements included elsewhere in this Annual Report for information about these critical accounting policies as well as a description of our other significant accounting policies.
Revenue Recognition
We provide access to our software through subscription arrangements whereby our customers are charged a per subscribed-vehicle fee for access for a specified term. Subscription agreements contain multiple service elements and deliverables, including installation of in-vehicle devices, access to our on-demand software via our website, and support services delivered over the term of the arrangement. Agreements do not provide customers the right to take possession of the software at any time. We have determined that the elements of our subscription agreements do not have value to the customer on a standalone basis. As a result, the multiple elements within our subscription agreements do not qualify for treatment as separate units of accounting. Accordingly, we account for all fees received under our subscription agreements as a single unit of accounting and, except for any up-front fees, recognize the total fee amount ratably on a daily basis over the term of the subscription agreement. We only commence recognition of revenue when there is persuasive evidence of an arrangement, the fee is fixed or determinable, collectibility is deemed reasonably assured, and recurring services have commenced. Our initial subscription agreements typically have contract terms of 36 months for fleet management customers and 12 months for field service management customers.
For the limited number of fleet management customer arrangements in which title to the in-vehicle devices transfers to the customer upon delivery or installation of the in-vehicle device, we receive an up-front fee from the customer. As the in-vehicle devices do not have value to the customer on a standalone basis, the delivery or installation of the in-vehicle devices does not represent the culmination of a separate earning process associated with the payment of the up-front fee. Accordingly, we record the amount of the up-front fee as deferred revenue upon invoicing and recognize that amount as revenue ratably on a daily basis over the estimated average customer relationship period of six years, which is longer than the typical subscription agreement term of 36 months. If a customer permanently ceases use of our subscription service at any point when a balance of deferred revenue from this up-front payment exists, we recognize the remaining balance of the deferred revenue in the period of notification. Changes in the typical customer contractual term, customer behavior, competition or economic conditions could affect our estimates of the average customer relationship period. We review the estimated average customer relationship period on a periodic basis and account for changes prospectively.
Deferred revenue represents amounts billed to customers or payments received from customers for which revenue has not yet been recognized. Deferred revenue primarily consists of prepayments made by customers for future periods and, to a lesser extent, the unearned portion of monthly billed subscription fees and up-front payments from customers for in-vehicle devices whose ownership transfers to them upon delivery or installation.
Allowance for Doubtful Accounts
Accounts receivable are carried at their original invoice amounts less an allowance for doubtful collections based on estimated losses resulting from the inability or unwillingness of customers to make required payments. We estimate the allowance at each reporting period based upon historical loss patterns, the number of days that billings are past due and an evaluation of the potential risk of loss associated with specific delinquent accounts. We also consider any changes to the financial condition of our customers and any other external market factors that could impact the collectibility of our receivables in the determination of our allowance for doubtful accounts.
52
Income Taxes
As part of the process of preparing our consolidated financial statements, we are required to calculate our income tax expense based on taxable income by jurisdiction. There are many transactions and calculations about which the ultimate tax outcome is uncertain; as a result, our calculations involve estimates by management. Some of these uncertainties arise as a consequence of transfer pricing arrangements among our related entities and the differing tax treatment of revenue and cost items across various jurisdictions. If we were compelled to revise or to account differently for our arrangements, that revision could affect our tax liability.
We account for uncertainty in income taxes recognized in our financial statements by applying a two-step process to determine the amount of tax benefit to be recognized. First, the tax position must be evaluated to determine the likelihood that it will be sustained upon examination by the taxing authorities, based on the technical merits of the position. If the tax position is deemed more-likely-than-not to be sustained, the tax position is then assessed to determine the amount of benefit to recognize in the financial statements. The amount of the benefit that may be recognized is the largest amount that has a greater than 50% likelihood of being realized upon ultimate settlement. Our provision for income taxes includes the effects of any resulting tax reserves, or unrecognized tax benefits, that are considered appropriate as well as the related net interest and penalties. Although we believe that we have adequately reserved for our uncertain tax positions, we can provide no assurance that the final tax outcome of these matters will not be materially different. We make adjustments to these reserves when facts and circumstances change, such as the closing of a tax audit or the refinement of an estimate. To the extent that the final tax outcome of these matters is different than the amounts recorded, such differences will affect the provision for income taxes in the period in which such determination is made and could have a material impact, either favorable or unfavorable, on our consolidated financial condition and operating results. At December 31, 2014, 2013 and 2012, the balances recorded as liabilities for unrecognized tax benefits in our consolidated balance sheets totaled $3.2 million, $2.1 million and $14.6 million, respectively, including accrued interest and penalties.
The income tax accounting process also involves estimating our actual current tax liability, together with assessing temporary differences resulting from differing treatment of items for tax and accounting purposes. These temporary differences result in deferred tax assets and liabilities, which are included within our consolidated balance sheets. Deferred taxes are determined based on the difference between the financial statement and tax basis of assets and liabilities using enacted tax rates in effect in the years in which the differences are expected to reverse. Changes in deferred tax assets and liabilities are recorded in the provision for income taxes. Our net deferred tax assets currently are comprised of net operating loss carryforwards in the United States and the United Kingdom as well as deductible temporary differences. As of December 31, 2014, our federal net operating loss carryforwards in the United States available to reduce future federal taxable income totaled $9.5 million, our state net operating loss carryforwards in the United States available to reduce future state taxable income totaled $4.6 million, and our net operating loss carryforwards in the United Kingdom available to reduce future taxable income totaled $1.2 million. We assess the likelihood that our deferred tax assets will be recovered from future taxable income and, to the extent we believe, based upon the weight of available evidence, that it is more likely than not that all or a portion of deferred tax assets will not be realized, we establish a valuation allowance as a charge to income tax expense. We evaluate valuation allowances for deferred tax assets at the individual subsidiary level or consolidated tax group level in accordance with the tax law in the specific jurisdiction. In estimating future taxable profits, we consider all current contracts and assets of the business, including intercompany transfer pricing agreements, as well as a reasonable estimation of future taxable profits achievable by us. With respect to our subsidiaries in the United States, which file a consolidated group tax return for federal and state tax purposes and are in a three-year cumulative pre-tax income position as a result of current year pre-tax profit, we have concluded that there is sufficient positive evidence that we do not need to establish a valuation allowance against our net operating loss deferred tax asset, nor a valuation allowance against our other (non-NOL) deferred tax assets, given our future forecasted income and the relatively long carryforward periods permitted for net operating losses in the United States. In arriving at this conclusion, we forecasted future income in the United States using fiscal year 2014 results as a base, then adjusted for verifiable evidence of known reductions in certain future expenses, including amortization expense from
53
acquired intangible assets and interest expense, which will be lower in the future due to lower borrowing rates as a result of our credit facility entered into in May 2012. We believe that the future earnings forecasts combined with the lengthy carryforward period of the net operating loss carryforwards would produce sufficient taxable income in our subsidiaries in the United States to fully realize the deferred tax assets before expiration of the U.S. federal and state carryforward periods, which expire from 2026 through 2033 for federal purposes and from 2020 to 2033 for state purposes. Accordingly, we have not recorded a valuation allowance for the net operating loss carryforwards in the United States as of December 31, 2014, 2013 and 2012. The Company has recorded a valuation allowance in Australia and certain Irish entities against the net operating loss carryforward. Our net deferred tax assets at December 31, 2014 totaled $13.8 million, comprised of deferred tax assets of $20.6 million, partially offset by deferred tax liabilities of $3.9 million and a valuation allowance of $2.9 million. Our net deferred tax assets at December 31, 2013 totaled $5.3 million, comprised of deferred tax assets of $18.3 million, partially offset by deferred tax liabilities of $10.0 million and a valuation allowance of $3.0 million. Our net deferred tax assets at December 31, 2012 totaled $6.2 million, comprised of deferred tax assets of $18.2 million, partially offset by deferred tax liabilities of $9.5 million and a valuation allowance of $2.5 million.
Internal-Use Software
We expense research and development costs as incurred, except for certain costs which are capitalized in connection with our internal-use software and website. These capitalized costs are primarily related to the application software that is hosted by us and accessed by our customers through our website. In addition, we capitalize certain general and administrative costs related to the customization and development of our internal business systems.
Costs incurred in the preliminary stages of development are expensed as incurred. Once an application has reached the development stage, internal and external costs, if direct and incremental, are capitalized until the software is substantially complete and ready for its intended use. Capitalization ceases upon completion of all substantial testing performed to ensure the product is ready for its intended use. We also capitalize costs related to specific upgrades and enhancements of this application software when it is probable that the expenditures will result in additional functionality. Maintenance and training costs are expensed as incurred. Capitalized internal-use software costs are recorded as part of property and equipment and are amortized on a straight-line basis over an estimated useful life of three years. At December 31, 2014, 2013 and 2012, the carrying value of our internal-use software was $5.2 million, $3.2 million and $1.3 million, respectively.
Business Combinations
In an acquisition of a business, we recognize separately from goodwill the fair value of assets acquired and liabilities assumed. Goodwill as of the acquisition date is measured as the excess of consideration transferred over the net of the acquisition-date fair values of the assets acquired and liabilities assumed. In determining the fair value of assets acquired and liabilities assumed in a business combination, we primarily use recognized valuation methods such as an income approach or a cost approach and apply present value modeling. Our significant estimates in the income or cost approach include identifying business factors such as size, growth, profitability, risk and return on investment and assessing comparable revenue and operating income multiples in estimating the fair value. Further, we make certain assumptions within present value modeling valuation techniques including risk-adjusted discount rates, future price levels, rates of increase in operating expenses, weighted average cost of capital, rates of long-term growth and effective income tax rates. We believe that the estimated fair value assigned to the assets acquired and liabilities assumed are based on reasonable assumptions that marketplace participants would use. While we use our best estimates and assumptions as a part of the process to accurately value assets acquired and liabilities assumed at the acquisition date, our estimates are inherently uncertain and actual results could differ from those estimates.
In addition, uncertain tax positions assumed and valuation allowances related to the net deferred tax assets acquired in connection with a business combination are estimated as of the acquisition date and recorded as part of the purchase. Thereafter, any changes to these uncertain tax positions and valuation allowances are recorded as part of the provision for income taxes in our consolidated statement of operations.
54
Impairment of Goodwill
We record goodwill when the consideration paid in a business acquisition exceeds the fair value of the net tangible assets acquired, identifiable intangible assets acquired and liabilities assumed. Goodwill is not amortized, but rather is tested for impairment annually or more frequently if events or circumstances occur that indicate an impairment may exist. Factors we consider important that could trigger an impairment review include significant underperformance relative to historical or projected future operating results, significant changes in our use of the acquired assets in a business combination or the strategy for our overall business, and significant negative industry or economic trends. We perform our annual assessment for impairment of goodwill on October 31 and have determined that we have a single reporting unit for testing goodwill for impairment. For purposes of assessing potential impairment, we first estimate the fair value of the reporting unit (based on the fair value of our outstanding ordinary shares) and compare that amount to the carrying value of the reporting unit (as reflected by the total carrying values of our shareholders equity). If we determine that the carrying value of the reporting unit exceeds its fair value, then we determine the implied fair value of the goodwill in the same manner used to determine the amount of goodwill in a business combination. We have assigned the entire balance of goodwill to our one reporting unit. The fair value of the reporting unit was based on our market capitalization as of each of December 31, 2014 and 2013, and it was substantially in excess of the carrying value of the reporting unit at each date. If the carrying value of goodwill exceeds the implied fair value of the goodwill, an impairment charge is recognized in the amount equal to that excess. No goodwill impairment charges were recorded by us during the years ended December 31, 2014, 2013 and 2012.
Impairment of Long-Lived Assets
Long-lived assets include property and equipment and definite-lived intangible assets subject to amortization, including customer relationships, trademarks, acquired developed technology and a patent for our vehicle tracking system. We amortize customer relationships, trademarks and acquired developed technology over their estimated useful lives, which range from three to nine years, based on either a straight-line method or the pattern over which we expect to consume the economic benefit of each asset, which in general reflects the expected cash flow from each asset. We amortize our patent over its useful life of 20 years on a straight-line basis, as the pattern of consumption of the economic benefit of the asset cannot be reliably determined. We amortize property and equipment, inclusive of internal-use software, on a straight-line basis over their useful lives, which range from three to six years, as the pattern of consumption of the economic benefit of the assets cannot be reliably determined. We evaluate our long-lived assets for recoverability whenever events or changes in circumstances indicate that their carrying values may not be recoverable. Factors that we consider in deciding when to perform an impairment review include significant underperformance of a business or product line in relation to expectations, significant negative industry or economic trends, and significant changes or planned changes in our use of the assets. To evaluate a long-lived asset for recoverability, we compare forecasts of undiscounted cash flows expected to result from the use and eventual disposition of the long-lived asset to its carrying value. If the carrying value exceeds the sum of the expected undiscounted cash flows, an impairment loss on the long-lived asset to be held and used is recognized based on the excess of the assets carrying value over its fair value, determined based on discounted cash flows. Long-lived assets to be disposed of are reported at the lower of carrying value or fair value less cost to sell.
Deferred Commissions
We capitalize commission costs that are incremental and directly related to the acquisition of customer contracts. For the majority of its customer contracts, the Company pays commissions in full when it receives the initial customer contract for a new subscription or a renewal subscription. For all other customer contracts, the Company pays commissions in full when it receives the initial customer payment for a new subscription or a renewal subscription. Commission costs are capitalized upon payment and are amortized as expense ratably over the term of the related non-cancelable customer contract, in proportion to the recognition of the subscription revenue. If a subscription agreement is terminated, the unamortized portion of any deferred commission cost is recognized as expense immediately. We believe that capitalizing commission costs is the preferable method of
55
accounting as the commission charges are so closely related to the revenue from the non-cancelable customer contracts that they should be recorded as an asset and charged to expense over the same period that the subscription revenue is recognized. Deferred commission costs are included in other current and long-term assets in our consolidated balance sheets and totaled $15.5 million, $11.7 million and $8.9 million at December 31, 2014, 2013 and 2012 respectively. Amortization of deferred commissions is included in sales and marketing expense in our consolidated statements of operations.
Capitalization of In-Vehicle Device Costs
For customer arrangements in which we retain ownership of the in-vehicle devices installed in a customers fleet, we capitalize the cost of the in-vehicle devices (including installation and shipping costs) as a component of property and equipment in our consolidated balance sheets, and we depreciate these assets on a straight-line basis over their estimated useful life, which is currently six years. If a customer subscription agreement is canceled or expires prior to the end of the expected useful life of the in-vehicle device, the carrying value of the asset is depreciated in full with expense immediately recorded as cost of subscription revenue. The carrying value of these installed in-vehicle devices (including installation and shipping costs) was $61.8 million, $48.4 million and $34.1 million at December 31, 2014, 2013, and 2012, respectively. Depreciation expense of these installed in-vehicle devices is included in cost of subscription revenue in our consolidated statements of operations.
In addition, for the limited number of customer arrangements in which title to the in-vehicle devices transfers to the customer upon delivery or installation of the in-vehicle device (for which we receive an up-front fee from the customer), we defer the costs of the in-vehicle devices (including installation and shipping costs) as they are directly related to the revenue that we derive from the sale of the devices and that we recognize ratably over the estimated average customer relationship period of six years. We capitalize these in-vehicle device costs and amortize the deferred costs as expense ratably over the estimated average customer relationship period, in proportion to the recognition of the up-front fee revenue. Capitalized costs related to these in-vehicle devices of which title has transferred to customers are included in other current and long-term assets in our consolidated balance sheets which totaled $2.4 million, $3.8 million and $4.1 million at December 31, 2014, 2013 and 2012, respectively. Amortization of these capitalized costs is included in cost of subscription revenue in our consolidated statements of operations.
Share-Based Compensation
We measure stock options granted to employees and directors at fair value on the date of grant and recognize the corresponding compensation expense of those awards, net of estimated forfeitures, over the requisite service period, which is generally the vesting period of the respective award. The straight-line method is applied to all awards with service conditions, while the graded-vesting method is applied to all awards with both service and performance conditions.
The fair value of each stock option grant is estimated on the date of grant using the Black-Scholes option-pricing model. We have historically been a private company and lack company-specific historical and implied volatility information. Therefore, we estimate our expected volatility based on the historical volatility of our publicly traded peer companies and expect to continue to do so until such time as we have adequate historical data regarding the volatility of our traded stock price. The expected term of options has been determined utilizing the simplified method for awards that qualify as plain-vanilla options. The risk-free interest rate is determined by reference to the U.S. Treasury yield curve in effect at the time of grant of the award for time periods approximately equal to the expected term of the award. Expected dividend yield is based on the fact that we have never paid cash dividends and do not expect to pay any cash dividends in the foreseeable future. The assumptions we used to determine the fair value of stock options granted are as follows, presented on a weighted average basis:
| 2012 | ||||
| Risk-free interest rate |
0.63 | % | ||
| Expected term (in years) |
4.1 | |||
| Expected volatility |
56 | % | ||
| Expected dividend yield |
0 | % | ||
56
These assumptions represented our best estimates, but the estimates involve inherent uncertainties and the application of our judgment. As a result, if factors change and we use significantly different assumptions or estimates, our share-based compensation expense could be materially different. We recognize compensation expense for only the portion of awards that are expected to vest. In developing a forfeiture rate estimate, we have considered our historical experience to estimate pre-vesting forfeitures for awards with service conditions. For awards with performance conditions, we estimate the probability that the performance condition will be met. If our actual forfeiture rate is materially different from the estimate, our share-based compensation expense could be significantly different from what we have recorded in the current period. The Company did not grant any stock options to employees in the years ended December 31, 2014 and 2013.
Valuations of ordinary shares
Since completion of our initial public offering in October 2012, we have valued our ordinary shares in connection with the issuance of share-based payment awards using the closing price of our ordinary shares on the New York Stock Exchange on the date of the grant.
Results of Operations
The following table presents our results of operations in thousands of dollars and as a percentage of subscription revenue for each of the periods indicated (certain items may not foot due to rounding).
| Year Ended December 31, | ||||||||||||||||||||||||
| 2014 | 2013 | 2012 | ||||||||||||||||||||||
| Amount | Percent of Revenue |
Amount | Percent of Revenue |
Amount | Percent of Revenue |
|||||||||||||||||||
| Subscription revenue |
$ | 231,581 | 100.0 | % | $ | 177,350 | 100.0 | % | $ | 127,451 | 100.0 | % | ||||||||||||
| Cost of subscription revenue |
57,505 | 24.8 | 43,858 | 24.7 | 35,507 | 27.9 | ||||||||||||||||||
|
|
|
|
|
|
|
|
|
|
|
|
|
|||||||||||||
| Gross profit |
174,076 | 75.2 | 133,492 | 75.3 | 91,944 | 72.1 | ||||||||||||||||||
|
|
|
|
|
|
|
|
|
|
|
|
|
|||||||||||||
| Operating expenses: |
||||||||||||||||||||||||
| Sales and marketing |
78,885 | 34.1 | 56,589 | 31.9 | 41,138 | 32.3 | ||||||||||||||||||
| Research and development |
17,090 | 7.4 | 11,036 | 6.2 | 7,379 | 5.8 | ||||||||||||||||||
| General and administrative |
42,765 | 18.5 | 36,375 | 20.5 | 31,047 | 24.3 | ||||||||||||||||||
|
|
|
|
|
|
|
|
|
|
|
|
|
|||||||||||||
| Total operating expenses |
138,740 | 59.9 | 104,000 | 58.6 | 79,564 | 62.4 | ||||||||||||||||||
|
|
|
|
|
|
|
|
|
|
|
|
|
|||||||||||||
| Income from operations |
35,336 | 15.3 | 29,492 | 16.6 | 12,380 | 9.7 | ||||||||||||||||||
| Interest income (expense), net |
(704 | ) | (0.3 | ) | (1,999 | ) | (1.1 | ) | (2,075 | ) | (1.6 | ) | ||||||||||||
| Foreign currency transaction gain (loss), net |
832 | 0.4 | (1,139 | ) | (0.6 | ) | (24 | ) | | |||||||||||||||
| Loss on extinguishment of debt |
| | | | (934 | ) | (0.7 | ) | ||||||||||||||||
| Other income (expense), net |
(1 | ) | | | | (32 | ) | | ||||||||||||||||
|
|
|
|
|
|
|
|
|
|
|
|
|
|||||||||||||
| Income before income taxes |
35,463 | 15.3 | 26,354 | 14.9 | 9,315 | 7.3 | ||||||||||||||||||
| Provision for (benefit from) income taxes |
7,988 | 3.4 | (4,103 | ) | (2.3 | ) | 3,907 | 3.1 | ||||||||||||||||
|
|
|
|
|
|
|
|
|
|
|
|
|
|||||||||||||
| Net income |
$ | 27,475 | 11.9 | % | $ | 30,457 | 17.2 | % | $ | 5,408 | 4.2 | % | ||||||||||||
|
|
|
|
|
|
|
|
|
|
|
|
|
|||||||||||||
Comparison of Years Ended December 31, 2014, 2013 and 2012
Subscription Revenue
| Year Ended December 31, | ||||||||||||
| 2014 | 2013 | 2012 | ||||||||||
| (dollars in thousands) | ||||||||||||
| Subscription revenue |
$ | 231,581 | $ | 177,350 | $ | 127,451 | ||||||
| % change from prior year |
30.6 | % | 39.2 | % | ||||||||
57
Subscription revenue increased by $54.2 million, or 30.6%, for the year ended December 31, 2014 as compared to the year ended December 31, 2013. This revenue growth was primarily driven by the increase in the average number of vehicles under subscription, which grew by approximately 24.0% year-over-year. As of the year-ends, the number of vehicles under subscription increased to approximately 552,000 as of December 31, 2014 as compared to 445,000 as of December 31, 2013. The increase in vehicles under subscription was due in large part to our investment in sales and marketing of our branded solutions and international expansion, including the addition of 75 sales and marketing personnel year-over-year. Our average selling prices generally remained stable, while volume increased in 2014 as compared to 2013.
Subscription revenue increased by $49.9 million, or 39.2%, for the year ended December 31, 2013 as compared to the year ended December 31, 2012. This revenue growth was primarily driven by the increase in the average number of vehicles under subscription, which grew by approximately 34.4% year-over-year. As of the year-ends, the number of vehicles under subscription increased to approximately 445,000 as of December 31, 2013 as compared to 331,000 as of December 31, 2012. The increase in vehicles under subscription was due in large part to our investment in sales and marketing of our branded solutions, including the addition of 78 sales and marketing personnel year-over-year. Our average selling prices generally remained stable, while volume increased in 2013 as compared to 2012.
Cost of Subscription Revenue
| Year Ended December 31, | ||||||||||||
| 2014 | 2013 | 2012 | ||||||||||
| (dollars in thousands) | ||||||||||||
| Cost of subscription revenue |
$ | 57,505 | $ | 43,858 | $ | 35,507 | ||||||
| % change from prior year |
31.1 | % | 23.5 | % | ||||||||
| Percentage of subscription revenue |
24.8 | % | 24.7 | % | 27.9 | % | ||||||
Cost of subscription revenue increased by $13.6 million for the year ended December 31, 2014 as compared to the year ended December 31, 2013. The increase was primarily due to an increase in variable expenses resulting from an increase in the average number of vehicles under subscription, which grew approximately 24.0% year-over-year. Communications, third-party data and hosting costs increased by $2.6 million due to the increase in the number of installed in-vehicle devices, comprised of an increase in hosting costs for our software applications of $1.6 million and in third-party data subscription fees and data communication costs of $1.0 million. Field service costs for maintenance and repair of installed in-vehicle devices increased by $0.4 million primarily due to the increase in number of vehicles under subscription. Depreciation and amortization of installed in-vehicle devices increased by $6.7 million primarily due to the increase in the number of vehicles under subscription as well as additional costs incurred due to the migration of some of our customers from 2G to 3G networks. Payroll and related expenses increased by $2.0 million primarily due to an increase in our customer support and configuration groups. Facilities expense increased by $0.7 million as a result of increased office space requirements for our additional employees. Amortization of internal-use software increased by $0.6 million as a result of increased capitalized costs period-over-period related to our internal-use software applications accessed by our customers through our website. Amortization of acquired developed technology increased by $0.6 million primarily due to amortization related to the intangible assets acquired in the KKT and Connect2Field acquisitions.
As a percentage of subscription revenue, our cost of subscription revenue of 24.8% for the year ended December 31, 2014 remained flat with 24.7% for the year ended December 31, 2013. We continue to negotiate improved pricing for our subscriber-based costs, such as the cost of in-vehicle devices, data communication charges and third-party data subscription fees, including those for mapping and posted speed limit data and have achieved improved economies of scale from our hosting activities and configuration personnel as these components of our costs result in minimal incremental cost per vehicle under subscription. The economies of scale achieved through this improved pricing was offset by increased depreciation and amortization of installed
58
in-vehicle devices primarily due to the increase in the number of vehicles under subscription as well as additional costs incurred due to the migration of some of our customers from in-vehicle devices that support 2G networks to in-vehicle devices that support 3G networks.
Cost of subscription revenue increased by $8.4 million for the year ended December 31, 2013 as compared to the year ended December 31, 2012. The increase was primarily due to an increase in variable expenses resulting from an increase in the average number of vehicles under subscription, which grew approximately 34.4% year-over-year. Communications, third-party data and hosting costs increased by $1.2 million due to the increase in the number of installed in-vehicle devices, comprised of an increase in hosting costs for our software applications of $1.0 million and in third-party data subscription fees and data communication costs of $0.2 million. Field service costs for maintenance and repair of installed in-vehicle devices increased by $2.5 million primarily due to the increase in number of vehicles under subscription. Depreciation and amortization of installed in-vehicle devices increased by $3.2 million primarily due to the increase in the number of vehicles under subscription. Payroll and related expenses increased by $1.3 million primarily due to an increase in our customer support and configuration groups. Amortization of acquired developed technology increased by $0.2 million primarily due to amortization related to the intangible assets acquired in the Connect2Field acquisition.
As a percentage of subscription revenue, our cost of subscription revenue decreased from 27.9% for the year ended December 31, 2012 to 24.7% for the year ended December 31, 2013. As our business and subscription revenue has grown, the decrease in cost of subscription revenue as a percentage of subscription revenue has resulted from leveraging our scale to negotiate improved pricing for our subscriber-based costs, such as the cost of in-vehicle devices, data communication charges and third-party data subscription fees, including those for mapping and posted speed limit data. In addition, we achieved improved economies of scale from our hosting activities and configuration personnel as these components of our costs result in minimal incremental cost per vehicle under subscription.
Sales and Marketing Expense
| Year Ended December 31, | ||||||||||||
| 2014 | 2013 | 2012 | ||||||||||
| (dollars in thousands) | ||||||||||||
| Sales and marketing expense |
$ | 78,885 | $ | 56,589 | $ | 41,138 | ||||||
| % change from prior year |
39.4 | % | 37.6 | % | ||||||||
| Percentage of subscription revenue |
34.1 | % | 31.9 | % | 32.3 | % | ||||||
Sales and marketing expense increased by $22.3 million, or 39.4%, for the year ended December 31, 2014 as compared to the year ended December 31, 2013. This increase was primarily due to our investment in building brand and category awareness in our market to drive customer adoption of our solutions, the expansion of our sales and marketing efforts into international markets, and the build out of dedicated sales teams to support the Fleetmatics WORK application. We incurred increased payroll-related costs of $13.6 million, inclusive of commissions and share-based compensation, primarily related to the expansion of our sales and marketing teams. These increases were the result of an increase of 75 sales and marketing personnel year-over-year. Those 75 new employees were added to further pursue the continued sales growth strategy of our business. We also increased the number of our marketing personnel to focus on lead generation, brand awareness and search engine optimization. Advertising and promotional expenditures increased by $7.8 million and professional fees increased by $0.2 million due to additional marketing and advertising efforts. Travel expense increased by $0.3 million as a result of our additional hiring efforts, and facilities expense increased by $1.1 million as a result of additional office space requirements for our newly hired employees. These increases were partially offset by decreased amortization expense of $0.3 million related to customer relationships and trademarks acquired in the SageQuest acquisition. Customer relationships and trademarks are amortized over their estimated useful lives, which range from three to nine years, based on the pattern over which the Company expects to consume the economic benefit of each asset which in general reflects the expected cash flows from each asset.
59
As a percentage of subscription revenue, sales and marketing expense increased from 31.9% for the year ended December 31, 2013 to 34.1% for the year ended December 31, 2014 primarily due to the increases in advertising and promotional expenditures and payroll and related expenses period-over-period as noted above. Other cost increases in sales and marketing expense were in line with the percentage growth in subscription revenue period-over-period.
Sales and marketing expense increased by $15.5 million, or 37.6%, for the year ended December 31, 2013 as compared to the year ended December 31, 2012. This increase was primarily due to our investment in building brand and category awareness in our market to drive customer adoption of our solutions. We incurred increased payroll-related costs of $7.9 million, inclusive of commissions and share-based compensation, primarily related to the expansion of our sales and marketing teams. These increases were the result of an increase of 78 sales and marketing personnel year-over-year. Those 78 new employees were added to further pursue the continued sales growth strategy of our business. We also increased the number of our marketing personnel to focus on lead generation, brand awareness and search engine optimization. Advertising and promotional expenditures increased by $4.6 million and professional fees increased by $0.2 million due to additional marketing and advertising efforts. Travel expense increased by $0.8 million as a result of our additional hiring efforts, and facilities expense increased by $2.2 million as a result of additional office space requirements for our newly hired employees. These increases were partially offset by decreased amortization expense of $0.3 million related to customer relationships and trademarks acquired in the SageQuest acquisition. Customer relationships and trademarks are amortized over their estimated useful lives, which range from three to nine years, based on the pattern over which the Company expects to consume the economic benefit of each asset which in general reflects the expected cash flows from each asset.
As a percentage of subscription revenue, sales and marketing expense decreased from 32.3% for the year ended December 31, 2012 to 31.9% for the year ended December 31, 2013 primarily due to the 37.6% increase in expenses noted above being more than offset by the impact of the 39.2% growth in our subscription revenue year-over-year.
Research and Development Expense
| Year Ended December 31, | ||||||||||||
| 2014 | 2013 | 2012 | ||||||||||
| (dollars in thousands) | ||||||||||||
| Research and development expense |
$ | 17,090 | $ | 11,036 | $ | 7,379 | ||||||
| % change from prior year |
54.9 | % | 49.6 | % | ||||||||
| Percentage of subscription revenue |
7.4 | % | 6.2 | % | 5.8 | % | ||||||
Research and development expense increased $6.1 million, or 54.9%, for the year ended December 31, 2014 as compared to the year ended December 31, 2013. The increase was primarily due to additional payroll-related costs of $5.2 million resulting from an increase of 38 product management and development personnel, additional facilities expenses of $0.6 million and travel expenses of $0.3 million incurred related to additional employees hired to further enhance and develop our products. Research and development expense for the years ended December 31, 2014 and 2013 of $17.1 million and $11.0 million, respectively, was recorded net after capitalization of $2.9 million and $2.2 million, respectively, of costs related to our internal-use software applications accessed by our customers through our website.
As a percentage of subscription revenue, research and development expense, net of capitalized costs related to our internal-use software applications, increased from 6.2% for the year ended December 31, 2013 to 7.4% for the year ended December 31, 2014. These increases were primarily due to the increases related to the increases in payroll and related expenses year-over-year as noted above.
Research and development expense increased $3.7 million, or 49.6%, for the year ended December 31, 2013 as compared to the year ended December 31, 2012. The increase was primarily due to additional payroll-related costs of $2.4 million resulting from an increase of 33 product management and development personnel,
60
additional recruiting expenses of $0.4 million, facilities expenses of $0.4 million and travel expenses of $0.2 million incurred related to additional employees hired, and $0.3 million of consulting fees to further enhance and develop our products. Research and development expense for the years ended December 31, 2013 and 2012 of $11.0 million and $7.4 million, respectively, was recorded net after capitalization of $2.2 million and $0.9 million, respectively, of costs related to our internal-use software applications accessed by our customers through our website.
As a percentage of subscription revenue, research and development expense, net of capitalized costs related to our internal-use software applications, increased from 5.8% for the year ended December 31, 2012 to 6.2% for the year ended December 31, 2013. These increases were primarily due to increases in payroll and related expenses year-over-year as noted above.
General and Administrative Expense
| Year Ended December 31, | ||||||||||||
| 2014 | 2013 | 2012 | ||||||||||
| (dollars in thousands) | ||||||||||||
| General and administrative expense |
$ | 42,765 | $ | 36,375 | $ | 31,047 | ||||||
| % change from prior year |
17.6 | % | 17.2 | % | ||||||||
| Percentage of subscription revenue |
18.5 | % | 20.5 | % | 24.3 | % | ||||||
General and administrative expense increased $6.4 million, or 17.6%, for the year ended December 31, 2014 as compared to the year ended December 31, 2013. This increase was primarily due to an increase of $5.7 million in payroll-related costs, inclusive of share-based compensation, primarily the result of an increase of 15 general and administrative personnel year-over-year in order to support the growth in the business. Bad debt expense increased $0.8 million due to the increase in the number of customers and their related accounts receivable balances year-over-year. Also contributing to the increase in general and administrative expense year-over-year was an increase of $0.4 million in merchant and bank fees due to the increase in customer subscriptions and increase of $0.3 million in audit and tax fees year-over-year and an increase of $0.1 million of travel expenses associated with our additional employees. These increases were partially offset by a decrease in professional fees of $0.9 million primarily related to a reduction of legal and settlement fees (which include reimbursements) associated with defending the class action complaint.
As a percentage of subscription revenue, general and administrative expense decreased from 20.5% for the year ended December 31, 2013 to 18.5% for the year ended December 31, 2014, primarily due to the 17.6% increase in expenses noted above being more than offset by the impact of the 30.6% growth in our subscription revenue year-over-year.
General and administrative expense increased $5.3 million, or 17.2%, for the year ended December 31, 2013 as compared to the year ended December 31, 2012. This increase was primarily due to an increase of $6.4 million in payroll-related costs primarily the result of an increase of 36 general and administrative personnel year-over-year in order to support the growth in the business including additional professionals with public company and managerial experience. Also contributing to the increase in general and administrative expense year-over-year was an increase of $1.8 million of office-related costs and $0.3 million of travel expenses associated with our additional employees and an increase of $0.4 million in merchant and bank fees due to the increase in customer subscriptions. Additionally, the Company recorded $0.5 million in legal settlement costs related to the U.S. Prisoner putative class action complaint. Professional fees increased by $1.2 million primarily related to legal fees associated with defending the class action complaint, additional consulting fees associated with the implementation of certain functionality of our upgraded general ledger system, professional fees associated with our secondary public offerings, additional public company expenses, all of which were partially offset by decreased audit and tax fees in the year ended December 31, 2013. These net increases were offset by a decrease of $5.4 million of consulting fees expensed in the year ended December 31, 2012, related to the Management Services Agreement with Privia.
61
As a percentage of subscription revenue, general and administrative expense decreased from 24.3% for the year ended December 31, 2012 to 20.5% for the year ended December 31, 2013, primarily due to the 17.2% increase in expenses noted above being more than offset by the impact of the 39.2% growth in our subscription revenue year-over-year.
Interest Income (Expense), net
| Year Ended December 31, | ||||||||||||
| 2014 | 2013 | 2012 | ||||||||||
| (dollars in thousands) | ||||||||||||
| Interest income (expense), net |
$ | (704 | ) | $ | (1,999 | ) | $ | (2,075 | ) | |||
| % change from prior year |
(64.8 | )% | (3.7 | )% | ||||||||
Interest income (expense), net for the year ended December 31, 2014 decreased $1.3 million, or 64.8% as compared to the year ended December 31, 2013 and primarily reflects the interest expense incurred on our long-term debt as well as amortization expense of related debt discounts and deferred financing costs.
In November, 2013, we entered into an amendment to a previously existing credit facility, dated as of May 10, 2012, with Wells Fargo Capital Finance, LLC (the Credit Facility Amendment). The Credit Facility Amendment replaced a $25.0 million Term Loan and a $25.0 million revolving line of credit with a $50.0 million revolving line of credit (the Amended Revolving Credit Facility). As of December 31, 2014 and 2013, the Company had outstanding borrowings of $23.8 million under the Amended Revolving Credit Facility, which were used to pay down the remaining unpaid principal balance of the Term Loan. The Amended Revolving Credit Facility contains certain customary financial covenants, including a leverage ratio and minimum liquidity requirement. At the Companys election, the interest rate on borrowings under the Amended Revolving Credit Facility is either (a) LIBOR plus 2.0% per annum, or (b) base rate plus 1.0% per annum. Amounts borrowed under the Amended Revolving Credit Facility may be repaid and, subject to customary terms and conditions, reborrowed at any time during and up to the maturity date. Any outstanding balance under the Amended Revolving Credit Facility is due and payable no later than May 10, 2017. Interest income netted against interest expense was immaterial in the years ended December 31, 2014, 2013 and 2012.
Foreign Currency Transaction Gain (Loss), net
| Year Ended December 31, | ||||||||||||
| 2014 | 2013 | 2012 | ||||||||||
| (dollars in thousands) | ||||||||||||
| Foreign currency transaction gain (loss), net |
$ | 832 | $ | (1,139 | ) | $ | (24 | ) | ||||
| % change from prior year |
NM | NM | ||||||||||
For the year ended December 31, 2014, we recognized $0.8 million in foreign currency transaction gains. For the years ended December 31, 2013 and 2012, we recognized $1.1 million and $24 thousand in foreign currency transaction losses. Foreign currency transaction gain (loss), net primarily reflects the foreign currency transaction gains or losses arising from exchange rate fluctuations on intercompany payables and receivables denominated in currencies other than the functional currencies of the legal entities in which the transactions are recorded. Foreign currency transaction gains (losses) arise from fluctuations in the value of the U.S. dollar compared to other currencies in which we transact, primarily the euro and British pound.
Loss on Extinguishment of Debt
In May 2012, we used proceeds from the $25.0 million Term Loan of our Senior Secured Credit Facility with Wells Fargo Capital Finance, LLC to pay in full the amounts due under the Senior Secured Notes with DE Shaw. The repayment of the DE Shaw debt was accounted for as a debt extinguishment. For the year ended December 31, 2012, we recognized a loss on extinguishment of debt of $0.9 million, which was primarily comprised of the write-off of unamortized debt discount of $0.4 million and the prepayment premium of $0.5 million we paid in cash.
62
Provision for (Benefit from) Income Taxes
| Year Ended December 31, | ||||||||||||
| 2014 | 2013 | 2012 | ||||||||||
| (dollars in thousands) | ||||||||||||
| Provision for (benefit from) income taxes |
$ | 7,988 | $ | (4,103 | ) | $ | 3,907 | |||||
Our provision for (benefit from) income taxes consists primarily of taxes in Ireland, the United States and the United Kingdom. We are subject to tax in various jurisdictions that apply various statutory rates of tax to our income. Each of these jurisdictions has its own tax law, which is subject to interpretation on a jurisdiction-by-jurisdiction basis. In Ireland, our operating entity is subject to tax at a 12.5% tax rate on its trading income and 25% on its non-trading income and our non-operating entities are subject to tax at a 25% tax rate, while our foreign subsidiaries in the United States and the United Kingdom are subject to tax rates of approximately 39% and 22%, respectively. For the years ended December 31, 2014, 2013 and 2012, our domestic pre-tax income in Ireland was $26.5 million, $17.0 million, and $7.6 million, respectively, and our foreign pre-tax income was $9.0 million, $9.4 million, and $1.7 million, respectively, primarily in the United States and the United Kingdom. See Note 11 to our consolidated financial statements for additional information related to the foreign and domestic income tax expense (benefit) we recorded and the effect that foreign taxes had on our overall effective tax rate. In addition to the pre-tax income of each jurisdiction taxed at the different tax rates noted above, our effective income tax rates for each year were affected by the items noted below.
Our effective income tax rate (benefit) for the years ended December 31, 2014, 2013 and 2012 was 22.5%, (15.6)%, and 41.9%, respectively, on pre-tax income of $35.5 million, $26.4 million, and $9.3 million, respectively. Our effective tax rate for the year ended December 31, 2014 was higher than the statutory Irish rate of 12.5% primarily due to the recording of interest and penalties associated with our uncertain tax positions and income taxed in foreign jurisdictions with a higher statutory tax rate than the 12.5% Irish statutory rate. The increases associated with these items were partially offset by research tax credits in Ireland. Our effective tax rate for the year ended December 31, 2013 was lower than the statutory Irish rate of 12.5% primarily due to the net reversal of $10.6 million of reserves for uncertain tax positions upon the expiration of the statute of limitations in the United States and also due to Ireland research and development tax credits. Our effective tax rate for the year ended December 31, 2012 was higher than the statutory Irish rate of 12.5% primarily due to recording of reserves for uncertain tax positions, and an increase in the valuation allowance related to certain Irish net operating loss carryforwards.
Our provision for income taxes may change from period to period based on non-recurring events, such as the settlement of income tax audits and changes in tax laws including enacted statutory rates, as well as recurring factors, including changes in the mix of earnings in countries with differing statutory tax rates. As a result of our global business model and cross-border intercompany transactions, a change in uncertain tax positions or a change in statutory rates, particularly in Ireland, could have a significant effect on our overall effective tax rate. Effective for 2015, our legal entity which is the owner of our intellectual property has become a non-resident Irish entity in compliance with European Union, or EU, migration laws. We expect that the effect of this will be to reduce our consolidated taxation.
Quarterly Results of Operations (Unaudited)
The following table sets forth our unaudited consolidated statements of operations data and other financial data for each of the eight quarters in the period ended December 31, 2014 (certain items may not foot due to rounding). We have prepared the consolidated statement of operations for each of these quarters on the same basis as the audited consolidated financial statements included in Item 15 of this Annual Report on Form 10-K. In the opinion of management, each consolidated statement of operations includes all adjustments, consisting solely of normal recurring adjustments, necessary for a fair statement of this data for the periods presented. This information should be read in conjunction with our audited consolidated financial statements and related notes included in Item 15 of this Annual Report on Form 10-K. These quarterly operating results are not necessarily indicative of the results to be expected in future periods.
63
| Three Months Ended | ||||||||||||||||||||||||||||||||
| Dec 31, 2014 |
Sep 30, 2014 |
Jun 30, 2014 |
Mar 31, 2014 |
Dec 31, 2013 |
Sep 30, 2013 |
Jun 30, 2013 |
Mar 31, 2013 |
|||||||||||||||||||||||||
| (in thousands) | ||||||||||||||||||||||||||||||||
| Consolidated Statements of Operations Data: |
||||||||||||||||||||||||||||||||
| Subscription revenue |
$ | 63,995 | $ | 60,421 | $ | 55,268 | $ | 51,897 | $ | 50,088 | $ | 46,314 | $ | 42,529 | $ | 38,419 | ||||||||||||||||
| Cost of subscription revenue |
15,169 | 15,056 | 14,534 | 12,746 | 11,529 | 11,498 | 10,834 | 9,997 | ||||||||||||||||||||||||
|
|
|
|
|
|
|
|
|
|
|
|
|
|
|
|
|
|||||||||||||||||
| Gross profit |
48,826 | 45,365 | 40,734 | 39,151 | 38,559 | 34,816 | 31,695 | 28,422 | ||||||||||||||||||||||||
|
|
|
|
|
|
|
|
|
|
|
|
|
|
|
|
|
|||||||||||||||||
| Sales and marketing |
19,321 | 19,153 | 22,049 | 18,362 | 16,122 | 14,266 | 13,600 | 12,601 | ||||||||||||||||||||||||
| Research and development |
4,041 | 4,259 | 4,613 | 4,177 | 3,351 | 3,130 | 2,461 | 2,094 | ||||||||||||||||||||||||
| General and administrative |
11,384 | 10,623 | 9,486 | 11,272 | 10,849 | 10,506 | 7,080 | 7,940 | ||||||||||||||||||||||||
|
|
|
|
|
|
|
|
|
|
|
|
|
|
|
|
|
|||||||||||||||||
| Total operating expenses |
34,746 | 34,035 | 36,148 | 33,811 | 30,322 | 27,902 | 23,141 | 22,635 | ||||||||||||||||||||||||
|
|
|
|
|
|
|
|
|
|
|
|
|
|
|
|
|
|||||||||||||||||
| Income from operations |
14,080 | 11,330 | 4,586 | 5,340 | 8,237 | 6,914 | 8,554 | 5,787 | ||||||||||||||||||||||||
| Other income (expense), net |
(20 | ) | 125 | 192 | (170 | ) | (1,253 | ) | (491 | ) | (672 | ) | (722 | ) | ||||||||||||||||||
| Provision for (benefit from) income taxes |
1,641 | 3,260 | 1,545 | 1,542 | (9,253 | ) | 845 | 2,200 | 2,105 | |||||||||||||||||||||||
|
|
|
|
|
|
|
|
|
|
|
|
|
|
|
|
|
|||||||||||||||||
| Net income |
$ | 12,419 | $ | 8,195 | $ | 3,233 | $ | 3,628 | $ | 16,237 | $ | 5,578 | $ | 5,682 | $ | 2,960 | ||||||||||||||||
|
|
|
|
|
|
|
|
|
|
|
|
|
|
|
|
|
|||||||||||||||||
| Three Months Ended | ||||||||||||||||||||||||||||||||
| Dec 31, 2014 |
Sep 30, 2014 |
Jun 30, 2014 |
Mar 31, 2014 |
Dec 31, 2013 |
Sep 30, 2013 |
Jun 30, 2013 |
Mar 31, 2013 |
|||||||||||||||||||||||||
| (as a percentage of subscription revenue) | ||||||||||||||||||||||||||||||||
| Consolidated Statements of Operations Data: |
||||||||||||||||||||||||||||||||
| Subscription revenue |
100.0 | % | 100.0 | % | 100.0 | % | 100.0 | % | 100.0 | % | 100.0 | % | 100.0 | % | 100.0 | % | ||||||||||||||||
| Cost of subscription revenue |
23.7 | 24.9 | 26.3 | 24.6 | 23.0 | 24.8 | 25.5 | 26.0 | ||||||||||||||||||||||||
|
|
|
|
|
|
|
|
|
|
|
|
|
|
|
|
|
|||||||||||||||||
| Gross profit |
76.3 | 75.1 | 73.7 | 75.4 | 77.0 | 75.2 | 74.5 | 74.0 | ||||||||||||||||||||||||
|
|
|
|
|
|
|
|
|
|
|
|
|
|
|
|
|
|||||||||||||||||
| Sales and marketing |
30.2 | 31.7 | 39.9 | 35.4 | 32.2 | 30.8 | 32.0 | 32.8 | ||||||||||||||||||||||||
| Research and development |
6.3 | 7.0 | 8.3 | 8.0 | 6.7 | 6.8 | 5.8 | 5.5 | ||||||||||||||||||||||||
| General and administrative |
17.8 | 17.6 | 17.2 | 21.7 | 21.7 | 22.7 | 16.6 | 20.7 | ||||||||||||||||||||||||
|
|
|
|
|
|
|
|
|
|
|
|
|
|
|
|
|
|||||||||||||||||
| Total operating expenses |
54.3 | 56.3 | 65.4 | 65.2 | 60.5 | 60.2 | 54.4 | 58.9 | ||||||||||||||||||||||||
|
|
|
|
|
|
|
|
|
|
|
|
|
|
|
|
|
|||||||||||||||||
| Income from operations |
22.0 | 18.8 | 8.3 | 10.3 | 16.4 | 14.9 | 20.1 | 15.1 | ||||||||||||||||||||||||
| Other income (expense), net |
| 0.2 | 0.3 | (0.3 | ) | (2.5 | ) | (1.1 | ) | (1.6 | ) | (1.9 | ) | |||||||||||||||||||
| Provision for (benefit from) income taxes |
2.6 | 5.4 | 2.8 | 3.0 | (18.5 | ) | 1.8 | 5.2 | 5.5 | |||||||||||||||||||||||
|
|
|
|
|
|
|
|
|
|
|
|
|
|
|
|
|
|||||||||||||||||
| Net income) |
19.4 | % | 13.6 | % | 5.8 | % | 7.0 | % | 32.4 | % | 12.0 | % | 13.4 | % | 7.7 | % | ||||||||||||||||
|
|
|
|
|
|
|
|
|
|
|
|
|
|
|
|
|
|||||||||||||||||
64
Subscription revenue increased sequentially in each of the quarters presented due to increases in the number of total vehicles under subscription in each quarter. Total operating expenses, in absolute dollars, increased over time in the periods presented primarily due to increased sales and marketing and general and administrative expenses, which resulted from increased marketing and advertising efforts, increased number of personnel to support the business, and increased professional fees, including those related to accounting, tax and audit services and those related to our Management Services Agreement with Privia. During the three months ended September 30, 2013, general and administrative expenses increased by $3.4 million from $7.1 million in the three months ended June 30, 2013 to $10.5 million, primarily as a result of increases of $1.2 million in payroll-related costs in order to support the growth in the business, increases of $1.2 million in professional fees primarily due to $0.5 million in legal settlement costs related to the U.S. Prisoner putative class action complaint and to legal fees associated with defending the class action complaint, increases of $0.8 million of office-related costs associated with our additional employees and additional consulting fees associated with the implementation of certain functionality of our upgraded general ledger system.
Provision for (benefit from) income taxes fluctuated over time in the periods presented primarily due to changes in the jurisdictions in which the income or loss was generated, changes in the valuation allowances for deferred tax assets, the expiration of certain statutes of limitations, and the recording of interest and penalties related to our tax contingencies. During the three months ended December 31, 2013, the provision for (benefit from) income taxes decreased from $0.8 million in the three months ended September 30, 2013 to $(9.3) million, primarily as a result of the net reversal of $11.1 million of uncertain tax positions due to an expiration of a statute of limitations in the United States.
Liquidity and Capital Resources
| Year Ended December 31, | ||||||||||||
| 2014 | 2013 | 2012 | ||||||||||
| (dollars in thousands) | ||||||||||||
| Cash flows provided by operating activities |
$ | 71,743 | $ | 41,911 | $ | 16,890 | ||||||
| Cash flows used in investing activities |
(43,026 | ) | (43,184 | ) | (25,576 | ) | ||||||
| Cash flows provided by financing activities |
10,256 | 38,660 | 100,386 | |||||||||
| Effect of exchange rate changes on cash |
(744 | ) | (303 | ) | (228 | ) | ||||||
|
|
|
|
|
|
|
|||||||
| Net increase in cash |
$ | 38,229 | $ | 37,084 | $ | 91,472 | ||||||
|
|
|
|
|
|
|
|||||||
In connection with the Companys October 2012 initial public offering, the Company received aggregate proceeds of $93.3 million net of underwriting discounts and commissions and offering costs paid by the Company.
Prior to the Companys October 2012 initial public offering, the Company funded its operations, capital expenditures and the acquisition of SageQuest primarily through sales of its fleet management solutions to customers, the net proceeds of approximately $54.2 million from the issuance of shares in the Companys capital since its inception, and the net proceeds of $31.5 million from debt issued in 2010 and 2012.
On July 30, 2013, the Company completed a secondary public offering of its ordinary shares, which resulted in the sale of 1,000,000 ordinary shares by the Company and 9,925,000 ordinary shares by other selling shareholders at a price of $33.00 per ordinary share. The Company received net proceeds from this secondary public offering of $32.1 million, based upon the price of $33.00 per ordinary share and after deducting underwriting discounts and commissions and offering costs paid by the Company. The Company received no proceeds from the sale of ordinary shares by the selling shareholders.
At December 31, 2014, our principal sources of liquidity were our cash balance of $175.4 million and borrowings of up to $50.0 million available under our Amended Revolving Credit Facility, of which $26.3 million was available.
65
Operating Activities
Operating activities provided $71.7 million of cash in 2014. The cash flow provided by operating activities resulted primarily from our net income of $27.5 million, net non-cash charges of $27.9 million, and net cash of $16.3 million provided by changes in our operating assets and liabilities. Our non-cash charges primarily consisted of $33.4 million of depreciation and amortization expense, $13.2 million of share-based compensation expense, $8.9 million benefit from deferred tax assets, $2.4 million of provisions for accounts receivable allowances, $1.7 million for losses on disposal of property and equipment and other assets, $0.9 million of unrealized foreign currency transaction gains, and $13.0 million in excess tax benefits from share-based awards. Net cash provided by changes in our operating assets and liabilities primarily consisted of a $2.7 million increase in deferred revenue, $7.9 million increase in accounts payable, accrued expenses, and other current liabilities, a $3.8 million decrease in prepaid expenses and other current assets, a $0.9 million decrease in accounts receivable from customers, and a $1.1 million increase in accrued income taxes. The increase in deferred revenue was attributable to a greater number of customers in 2014 than in 2013 prepaying for a portion of their subscription. The increase in our accounts payable and accrued expenses resulted from our increased spending due to the growth of our business. The decrease in our accounts receivable was due to collection efforts in 2014 on certain customer billings which had been delayed due to our billing system conversion completed during the fourth quarter of 2013. The increase in our accrued taxes was due to net increases in our tax reserves.
Operating activities provided $41.9 million of cash in 2013. The cash flow provided by operating activities resulted primarily from our net income of $30.5 million, net non-cash charges of $33.5 million, and net uses of cash of $25.9 million from changes in our operating assets and liabilities. Our non-cash charges primarily consisted of $23.2 million of depreciation and amortization expense, $7.5 million of share-based compensation expense, $3.1 million for losses on disposal of property and equipment and other assets, $2.5 million of provisions for accounts receivable and deferred tax assets, $1.1 million of unrealized foreign currency transaction losses, and $3.8 million in excess tax benefits from share-based awards. Net uses of cash from changes in our operating assets and liabilities primarily consisted of a $13.0 million increase in our accounts receivable from customers, a $12.5 million decrease in accrued income taxes, and a $11.5 million increase in prepaid expenses and other assets, partially offset by a $10.7 million increase in accounts payable, accrued expenses and other current liabilities and a $4.2 million increase in deferred revenue. The increase in our accounts receivable was due to the increase in subscription revenue from 2012 to 2013 resulting from the increased number of vehicles under subscription, as well as a delay in certain customer billings due to a billing system conversion completed during the fourth quarter of 2013. The decrease in our accrued taxes was due to the reversal of uncertain tax positions due to an expiration of the statute of limitations in the United States. The increase in our prepaid expenses and other assets was due to increases in deferred commissions and capitalized costs of in-vehicle devices owned by customers due to the growth in our business. The increase in our accounts payable and accrued expenses resulted from our increased spending due to the growth of our business. The increase in deferred revenue was attributable to a greater number of customers in 2013 than in 2012 prepaying for a portion of their subscription.
Operating activities provided $16.9 million of cash in 2012. The cash flow provided by operating activities resulted primarily from our net income of $5.4 million, net non-cash charges of $30.6 million, and net uses of cash of $19.1 million from changes in our operating assets and liabilities. Our non-cash charges primarily consisted of $17.5 million of depreciation and amortization expense, $8.0 million of provisions for accounts receivable and deferred tax assets, $2.4 million of share-based compensation expense, $2.2 million for losses on disposal of property and equipment and other assets, and $0.4 million of loss on extinguishment of debt. Net uses of cash from changes in our operating assets and liabilities primarily consisted of a $11.6 million increase in prepaid expenses and other assets, $5.0 million increase in our accounts receivable from customers, a $3.3 million decrease in accrued income taxes, and a $0.5 million decrease in our deferred revenue balance, partially offset by a $1.0 million increase in accounts payable, accrued expenses and other current liabilities. The increase in our prepaid expenses and other assets was due to increases in deferred commissions and capitalized costs of in-vehicle devices owned by customers due to the growth in our business as well as deferred financing costs related to our Senior Secured Credit Facility. The increase in our accounts receivable was due to the increase in
66
subscription revenue from 2011 to 2012 resulting from the increased number of vehicles under subscription. The decrease in accrued income taxes was due to net decreases in our prior-year tax reserves. The decrease in deferred revenue was attributable to a greater number of customers in 2012 than in 2011 paying for their subscriptions on a monthly basis rather than prepaying the full amount or an annual amount due under their subscription agreement. The increase in our accounts payable and accrued expenses resulted from our increased spending due to the growth of our business.
Investing Activities
Net cash used in investing activities was $43.0 million, $43.2 million and $25.6 million for the years ended December 31, 2014, 2013 and 2012, respectively. Net cash used in investing activities consisted primarily of cash paid to purchase property and equipment of $37.1 million, $34.2 million, and $25.2 million in 2014, 2013 and 2012, respectively; costs capitalized for internal-use software of $3.8 million, $2.2 million, and $0.9 million in 2014, 2013 and 2012, respectively; and cash paid to acquire KKT of $2.3 million in 2014 and Connect2Field of $6.8 million in 2013.
Financing Activities
Net cash provided by financing activities was $10.3 million, $38.7 million and $100.4 million for the years ended December 31, 2014, 2013 and 2012, respectively. Net cash provided by financing activities in 2014 consisted of excess tax benefits from share-based awards of $13.0 million, proceeds from the exercise of options to purchase ordinary shares under stock option plans of $2.8 million, partially offset by taxes paid related to net share settlement of equity awards of $4.1 million, payments of our capital lease obligations of $0.8 million, and payments of notes payable of $0.6 million.
Net cash provided by financing activities in 2013 consisted of net proceeds of $32.1 million from our secondary public offering, net of offering costs, proceeds from the exercise of options to purchase ordinary shares under stock option plans of $5.5 million, and from excess tax benefits from share-based awards of $3.8 million, partially offset by payments of previously accrued initial public offering costs of $1.4 million, payments of our Term Loan of $0.9 million, and payments of our capital lease obligations of $0.4 million.
Net cash provided by financing activities in 2012 consisted of net proceeds of $94.7 million from our initial public offering, net of offering costs, $23.5 million from our borrowing under the Term Loan, $8.3 million from borrowing under our Revolving Credit Facility, partially offset by the repayment of our Senior Secured Notes of $17.5 million, the repayment of borrowing under our Revolving Credit Facility of $8.3 million and payments of our capital lease obligations of $0.4 million.
Indebtedness and Liquidity
On January 21, 2015, Fleetmatics Group PLC and its subsidiaries Fleetmatics USA, LLC and Fleetmatics Development Limited, as borrowers (the Company) entered into a Credit Agreement with Citibank, N.A., as administrative agent, and the lenders party thereto, for a senior, first-priority secured financing comprised of revolving loans, letters of credit and swing line loans in a total maximum amount of $125,000 (the Credit Facility). The Credit Facility consists of a five-year multi-currency revolving credit facility in a dollar amount of up to $125,000 which includes a sublimit of $5,000 for letters of credit and a $10,000 swing line facility. The Credit Facility also includes an accordion feature that will allow the Company to increase the Credit Facility to a total of $200,000, subject to securing additional commitments from existing lenders or new lending institutions. The Company used the net proceeds of borrowings under the Credit Facility to repay the $23,750 outstanding under the Companys previously existing revolving credit facility with Wells Fargo Capital Finance, LLC and for working capital and other general corporate purposes. See Note 22 to our consolidated financial statements for further details.
We believe that our cash and borrowings available under our Credit Facility will be sufficient to meet our working capital and capital expenditure requirements for at least the next twelve months.
67
As of December 31, 2014, we had net operating loss carryforwards in the United States available to reduce future federal taxable income of $9.5 million, and we had net operating loss carryforwards in the United Kingdom available to reduce future taxable income of $1.2 million. If unused, our net operating loss carryforwards in the United States expire at various dates through 2033, while those in the United Kingdom may be carried forward indefinitely. In certain circumstances, usage of our net operating loss carryforwards in the United States may be limited.
Our principal commitments consist of obligations under our outstanding debt facilities, leases for our office space, computer equipment, furniture and fixtures, and contractual commitments for hosting and other support services. We have a lease for 42,912 square feet of office space in Waltham, Massachusetts for our U.S. headquarters which is effective through October 2020. We lease approximately 31,200 square feet of office and warehouse space in Ohio under operating leases that expire in November 2017 with a five-year extension option. We lease 16,587 square feet of office space in Ireland for our registered office and for our research and development and sales teams under operating leases that expire in May 2022. We have a lease for 2,200 square feet of office space in Templeogue Village, Dublin, which expires in 2036. We lease office space in Rolling Meadows, Illinois, Clearwater, Florida, Charlotte, North Carolina, Scottsdale, Arizona, Sydney, Australia, Reading, Berkshire in the United Kingdom, and Utrecht, the Netherlands for our sales, marketing and customer care organizations under lease agreements that expire at various dates through 2019. We lease office space in Florence, Italy primarily for research and development employees.
We have non-cancelable purchase commitments related to telecommunications, mapping and subscription software services that are payable through 2017.
We have agreements with various vendors to provide specialized space and equipment and related services from which we host our software application. The agreements include payment commitments that expire at various dates through 2015.
The following table summarizes our contractual obligations at December 31, 2014:
| Payments Due by Period | ||||||||||||||||||||
| Total | Less than 1 Year |
1-3 Years |
3-5 Years |
More than 5 Years |
||||||||||||||||
| (in thousands) | ||||||||||||||||||||
| Amended Revolving Credit Facility(1) |
$ | 23,981 | $ | 95 | $ | 23,886 | $ | | $ | | ||||||||||
| Capital lease obligations(2) |
1,767 | 830 | 937 | | | |||||||||||||||
| Operating lease obligations(3) |
16,301 | 3,653 | 7,293 | 3,461 | 1,894 | |||||||||||||||
| Outstanding purchase obligations(4) |
11,290 | 6,161 | 5,129 | | | |||||||||||||||
| Data center commitments(5) |
1,148 | 1,148 | | | | |||||||||||||||
|
|
|
|
|
|
|
|
|
|
|
|||||||||||
|
Total(6) |
$ | 54,487 | $ | 11,887 | $ | 37,245 | $ | 3,461 | $ | 1,894 | ||||||||||
|
|
|
|
|
|
|
|
|
|
|
|||||||||||
| (1) | Represents the outstanding borrowings and contractually required unused line fees and service fees contractually required under our Amended Revolving Credit Facility in existence at December 31, 2014. |
| (2) | Represents the contractually required payments under our capital lease obligations in existence as of December 31, 2014 in accordance with the required payment schedule. No assumptions were made with respect to renewing the lease terms at the expiration date of their initial terms. |
| (3) | Represents the contractually required payments under our operating lease obligations in existence as of December 31, 2014 in accordance with the required payment schedule. No assumptions were made with respect to renewing the lease terms at the expiration date of their initial terms. |
68
| (4) | Represents the contractually required payments under the various purchase obligations in existence as of December 31, 2014. No assumptions were made with respect to renewing the purchase obligations at the expiration date of their initial terms, no amounts are assumed to be prepaid and no assumptions were made for early termination of any obligations. |
| (5) | Represents the contractually required payments for our data center agreements in existence as of December 31, 2014 in accordance with the required payment schedule. No assumptions were made with respect to renewing the lease term at its expiration date. |
| (6) | This table does not include $3.2 million recorded as liabilities for unrecognized tax benefits (inclusive of $2.7 million of accrued interest and penalties) as of December 31, 2014 as we are unable to make reasonably reliable estimates of when cash settlement will occur. Refer to Note 12 to our unaudited consolidated financial statements included elsewhere in this Annual Report on Form 10-K for further discussion on income taxes. |
Off-Balance Sheet Arrangements
We do not engage in any off-balance sheet financing activities. We do not have any interest in entities referred to as variable interest entities, which include special purpose entities and other structured finance entities.
Recently Issued and Adopted Accounting Pronouncements
In August 2014, the Financial Accounting Standards Board (FASB) issued Accounting Standards Update (ASU) 2014-15, Presentation of Financial StatementsGoing Concern (ASU 2014-15). ASU 2014-15 addresses managements responsibility to evaluate whether there is substantial doubt about an entitys ability to continue as a going concern and to provide related footnote disclosures. Managements evaluation should be based on relevant conditions and events that are known and reasonably knowable at the date that the financial statements are issued. The standard will be effective for the first interim period within annual reporting periods beginning after December 15, 2016. Early adoption is permitted. The adoption of this guidance is not expected to have a material impact on the Companys consolidated financial position, results of operations or cash flows.
In May 2014, the FASB issued ASU 2014-09, Revenue from Contracts with Customers (ASU 2014-09), which supersedes nearly all existing revenue recognition guidance under GAAP. The core principle of ASU 2014-09 is to recognize revenues when promised goods or services are transferred to customers in an amount that reflects the consideration to which an entity expects to be entitled for those goods or services. ASU 2014-09 defines a five-step process to achieve this core principle and, in doing so, more judgment and estimates may be required within the revenue recognition process than are required under existing GAAP. The standard is effective for annual periods beginning after December 15, 2016, and interim periods therein, using either of the following transition methods: (i) a full retrospective approach reflecting the application of the standard in each prior reporting period with the option to elect certain practical expedients, or (ii) a retrospective approach with the cumulative effect of initially adopting ASU 2014-09 recognized at the date of adoption (which includes additional footnote disclosures). The Company is currently evaluating the impact of its pending adoption of ASU 2014-09 on the Companys consolidated financial statements and has not yet determined the method by which the Company will adopt the standard in 2017.
In July 2013, the FASB issued ASU 2013-11, Presentation of an Unrecognized Tax Benefit When a Net Operating Loss Carryforward, a Similar Tax Loss, or a Tax Credit Carryforward Exists (ASU 2013-11). ASU 2013-11 clarifies guidance and eliminates diversity in practice on the presentation of unrecognized tax benefits when a net operating loss carryforward, a similar tax loss, or a tax credit carryforward exists at the reporting date. The Company adopted this standard in 2014, and it did not have a material effect on the Companys consolidated financial position, results of operations or cash flows.
In March 2013, the FASB issued ASU 2013-05, Foreign Currency Matters (ASU 2013-05). ASU 2013-05 addresses a parents accounting for the cumulative translation adjustment upon derecognition of certain subsidiaries or group of assets within a foreign entity or of an investment in a foreign entity. The objective of this
69
guidance is to resolve the diversity in practice about the appropriate guidance to apply to the release of the cumulative translation adjustment into net income when a parent either sells a part or all of its investment in a foreign entity or no longer holds a controlling financial interest in a subsidiary or a business within a foreign entity. ASU 2013-05 provides that the entire amount of the cumulative translation adjustment associated with the foreign entity would be released when there has been a sale of a subsidiary or group of net assets within a foreign entity and the sale represents the substantially complete liquidation of the investment in the foreign entity. ASU 2013-05 is effective for fiscal years, and interim periods within those fiscal years, beginning on or after December 15, 2013. The Company adopted this standard in 2014, and it did not have a material effect on the Companys consolidated financial position, results of operations or cash flows.
| Item 7A. | Quantitative and Qualitative Disclosures About Market Risk |
We face exposure to adverse movements in foreign currency exchange rates and changes in interest rates. Portions of our revenues, expenses, assets and liabilities are denominated in currencies other than the U.S. dollar, primarily the euro, the British pound, the Canadian dollar, and the Australian dollar with respect to revenues, expenses and intercompany payables and receivables. These exposures may change over time as business practices evolve.
Foreign Currency Exchange Risk
Foreign currency transaction exposure results primarily from intercompany transactions and transactions with customers or vendors denominated in currencies other than the functional currency of the legal entity in which the transaction is recorded by us. Assets and liabilities arising from such transactions are translated into the legal entitys functional currency using the exchange rate in effect at the balance sheet date. Any gain or loss resulting from currency fluctuations is recorded on a separate line in our consolidated statements of operations. Net foreign currency transaction gains of $0.8 million were recorded for the year ended December 31, 2014. Net foreign currency transaction losses of $1.1 million and $24 thousand were recorded for the years ended December 31, 2013 and 2012.
Foreign currency translation exposure results from the translation of the financial statements of our subsidiaries whose functional currency is not the U.S. dollar into U.S. dollars for consolidated reporting purposes. The balance sheets of these subsidiaries are translated into U.S. dollars using period-end exchange rates and their income statements are translated into U.S. dollars using the average exchange rate over the period. Resulting currency translation adjustments are recorded in accumulated other comprehensive income (loss) in our consolidated balance sheets. Net foreign currency translation losses of $2.8 million were recorded for the year ended December 31, 2014. Net foreign currency translation gains of $1.2 million and $0.1 million were recorded for the years ended December 31, 2013 and 2012.
For the years ended December 31, 2014 and 2013, approximately 8.4% and 8.8%, respectively, of our revenues and approximately 19.1% and 15.5%, respectively, of our operating expenses were generated by subsidiaries whose functional currency is not the U.S. dollar and therefore are subject to foreign currency translation exposure. In addition, 10.2% of our assets and 10.9% of our liabilities were subject to foreign currency translation exposure as of December 31, 2014 as compared to 10.3% of our assets and 3.6% of our liabilities as of December 31, 2013.
Currently, our largest foreign currency exposures are those with respect to the euro, the British pound, and the Australian dollar. Relative to foreign currency exposures existing at December 31, 2014, a 10% unfavorable movement in foreign currency exchange rates would expose us to losses in earnings. For the year ended December 31, 2014, we estimated that a 10% unfavorable movement in foreign currency exchange rates would have decreased pre-tax income by $4.8 million. The estimates used assume that all currencies move in the same direction at the same time. The potential change noted above is based on a sensitivity analysis performed on our financial position as of December 31, 2014. We have experienced and we will continue to experience
70
fluctuations in our net income (loss) as a result of revaluing our assets and liabilities that are not denominated in the functional currency of the entity that recorded the asset or liability. At this time, we do not hedge our foreign currency risk.
Interest Rate Fluctuation Risk
As we only hold cash, our cash balances are not subject to market risk due to changes in interest rates. The Amended Revolving Credit Facility, which earns variable rates of interest, exposes us to interest rate risk. Based on the $23.8 million outstanding principal amount of our variable-rate indebtedness at December 31, 2014 under the Amended Revolving Credit Facility, a one percentage point change in the interest rates above the floor of 4.5% would have impacted our future annual interest expense due under the debt by an aggregate of approximately $0.2 million. However, interest cannot decrease from the 4.5% rate we were paying as of December 31, 2014 as our Amended Revolving Credit Facility does not allow for us to pay interest at a rate of less than 4.5% on our principal balances.
Inflation Risk
We do not believe that inflation had a material effect on our business, financial condition or results of operations in the last two fiscal years. If our costs were to become subject to significant inflationary pressures, we may not be able to fully offset such higher costs through price increases. Our inability or failure to do so could harm our business, financial condition and results of operations.
Credit Risk
Financial instruments that potentially expose the Company to concentrations of credit risk consist primarily of cash and trade accounts receivable. Although the Company maintains its cash balances with accredited financial institutions, the Company had substantially all cash balances at financial institutions without or in excess of federally insured limits at December 31, 2014 and 2013. The Company does not believe it is subject to unusual credit risk beyond the normal credit risk associated with commercial banking relationships.
Liquidity Risk
On January 21, 2015, Fleetmatics Group PLC and its subsidiaries Fleetmatics USA, LLC and Fleetmatics Development Limited, as borrowers (the Company) entered into a Credit Agreement with Citibank, N.A., as administrative agent, and the lenders party thereto, for a senior, first-priority secured financing comprised of revolving loans, letters of credit and swing line loans in a total maximum amount of $125,000 (the Credit Facility). The Credit Facility consists of a five-year multi-currency revolving credit facility in a dollar amount of up to $125,000 which includes a sublimit of $5,000 for letters of credit and a $10,000 swing line facility. The Credit Facility also includes an accordion feature that will allow the Company to increase the Credit Facility to a total of $200,000, subject to securing additional commitments from existing lenders or new lending institutions. The Company used the net proceeds of borrowings under the Credit Facility to repay the $23,750 outstanding under the Companys previously existing revolving credit facility with Wells Fargo Capital Finance, LLC and for working capital and other general corporate purposes.
We believe that our cash and borrowings available under our Credit Facility will be sufficient to meet our working capital and capital expenditure requirements for at least the next twelve months.
| Item 8. | Financial Statements and Supplementary Data |
71
REPORT OF INDEPENDENT REGISTERED PUBLIC ACCOUNTING FIRM
To the Board of Directors and Shareholders of
Fleetmatics Group PLC
In our opinion, the accompanying consolidated balance sheets and the related consolidated statements of operations, of redeemable convertible preferred shares and shareholders equity (deficit), of comprehensive income (loss) and of cash flows present fairly, in all material respects, the financial position of Fleetmatics Group PLC and its subsidiaries at December 31, 2014 and 2013, and the results of their operations and their cash flows for each of the three years in the period ended December 31, 2014 in conformity with accounting principles generally accepted in the United States of America. Also in our opinion, the Company maintained, in all material respects, effective internal control over financial reporting as of December 31, 2014, based on criteria established in Internal ControlIntegrated Framework (2013) issued by the Committee of Sponsoring Organizations of the Treadway Commission (COSO). The Companys management is responsible for these financial statements, for maintaining effective internal control over financial reporting and for its assessment of the effectiveness of internal control over financial reporting, included in Managements Annual Report on Internal Control Over Financial Reporting appearing under Item 9A. Our responsibility is to express opinions on these financial statements and on the Companys internal control over financial reporting based on our audits (which was an integrated audit in 2014). We conducted our audits in accordance with the standards of the Public Company Accounting Oversight Board (United States). Those standards require that we plan and perform the audits to obtain reasonable assurance about whether the financial statements are free of material misstatement and whether effective internal control over financial reporting was maintained in all material respects. Our audits of the financial statements included examining, on a test basis, evidence supporting the amounts and disclosures in the financial statements, assessing the accounting principles used and significant estimates made by management, and evaluating the overall financial statement presentation. Our audit of internal control over financial reporting included obtaining an understanding of internal control over financial reporting, assessing the risk that a material weakness exists, and testing and evaluating the design and operating effectiveness of internal control based on the assessed risk. Our audits also included performing such other procedures as we considered necessary in the circumstances. We believe that our audits provide a reasonable basis for our opinions.
A companys internal control over financial reporting is a process designed to provide reasonable assurance regarding the reliability of financial reporting and the preparation of financial statements for external purposes in accordance with generally accepted accounting principles. A companys internal control over financial reporting includes those policies and procedures that (i) pertain to the maintenance of records that, in reasonable detail, accurately and fairly reflect the transactions and dispositions of the assets of the company; (ii) provide reasonable assurance that transactions are recorded as necessary to permit preparation of financial statements in accordance with generally accepted accounting principles, and that receipts and expenditures of the company are being made only in accordance with authorizations of management and directors of the company; and (iii) provide reasonable assurance regarding prevention or timely detection of unauthorized acquisition, use, or disposition of the companys assets that could have a material effect on the financial statements.
Because of its inherent limitations, internal control over financial reporting may not prevent or detect misstatements. Also, projections of any evaluation of effectiveness to future periods are subject to the risk that controls may become inadequate because of changes in conditions, or that the degree of compliance with the policies or procedures may deteriorate.
/s/ PricewaterhouseCoopers LLP
Boston, Massachusetts
February 27, 2015
72
FLEETMATICS GROUP PLC
(In thousands, except share and per share data)
| December 31, | ||||||||
| 2014 | 2013 | |||||||
| Assets |
||||||||
| Current assets: |
||||||||
| Cash |
$ | 175,400 | $ | 137,171 | ||||
| Restricted cash |
| 64 | ||||||
| Accounts receivable, net of allowances of $2,200 and $1,395 at December 31, 2014 and 2013, respectively |
16,876 | 20,240 | ||||||
| Deferred tax assets |
7,458 | 6,505 | ||||||
| Prepaid expenses and other current assets |
13,379 | 13,675 | ||||||
|
|
|
|
|
|||||
| Total current assets |
213,113 | 177,655 | ||||||
| Property and equipment, net |
79,734 | 61,732 | ||||||
| Goodwill |
30,207 | 28,706 | ||||||
| Intangible assets, net |
6,460 | 7,765 | ||||||
| Deferred tax assets, net |
6,353 | 1,282 | ||||||
| Other assets |
10,829 | 9,399 | ||||||
|
|
|
|
|
|||||
| Total assets |
$ | 346,696 | $ | 286,539 | ||||
|
|
|
|
|
|||||
| Liabilities and Shareholders Equity |
||||||||
| Current liabilities: |
||||||||
| Accounts payable |
$ | 8,001 | $ | 9,952 | ||||
| Accrued expenses and other current liabilities |
24,307 | 14,855 | ||||||
| Deferred revenue |
22,592 | 21,163 | ||||||
|
|
|
|
|
|||||
| Total current liabilities |
54,900 | 45,970 | ||||||
| Deferred revenue |
10,241 | 9,029 | ||||||
| Accrued income taxes |
3,164 | 2,094 | ||||||
| Long-term debt |
23,750 | 23,750 | ||||||
| Other liabilities |
2,356 | 3,888 | ||||||
|
|
|
|
|
|||||
| Total liabilities |
94,411 | 84,731 | ||||||
|
|
|
|
|
|||||
| Commitments and contingencies (Note 17) |
||||||||
| Shareholders equity: |
||||||||
| Ordinary shares, 0.015 par value; 66,666,663 shares authorized; 37,875,815 and 37,023,781 shares issued and outstanding at December 31, 2014 and 2013, respectively |
725 | 709 | ||||||
| Deferred shares, 0.01 par value; 5,000,004 shares authorized; 0 and 2,230,334 shares issued and outstanding at December 31, 2014 and 2013, respectively |
| 29 | ||||||
| Additional paid-in capital |
302,881 | 277,084 | ||||||
| Accumulated other comprehensive income |
(970 | ) | 1,812 | |||||
| Accumulated deficit |
(50,351 | ) | (77,826 | ) | ||||
|
|
|
|
|
|||||
| Total shareholders equity |
252,285 | 201,808 | ||||||
|
|
|
|
|
|||||
| Total liabilities and shareholders equity |
$ | 346,696 | $ | 286,539 | ||||
|
|
|
|
|
|||||
The accompanying notes are an integral part of these consolidated financial statements.
73
FLEETMATICS GROUP PLC
CONSOLIDATED STATEMENTS OF OPERATIONS
(In thousands, except share and per share data)
| Year Ended December 31, | ||||||||||||
| 2014 | 2013 | 2012 | ||||||||||
| Subscription revenue |
$ | 231,581 | $ | 177,350 | $ | 127,451 | ||||||
| Cost of subscription revenue |
57,505 | 43,858 | 35,507 | |||||||||
|
|
|
|
|
|
|
|||||||
| Gross profit |
174,076 | 133,492 | 91,944 | |||||||||
|
|
|
|
|
|
|
|||||||
| Operating expenses: |
||||||||||||
| Sales and marketing |
78,885 | 56,589 | 41,138 | |||||||||
| Research and development |
17,090 | 11,036 | 7,379 | |||||||||
| General and administrative |
42,765 | 36,375 | 31,047 | |||||||||
|
|
|
|
|
|
|
|||||||
| Total operating expenses |
138,740 | 104,000 | 79,564 | |||||||||
|
|
|
|
|
|
|
|||||||
| Income from operations |
35,336 | 29,492 | 12,380 | |||||||||
| Interest income (expense), net |
(704 | ) | (1,999 | ) | (2,075 | ) | ||||||
| Foreign currency transaction gain (loss), net |
832 | (1,139 | ) | (24 | ) | |||||||
| Loss on extinguishment of debt |
| | (934 | ) | ||||||||
| Other income (expense), net |
(1 | ) | | (32 | ) | |||||||
|
|
|
|
|
|
|
|||||||
| Income before income taxes |
35,463 | 26,354 | 9,315 | |||||||||
| Provision for (benefit from) income taxes |
7,988 | (4,103 | ) | 3,907 | ||||||||
|
|
|
|
|
|
|
|||||||
| Net income |
27,475 | 30,457 | 5,408 | |||||||||
| Accretion of redeemable convertible preferred shares to redemption value |
| | (335 | ) | ||||||||
|
|
|
|
|
|
|
|||||||
| Net income |
$ | 27,475 | $ | 30,457 | $ | 5,073 | ||||||
|
|
|
|
|
|
|
|||||||
| Net income per share: |
||||||||||||
| Basic |
$ | 0.73 | $ | 0.85 | $ | 0.58 | ||||||
|
|
|
|
|
|
|
|||||||
| Diluted |
$ | 0.71 | $ | 0.82 | $ | 0.50 | ||||||
|
|
|
|
|
|
|
|||||||
| Weighted average ordinary shares outstanding: |
||||||||||||
| Basic |
37,473,442 | 35,722,300 | 8,822,169 | |||||||||
|
|
|
|
|
|
|
|||||||
| Diluted |
38,551,860 | 37,139,839 | 10,084,580 | |||||||||
|
|
|
|
|
|
|
|||||||
The accompanying notes are an integral part of these consolidated financial statements.
74
FLEETMATICS GROUP PLC
CONSOLIDATED STATEMENTS OF REDEEMABLE CONVERTIBLE PREFERRED SHARES AND SHAREHOLDERS EQUITY (DEFICIT)
(In thousands, except share data)
| Series A, B and C Redeemable Convertible Preferred Shares |
Ordinary Shares | Deferred Shares | Additional Paid-In Capital |
Accumulated Other Compre- hensive Income (Loss) |
Accum- ulated Deficit |
Total Share- holders Equity (Deficit) |
||||||||||||||||||||||||||||||||||
| Shares | Amount | Shares |
Par Value |
Shares | Par Value |
|||||||||||||||||||||||||||||||||||
| Balances at December 31, 2011 |
34,634,734 | $ | 130,839 | 1,497,150 | $ | 20 | 2,230,330 | $ | 29 | $ | 2,017 | $ | 560 | $ | (113,691 | ) | $ | (111,065 | ) | |||||||||||||||||||||
| Share-based compensation |
| | | | | | 2,422 | | | 2,422 | ||||||||||||||||||||||||||||||
| Accretion of redeemable convertible preferred shares to redemption value |
| 335 | | | | | (335 | ) | | | (335 | ) | ||||||||||||||||||||||||||||
| Exercises of stock options for ordinary shares |
| | 184,335 | 4 | | | 301 | | | 305 | ||||||||||||||||||||||||||||||
| Excess tax benefits from share-based awards |
| | | | | | (266 | ) | | | (266 | ) | ||||||||||||||||||||||||||||
| Issuance of ordinary shares in initial public offering, net of offering costs |
| | 6,250,000 | 121 | | | 93,192 | | | 93,313 | ||||||||||||||||||||||||||||||
| Conversion of redeemable convertible preferred shares to ordinary shares |
(34,634,734 | ) | (131,174 | ) | 26,653,383 | 515 | | | 130,659 | | | 131,174 | ||||||||||||||||||||||||||||
| Issuance of deferred shares |
| | | | 4 | | | | | | ||||||||||||||||||||||||||||||
| Foreign currency translation adjustments, net of tax of $0 |
| | | | | | | 66 | | 66 | ||||||||||||||||||||||||||||||
| Net income |
| | | | | | | | 5,408 | 5,408 | ||||||||||||||||||||||||||||||
|
|
|
|
|
|
|
|
|
|
|
|
|
|
|
|
|
|
|
|
|
|||||||||||||||||||||
| Balances at December 31, 2012 |
| | 34,584,868 | 660 | 2,230,334 | 29 | 227,990 | 626 | (108,283 | ) | 121,022 | |||||||||||||||||||||||||||||
| Share-based compensation |
| | | | | | 7,470 | | | 7,470 | ||||||||||||||||||||||||||||||
| Exercises of stock options for ordinary shares |
| | 1,424,273 | 29 | | | 5,488 | | | 5,517 | ||||||||||||||||||||||||||||||
| Excess tax benefits from share-based awards |
| | | | | | 3,813 | | | 3,813 | ||||||||||||||||||||||||||||||
| Issuance of ordinary shares in secondary public offering, net of offering costs |
| | 1,000,000 | 20 | | | 32,040 | | | 32,060 | ||||||||||||||||||||||||||||||
| Issuance of ordinary shares under employee stock purchase plan |
| | 14,640 | | | | 283 | | | 283 | ||||||||||||||||||||||||||||||
| Foreign currency translation adjustments, net of tax of $0 |
| | | | | | | 1,186 | | 1,186 | ||||||||||||||||||||||||||||||
| Net income |
| | | | | | | | 30,457 | 30,457 | ||||||||||||||||||||||||||||||
|
|
|
|
|
|
|
|
|
|
|
|
|
|
|
|
|
|
|
|
|
|||||||||||||||||||||
| Balances at December 31, 2013 |
| | 37,023,781 | 709 | 2,230,334 | 29 | 277,084 | 1,812 | (77,826 | ) | 201,808 | |||||||||||||||||||||||||||||
| Share-based compensation |
| | | | | | 13,207 | | | 13,207 | ||||||||||||||||||||||||||||||
| Exercises of stock options for ordinary shares |
| | 608,620 | 12 | | | 2,832 | | | 2,844 | ||||||||||||||||||||||||||||||
| Issuance of ordinary shares for settlement of restricted stock units |
| | 332,502 | 6 | | | (6 | ) | | | | |||||||||||||||||||||||||||||
| Shares withheld related to net settlement of restricted stock units |
| | (125,534 | ) | (2 | ) | | | (4,187 | ) | | | (4,189 | ) | ||||||||||||||||||||||||||
| Excess tax benefits from share-based awards |
| | | | | | 12,973 | | | 12,973 | ||||||||||||||||||||||||||||||
| Issuance of ordinary shares under employee stock purchase plan |
| | 36,446 | | | | 949 | | | 949 | ||||||||||||||||||||||||||||||
| Cancellation of deferred shares |
| | | | (2,230,334 | ) | (29 | ) | 29 | | | | ||||||||||||||||||||||||||||
| Foreign currency translation adjustments, net of tax of $0 |
| | | | | | | (2,782 | ) | | (2,782 | ) | ||||||||||||||||||||||||||||
| Net income |
| | | | | | | | 27,475 | 27,475 | ||||||||||||||||||||||||||||||
|
|
|
|
|
|
|
|
|
|
|
|
|
|
|
|
|
|
|
|
|
|||||||||||||||||||||
| Balances at December 31, 2014 |
| $ | | 37,875,815 | $ | 725 | | $ | | $ | 302,881 | $ | (970 | ) | $ | (50,351 | ) | $ | 252,285 | |||||||||||||||||||||
|
|
|
|
|
|
|
|
|
|
|
|
|
|
|
|
|
|
|
|
|
|||||||||||||||||||||
The accompanying notes are an integral part of these consolidated financial statements.
75
FLEETMATICS GROUP PLC
CONSOLIDATED STATEMENTS OF COMPREHENSIVE INCOME
(In thousands)
| Year Ended December 31, | ||||||||||||
| 2014 | 2013 | 2012 | ||||||||||
| Net income |
$ | 27,475 | $ | 30,457 | $ | 5,408 | ||||||
| Other comprehensive income (loss): |
||||||||||||
| Foreign currency translation adjustment, net of tax of $0 |
(2,782 | ) | 1,186 | 66 | ||||||||
|
|
|
|
|
|
|
|||||||
| Total comprehensive income (loss) |
(2,782 | ) | 1,186 | 66 | ||||||||
|
|
|
|
|
|
|
|||||||
| Comprehensive income |
$ | 24,693 | $ | 31,643 | $ | 5,474 | ||||||
|
|
|
|
|
|
|
|||||||
The accompanying notes are an integral part of these consolidated financial statements.
76
FLEETMATICS GROUP PLC
CONSOLIDATED STATEMENTS OF CASH FLOWS
(In thousands)
| Year Ended December 31, |
||||||||||||
| 2014 | 2013 | 2012 | ||||||||||
| Cash flows from operating activities: |
||||||||||||
| Net income |
$ | 27,475 | $ | 30,457 | $ | 5,408 | ||||||
| Adjustments to reconcile net income to net cash provided by operating activities: |
||||||||||||
| Depreciation and amortization of property and equipment |
21,492 | 12,994 | 9,547 | |||||||||
| Amortization of capitalized in-vehicle devices owned by customers |
1,123 | 960 | 668 | |||||||||
| Amortization of intangible assets |
2,562 | 2,290 | 2,332 | |||||||||
| Amortization of deferred commissions, other deferred costs and debt discount |
8,233 | 6,961 | 4,986 | |||||||||
| Provision for (benefit from) deferred tax assets |
(8,938 | ) | 866 | 6,528 | ||||||||
| Provision for accounts receivable allowances |
2,413 | 1,601 | 1,509 | |||||||||
| Unrealized foreign currency transaction (gain) loss |
(931 | ) | 1,085 | 38 | ||||||||
| Loss on disposal of property and equipment and other assets |
1,740 | 3,086 | 2,182 | |||||||||
| Share-based compensation |
13,207 | 7,470 | 2,422 | |||||||||
| Excess (reversal of) tax benefits from share-based awards |
(12,973 | ) | (3,813 | ) | 266 | |||||||
| Loss on extinguishment of debt, non-cash portion |
| | 405 | |||||||||
| Changes in operating assets and liabilities, net of effects of acquisition: |
||||||||||||
| Accounts receivable |
895 | (12,955 | ) | (4,979 | ) | |||||||
| Prepaid expenses and other current and long-term assets |
3,758 | (11,526 | ) | (11,630 | ) | |||||||
| Accounts payable, accrued expenses and other current liabilities |
7,918 | 10,726 | 963 | |||||||||
| Accrued income taxes |
1,075 | (12,465 | ) | (3,266 | ) | |||||||
| Deferred revenue |
2,694 | 4,174 | (489 | ) | ||||||||
|
|
|
|
|
|
|
|||||||
| Net cash provided by operating activities |
71,743 | 41,911 | 16,890 | |||||||||
|
|
|
|
|
|
|
|||||||
| Cash flows from investing activities: |
||||||||||||
| Purchases of property and equipment |
(37,080 | ) | (34,173 | ) | (25,221 | ) | ||||||
| Capitalization of internal-use software costs |
(3,777 | ) | (2,225 | ) | (883 | ) | ||||||
| Proceeds from sale of property and equipment |
41 | | | |||||||||
| Payment for business acquired, net of cash acquired |
(2,274 | ) | (6,786 | ) | | |||||||
| Net decrease in restricted cash |
64 | | 528 | |||||||||
|
|
|
|
|
|
|
|||||||
| Net cash used in investing activities |
(43,026 | ) | (43,184 | ) | (25,576 | ) | ||||||
|
|
|
|
|
|
|
|||||||
| Cash flows from financing activities: |
||||||||||||
| Proceeds from (payments of) Term Loan |
| (938 | ) | 23,549 | ||||||||
| Proceeds from exercise of stock options |
2,844 | 5,517 | 305 | |||||||||
| Taxes paid related to net share settlement of equity awards |
(4,108 | ) | | | ||||||||
| Proceeds from borrowings under Revolving Credit Facility |
| | 8,286 | |||||||||
| Payments of borrowings under Revolving Credit Facility |
| | (8,286 | ) | ||||||||
| Proceeds from initial public offering, net of offering costs |
| | 94,667 | |||||||||
| Proceeds from secondary public offering, net of offering costs |
| 32,060 | | |||||||||
| Excess (reversal of) tax benefits from share-based awards |
12,973 | 3,813 | (266 | ) | ||||||||
| Payments of Senior Secured Notes |
| | (17,500 | ) | ||||||||
| Payments of previously accrued initial public offering costs |
| (1,355 | ) | | ||||||||
| Payments of capital lease obligations |
(833 | ) | (437 | ) | (369 | ) | ||||||
| Payments of notes payable |
(620 | ) | | | ||||||||
|
|
|
|
|
|
|
|||||||
| Net cash provided by financing activities |
10,256 | 38,660 | 100,386 | |||||||||
|
|
|
|
|
|
|
|||||||
| Effect of exchange rate changes on cash |
(744 | ) | (303 | ) | (228 | ) | ||||||
|
|
|
|
|
|
|
|||||||
| Net increase (decrease) in cash |
38,229 | 37,084 | 91,472 | |||||||||
| Cash, beginning of period |
137,171 | 100,087 | 8,615 | |||||||||
|
|
|
|
|
|
|
|||||||
| Cash, end of period |
$ | 175,400 | $ | 137,171 | $ | 100,087 | ||||||
|
|
|
|
|
|
|
|||||||
| Supplemental disclosure of cash flow information: |
||||||||||||
| Cash paid for interest |
$ | 654 | $ | 1,262 | $ | 1,913 | ||||||
| Cash paid (refunds received) for income taxes |
$ | 1,375 | $ | 4,555 | $ | 1,841 | ||||||
| Supplemental disclosure of non-cash financing and investing activities: |
||||||||||||
| Accretion of redeemable convertible preferred shares to redemption value |
$ | | $ | | $ | 335 | ||||||
| Acquisition of property and equipment and software through capital leases and notes payable |
$ | 3,092 | $ | 427 | $ | 31 | ||||||
| Additions to property and equipment included in accounts payable and accrued expenses at the balance sheet dates |
$ | 1,694 | $ | 1,416 | $ | 2,173 | ||||||
| Initial public offering costs included in accounts payable at the balance sheet dates |
$ | | $ | | $ | 1,354 | ||||||
| Issuance of ordinary shares under employee share purchase plan |
$ | 949 | $ | 283 | $ | | ||||||
The accompanying notes are an integral part of these consolidated financial statements.
77
FLEETMATICS GROUP PLC
NOTES TO CONSOLIDATED FINANCIAL STATEMENTS
(Amounts in thousands, except share and per share data)
1. Nature of the Business
Fleetmatics Group PLC (the Company) is a public limited company incorporated in the Republic of Ireland. On September 21, 2012, the company changed its corporate structure from a private limited company to a public limited company. On that date, the Company became the holding company of Fleetmatics Group Limited (a private limited company incorporated in 2004 in the Republic of Ireland) and its subsidiaries by way of a share-for-share exchange in which the shareholders of Fleetmatics Group Limited exchanged their shares in Fleetmatics Group Limited for identical shares in Fleetmatics Group PLC. Upon the exchange, the historical consolidated financial statements of Fleetmatics Group Limited became the historical consolidated financial statements of Fleetmatics Group PLC.
The Company is a leading global provider of mobile workforce solutions delivered as software-as-a-service (SaaS). Its mobile software platform enables businesses to meet the challenges associated with managing their local fleets of commercial vehicles and improve productivity by extracting actionable business intelligence from real-time and historical vehicle and driver behavioral data. The Company offers intuitive, cost-effective Web-based and mobile solutions that provide fleet operators with visibility into vehicle location, fuel usage, speed and mileage and other insights into their mobile workforce, enabling them to reduce operating and capital costs, as well as increase revenue. An integrated, full-featured mobile workforce management product provides additional efficiencies related to job management by empowering the field worker and expediting the job completion process from quote through payment. New customers for the Companys SaaS offerings typically enter into initial 36-month, non-cancelable subscription agreements for fleet management solutions and 12-month non-cancelable subscription agreements for field service management solutions, with amounts generally billed and due monthly; however, some customers prepay all or part of their contractual obligations quarterly, annually or for the full contract term in exchange for a prepayment discount that is reflected in the pricing of the contract.
2. Summary of Significant Accounting Policies
Basis of Presentation
The accompanying consolidated financial statements have been prepared in conformity with accounting principles generally accepted in the United States of America (GAAP) and include the accounts of the Company and its wholly owned subsidiaries after elimination of all significant intercompany accounts and transactions. All dollar amounts in the financial statements and in the notes to the consolidated financial statements, except share and per share amounts, are stated in thousands of U.S. dollars unless otherwise indicated.
Use of Estimates
The preparation of financial statements in conformity with GAAP requires management to make estimates and assumptions that affect the reported amounts of assets and liabilities at the date of the financial statements, the disclosure of contingencies at the date of the financial statements, and the reported amounts of revenues and expenses during the reporting period. Significant estimates and assumptions reflected in these financial statements include, but are not limited to, the estimated average customer relationship period that is used for recognizing the deferred revenue of up-front fees and for amortizing the related deferred costs of in-vehicle devices, the valuation of accounts receivable reserves and share-based awards, the assessment of amounts qualifying for capitalization as internal-use software, the valuation of assets and liabilities acquired in business combinations, the useful lives of intangible assets and property and equipment, and the accounting for income taxes, including uncertain tax positions and the valuation of net deferred tax assets. Estimates are periodically reviewed in light of changes in circumstances, facts and experience. Actual results could differ materially from the Companys estimates.
78
Fair Value Measurements
Certain assets and liabilities are carried at fair value under GAAP. Fair value is defined as the exchange price that would be received for an asset or paid to transfer a liability (an exit price) in the principal or most advantageous market for the asset or liability in an orderly transaction between market participants on the measurement date. Valuation techniques used to measure fair value must maximize the use of observable inputs and minimize the use of unobservable inputs. A fair value hierarchy based on three levels of inputs, of which the first two are considered observable and the last is considered unobservable, is used to measure fair value:
| | Level 1Quoted prices in active markets for identical assets or liabilities. |
| | Level 2Observable inputs (other than Level 1 quoted prices) such as quoted prices in active markets for similar assets or liabilities, quoted prices in markets that are not active for identical or similar assets or liabilities, or other inputs that are observable or can be corroborated by observable market data. |
| | Level 3Unobservable inputs that are supported by little or no market activity and that are significant to determining the fair value of the assets or liabilities, including pricing models, discounted cash flow methodologies and similar techniques. |
The carrying values of accounts receivable, accounts payable and accrued expenses and other liabilities approximate fair value due to the short-term nature of these assets and liabilities. As of December 31, 2014 and 2013, the Company had no assets or liabilities that would be classified under this fair value hierarchy.
Restricted Cash
The Company is a party to various credit card and merchant services agreements under which it has pledged a continuing security interest in related deposit accounts in order to secure payment and performance of its obligations under the agreements. These restrictions may be lifted by the Company at will by canceling the agreements or reducing the lines of credit under these agreements. As of December 31, 2013, $64 had been classified as restricted cash in the consolidated balance sheets related to these arrangements. In 2014, the Company discontinued the use of certain company issued credit cards, which eliminated the requirement of the $64 restricted cash balance.
Accounts Receivable and Allowance for Doubtful Accounts
Accounts receivable are carried at their original invoice amounts less an allowance for doubtful collections based on estimated losses resulting from the inability or unwillingness of customers to make required payments. The allowance is estimated at each reporting period based upon historical loss patterns, the number of days that billings are past due and an evaluation of the potential risk of loss associated with specific delinquent accounts. The Company also considers any changes to the financial condition of its customers and any other external market factors that could impact the collectibility of its receivables in the determination of its allowance for doubtful accounts.
Concentration of Credit Risk and of Significant Customers
Financial instruments that potentially expose the Company to concentrations of credit risk consist primarily of cash and trade accounts receivable. Although the Company maintains its cash balances with accredited financial institutions, the Company had substantially all cash balances at financial institutions without or in excess of federally insured limits at December 31, 2014 and 2013. The Company does not believe it is subject to unusual credit risk beyond the normal credit risk associated with commercial banking relationships.
No individual customer accounted for more than 10% of total subscription revenue for the years ended December 31, 2014, 2013, and 2012, and no individual customer accounted for more than 10% of net accounts receivable at December 31, 2014, 2013, and 2012.
79
Property and Equipment
Property and equipment are stated at cost less accumulated depreciation or amortization. Depreciation and amortization is recognized using the straight-line method over the following estimated useful lives:
| In-vehicle devicesinstalled |
46 years | |
| Computer equipment |
3 years | |
| Internal-use software |
3 years | |
| Furniture and fixtures |
46 years | |
| Leasehold improvements |
Shorter of life of lease or estimated useful life |
For in-vehicle devices of which the Company retains ownership after they are installed in a customers fleet, the cost of the in-vehicle devices (including installation and shipping costs) is capitalized as property and equipment. The Company depreciates these costs over the minimum estimated useful life of the devices or over the estimated average customer relationship period, which are both currently six years, beginning upon completion of installation. Related depreciation expense is recorded in cost of subscription revenue. If a customer subscription agreement is canceled or expires prior to the end of the expected useful life of the in-vehicle device, the carrying value of the asset is depreciated in full with expense immediately recorded as cost of subscription revenue. Before installation in a customers fleet, in-vehicle devices of which the Company retains ownership are recorded within property and equipment (referred to as In-vehicle devicesuninstalled), but are not depreciated. Furthermore, due to the decommissioning of one of our primary network wireless providers 2G network, during 2014 we began capitalizing the cost of the replacement units in accordance with the capitalization for in-vehicle device costs accounting policy previously disclosed. Any remaining net book value of the replaced 2G units will be fully depreciated at the time of replacement with the 3G units.
At each reporting period, the Company tests in-vehicle devicesinstalled for realizability through a review of customer accounts to identify (i) any significant changes in the financial condition of its customers, (ii) any customers who are past due on subscription payments owed and could become a credit risk, and (iii) any customers whose contract will be expiring without a follow-on renewal prior to the end of the estimated useful life of the in-vehicle device. If an impairment of the value of the in-vehicle device is identified, the carrying value of the in-vehicle device is depreciated in full, with expense immediately recorded as cost of subscription revenue.
Amortization of leasehold improvements is computed on a straight-line basis over the shorter of the lease term or the estimated useful lives of the improvements. Assets held under capital leases are stated at the lesser of the present value of future minimum lease payments or the fair value of the leased asset at the inception of the lease. Amortization of assets under capital leases is computed using the straight-line method over the shorter of the estimate useful life of the asset or the period of the related lease. The cost of expenditures for maintenance and repairs of assets is charged to expense as incurred. Upon retirement or sale, the cost and related accumulated depreciation or amortization of assets disposed of are removed from the accounts and any resulting gain or loss is credited or charged to the consolidated statements of operations.
Internal-Use Software
Research and development costs are expensed as incurred, except for certain costs which are capitalized in connection with the development of its internal-use software and website. These capitalized costs are primarily related to the application software that is hosted by the Company and accessed by its customers through the Companys website. In addition, the Company capitalizes certain general and administrative costs related to the customization and development of our internal business systems.
80
Costs incurred in the preliminary stages of development are expensed as incurred. Once an application has reached the development stage, internal and external costs, if direct and incremental, are capitalized until the software is substantially complete and ready for its intended use. Capitalization ceases upon completion of all substantial testing performed to ensure the product is ready for its intended use. The Company also capitalizes costs related to specific upgrades and enhancements of internal-use software when it is probable that the expenditures will result in additional functionality. Maintenance and training costs are expensed as incurred. Capitalized internal-use software costs are recorded as part of property and equipment and are amortized on a straight-line basis over an estimated useful life of three years.
Business Combinations
In an acquisition of a business, the Company recognizes separately from goodwill the fair value of assets acquired and the liabilities assumed. Goodwill as of the acquisition date is measured as the excess of consideration transferred over the net of the acquisition-date fair values of the assets acquired and liabilities assumed. Transaction costs related to business combinations are expensed as incurred.
In addition, uncertain tax positions assumed and valuation allowances related to the net deferred tax assets acquired in connection with a business combination are estimated as of the acquisition date and recorded as part of the purchase. Thereafter, any changes to these uncertain tax positions and valuation allowances are recorded as part of the provision for income taxes in the consolidated statements of operations.
Goodwill and Other Intangible Assets
The Company records goodwill when the consideration paid in a business acquisition exceeds the fair value of the net tangible assets acquired, identifiable intangible assets acquired and liabilities assumed. Goodwill is not amortized.
Definite-lived intangible assets subject to amortization include customer relationships, trademarks, acquired developed technology, and a patent for the Companys vehicle tracking system. Intangible assets acquired in a business combination are recorded under the acquisition method of accounting at their estimated fair values at the date of acquisition. Customer relationships, trademarks and acquired developed technology are amortized over their estimated useful lives, which range from three to nine years, based on a straight-line method or based on the pattern over which the Company expects to consume the economic benefit of each asset, which in general reflects the expected cash flows from each asset. The patent is amortized over its useful life of 20 years on a straight-line basis, as the pattern of consumption of the economic benefit of the asset cannot be reliably determined.
Impairment of Goodwill and Long-Lived Assets
Goodwill is tested for impairment annually or more frequently if events or circumstances occur that indicate an impairment may exist. Factors the Company considers important that could trigger an impairment review include significant underperformance relative to historical or projected operating results, significant changes in the Companys use of the acquired assets in a business combination or the strategy for its overall business, and significant negative industry or economic trends. The Company performs its annual assessment for impairment of goodwill on October 31 and has determined it has a single reporting unit for testing goodwill for impairment. For purposes of assessing potential impairment, the Company first estimates the fair value of the reporting unit (based on the fair value of the Companys outstanding ordinary shares) and compares that amount to the carrying value of the reporting unit (as reflected by the total carrying values of the Companys shareholders equity. If the Company determines that the carrying value of the reporting unit exceeds its fair value, then the implied fair value of the goodwill is determined in the same manner used to determine the amount of goodwill in a business combination. If the carrying value of goodwill exceeds the implied fair value of the goodwill, an impairment charge is recognized in the amount equal to that excess. We have assigned the entire balance of goodwill to our one reporting unit. The fair value of the reporting unit was based on our market capitalization as of each of
81
December 31, 2014 and 2013, and it was substantially in excess of the carrying value of the reporting unit at each date. No goodwill impairment charges were recorded during the years ended December 31, 2014, 2013, and 2012.
Long-lived assets include property and equipment and definite-lived intangible assets subject to amortization. The Company evaluates its long-lived assets for recoverability whenever events or changes in circumstances indicate that their carrying values may not be recoverable. Factors that the Company considers in deciding when to perform an impairment review include significant underperformance of the business or product line in relation to expectations, significant negative industry or economic trends, and significant changes or planned changes in the use of the assets. To evaluate a long-lived asset for recoverability, the Company compares forecasts of undiscounted cash flows expected to result from the use and eventual disposition of the long-lived asset to its carrying value. If the carrying value exceeds the sum of the expected undiscounted cash flows, an impairment loss on the long-lived asset to be held and used is recognized based on the excess of the assets carrying value over its fair value, determined based on discounted cash flows. Long-lived assets to be disposed of are reported at the lower of carrying value or fair value less cost to sell.
Deferred Offering Costs
The Company capitalizes as other assets in the consolidated balance sheet certain legal, accounting and other third-party fees that are directly associated with in-process equity financings until such financings are consummated. After consummation of the equity financing, these costs are recorded in shareholders equity (deficit) as a reduction of the additional paid-in capital generated as a result of the offering. Should an equity financing no longer be considered probable of being consummated, the deferred offering costs would be expensed immediately as a charge to operating expenses in the consolidated statement of operations.
Subscription Revenue Recognition
The Company provides access to its software through subscription arrangements whereby the customer is charged a per subscribed-vehicle fee for access for a specified term. Subscription agreements contain multiple service elements and deliverables, including installation of in-vehicle devices, access to the Companys on-demand software via its website, and support services delivered over the term of the arrangement. Agreements do not provide customers the right to take possession of the software at any time. The Company has determined that the elements of its subscription agreements do not have value to the customer on a standalone basis. As a result, the multiple elements within the subscription agreements do not qualify for treatment as separate units of accounting. Accordingly, the Company accounts for all fees received under its subscription agreements as a single unit of accounting and, except for any up-front fees, recognizes the total fee amount ratably on a daily basis over the term of the subscription agreement. The Company only commences recognition of revenue when there is persuasive evidence of an arrangement, the fee is fixed or determinable, collectibility is deemed reasonably assured, and recurring services have commenced. The Companys initial subscription agreements typically have contract terms of 36 months for fleet management customers and 12 months for field service management customers.
For the limited number of customer arrangements in which title to the in-vehicle devices transfers to the customer upon delivery or installation of the in-vehicle device, the Company receives an up-front fee from the customer. As the in-vehicle devices do not have value to the customer on a standalone basis, the delivery or installation of the in-vehicle devices does not represent the culmination of a separate earning process associated with the payment of the up-front fee. Accordingly, the Company records the amount of the up-front fee as deferred revenue upon invoicing and recognizes that amount as revenue ratably on a daily basis over the estimated average customer relationship period of six years, which is longer than the typical subscription agreement term of 36 months. If a customer permanently ceases use of the Companys subscription service at any point when a balance of deferred revenue from this up-front payment exists, the Company recognizes the
82
remaining balance of the deferred revenue in the period of notification. Changes in the typical customer contractual term, customer behavior, competition or economic conditions could affect the Companys estimates of the average customer relationship period. The Company reviews the estimated average customer relationship period on an annual basis and accounts for changes prospectively. In the majority of its sales transactions, the Company retains ownership of the in-vehicle device, and consequently the Company does not sell the device to the customer.
Deferred Revenue
Deferred revenue represents amounts billed to customers or payments received from customers for which revenue has not yet been recognized. Deferred revenue primarily consists of prepayments made by customers for future periods and, to a lesser extent, the unearned portion of monthly billed subscription fees and up-front payments from customers for in-vehicle devices whose ownership transfers to them upon delivery or installation. Prior to 2011, some customer contracts were paid in advance for the full, multiple-year term. Since that time, the Companys payment terms are typically monthly in advance; however, the Company continues to enable its customers to prepay all or part of their contractual obligations quarterly, annually or for the full contract term in exchange for a prepayment discount that is reflected in the pricing of the contract. As a result, the deferred revenue balance does not represent the total contract value of all multi-year, non-cancelable subscription agreements. In the consolidated balance sheets, deferred revenue that is expected to be recognized within one year is recorded as current deferred revenue while the remaining portion is recorded as non-current deferred revenue.
Deferred Commissions
The Company capitalizes commission costs that are incremental and directly related to the acquisition of customer contracts. For the majority of its customer contracts, the Company pays commissions in full when it receives the initial customer contract for a new subscription or a renewal subscription. For all other customer contracts, the Company pays commissions in full when it receives the initial customer payment for a new subscription or a renewal subscription. Commission costs are capitalized upon payment and are amortized as expense ratably over the term of the related non-cancelable customer contract, in proportion to the recognition of the subscription revenue. If a subscription agreement is terminated, the unamortized portion of any deferred commission cost is recognized as expense immediately.
Commission costs capitalized during the years ended December 31, 2014 and 2013 totaled $11,995 and $8,945, respectively. Amortization of deferred commissions totaled $8,175, $6,119 and $4,693 for the years ended December 31, 2014, 2013, and 2012, respectively, and is included in sales and marketing expense in the consolidated statements of operations. Deferred commission costs, net of amortization, are included in other current and long-term assets in the consolidated balance sheets and totaled $15,496 and $11,747 as of December 31, 2014 and 2013, respectively. Foreign exchange differences also contribute to changes in the net amount of these deferred commission costs.
Capitalized In-Vehicle Device Costs
For the limited number of customer arrangements in which title to the in-vehicle devices transfers to the customer upon delivery or installation of the in-vehicle device (for which the Company receives an up-front fee from the customer), the Company defers the costs of the installed in-vehicle devices (including installation and shipping costs) as they are directly related to the revenue that the Company derives from the sale of the devices and that it recognizes ratably over the estimated average customer relationship period of six years. The Company capitalizes these in-vehicle device costs and amortizes the deferred costs as expense ratably over the estimated average customer relationship period, in proportion to the recognition of the up-front fee revenue.
Costs of in-vehicle devices owned by customers that were capitalized during the years ended December 31, 2014 and 2013 totaled $149 and $402, respectively. Amortization of these capitalized costs totaled $1,123, $960, and $668 for the years ended December 31, 2014, 2013, and 2012, respectively, and is included in cost of
83
subscription revenue in the consolidated statements of operations. Capitalized costs related to these in-vehicle devices of which title has transferred to customers, net of amortization, are included in other current and long-term assets in the consolidated balance sheets which totaled $2,398 and $3,782 as of December 31, 2014 and 2013, respectively.
Income Taxes
The Company accounts for income taxes using the asset and liability method, which requires the recognition of deferred tax assets and liabilities for the expected future tax consequences of events that have been recognized in the financial statements or in the Companys tax returns. Deferred taxes are determined based on the difference between the financial statement and tax basis of assets and liabilities using enacted tax rates in effect in the years in which the differences are expected to reverse. Changes in deferred tax assets and liabilities are recorded in the provision for income taxes. The Company assesses the likelihood that its deferred tax assets will be recovered from future taxable income and, to the extent it believes, based upon the weight of available evidence, that it is more likely than not that all or a portion of deferred tax assets will not be realized, a valuation allowance is established through a charge to income tax expense. Potential for recovery of deferred tax assets is evaluated by estimating the future taxable profits expected from each subsidiary and considering prudent and feasible tax planning strategies.
The Company accounts for uncertainty in income taxes recognized in its financial statements by applying a two-step process to determine the amount of tax benefit to be recognized. First, the tax position must be evaluated to determine the likelihood that it will be sustained upon examination by the taxing authorities, based on the technical merits of the position. If the tax position is deemed more-likely-than-not to be sustained, the tax position is then assessed to determine the amount of benefit to recognize in the financial statements. The amount of the benefit that may be recognized is the largest amount that has a greater than 50% likelihood of being realized upon ultimate settlement. The provision for income taxes includes the effects of any resulting tax reserves, or unrecognized tax benefits, that are considered appropriate as well as the related net interest and penalties.
Foreign Currency Translation
The Companys reporting currency is the U.S. dollar. The Company has subsidiaries in the United States, Ireland, the United Kingdom, Australia, Mexico, Italy and the Netherlands. The functional currency for each of the Companys subsidiaries is the local currency. For those subsidiaries whose functional currency is not the U.S. dollar, assets and liabilities are translated into U.S. dollar equivalents at the exchange rate in effect on the balance sheet date and revenues from customers and expenses incurred are translated into U.S. dollars using the average exchange rate over the period. Resulting currency translation adjustments are recorded in accumulated other comprehensive income (loss) in the consolidated balance sheet. For the years ended December 31, 2014 and 2013, the Company recorded currency translation gains (losses) of $(2,782) and $1,186, respectively, as foreign currency translation adjustments within shareholders equity (deficit).
The Company also incurs transaction gains and losses resulting from intercompany transactions of a short-term nature as well as transactions with customers or vendors denominated in currencies other than the functional currency of the legal entity in which the transaction is recorded. Assets and liabilities arising from such transactions are translated into the legal entitys functional currency using the exchange rate in effect at the balance sheet date. Any resulting transaction gains or losses are recorded as foreign currency transaction gain (loss) in the consolidated statements of operations. Net foreign currency transaction gains (losses) of $832, $(1,139), and $(24) were recorded for the years ended December 31, 2014, 2013 and 2012, respectively.
The Company has concluded that its reporting currency is the U.S. dollar because the parent entity has received U.S. dollars upon the issuance of all equity securities to investors, the parents cash is held exclusively in U.S. dollar bank accounts, the parents intercompany transactions (primarily receivables from subsidiaries) are denominated in U.S. dollars, and a majority of its parent-related expenses are billed by vendors and paid in U.S. dollars.
84
Share-Based Compensation
The Company recognizes expense for stock options, market-based restricted stock awards and time-based restricted stock awards pursuant to ASC 718, CompensationStock Compensation (ASC 718), which requires recognition of share-based compensation expense in the statement of operations over the vesting period based on the fair value of the award at the grant date. The fair value of the awards is recognized as expense, net of estimated forfeitures, over the requisite service period, which is generally the vesting period of the respective award. The straight-line method of expense recognition is applied to all awards with service conditions, while the graded-vesting method of expense recognition is applied to all awards with both service and performance conditions. The Company classifies share-based compensation expense in the consolidated statements of operations in the same manner in which the award recipients payroll costs are classified.
The Company has share-based employee compensation plans which are described more fully in Note 15 to these consolidated financial statements.
Advertising Expense
Advertising costs are expensed as incurred. Advertising expense was $18,864, $11,097 and $6,471 for the years ended December 31, 2014, 2013 and 2012, respectively, and was included in sales and marketing expense in the consolidated statements of operations.
Comprehensive Income (Loss)
Comprehensive income (loss) is comprised of net income (loss) and other comprehensive income (loss), which includes certain changes in shareholders deficit that are excluded from net income (loss). For the years ended December 31, 2014, 2013 and 2012, the only item qualifying as other comprehensive income (loss) was foreign currency translation. For purposes of comprehensive income (loss) computations, the Company does not record income tax provisions or benefits for foreign currency translation adjustments as the Company intends to permanently reinvest undistributed earnings of its foreign subsidiaries in the United States and the United Kingdom. As of December 31, 2014, the Companys material foreign subsidiaries in the United States and the United Kingdom had no undistributed earnings.
Net Income (Loss) Per Share
Upon the closing of the Companys IPO on October 11, 2012, all of the Companys outstanding redeemable convertible preferred shares were converted into ordinary shares. Prior to this conversion, the Company followed the two-class method when computing net income (loss) per share as the Company had issued shares that meet the definition of participating securities. The two-class method determines net income (loss) per share for each class of ordinary and participating securities according to dividends declared or accumulated and participation rights in undistributed earnings. The two-class method requires income available to ordinary shareholders for the period to be allocated between ordinary and participating securities based upon their respective rights to receive dividends as if all income for the period had been distributed. The Companys redeemable convertible preferred shares contractually entitled the holders of such shares to participate in dividends, but did not contractually require the holders of such shares to participate in losses of the Company. Accordingly, the two-class method did not apply for periods in which the Company reported a net loss or a net loss attributable to ordinary shareholders resulting from dividends, accretion or modifications to its redeemable convertible preferred shares.
Basic net income (loss) per share attributable to ordinary shareholders is computed by dividing the net income (loss) attributable to ordinary shareholders by the weighted average number of ordinary shares outstanding for the period. Diluted net income (loss) per share attributable to ordinary shareholders is computed by dividing the diluted net income (loss) attributable to ordinary shareholders by the weighted average number of ordinary shares, including potential dilutive ordinary shares assuming the dilutive effect of outstanding stock options and unvested restricted ordinary shares, as determined using the treasury stock method. For periods in
85
which the Company has reported net losses, diluted net loss per ordinary share attributable to ordinary shareholders is the same as basic net loss per ordinary share attributable to ordinary shareholders, since dilutive ordinary shares are not assumed to have been issued if their effect is antidilutive.
Segment Data
The Company identifies operating segments as components of an entity for which discrete financial information is available and is regularly reviewed by the chief operating decision maker, or decision-making group, in making decisions regarding resource allocation and performance assessment. The Company defines the term chief operating decision maker to be its Chief Executive Officer. The Company has determined it operates in one segment, as its chief operating decision maker reviews financial information presented on only a consolidated basis (without any disaggregated revenue or operating income financial data) for purposes of allocating resources and evaluating financial performance.
Recently Issued and Adopted Accounting Pronouncements
In August 2014, the Financial Accounting Standards Board (FASB) issued Accounting Standards Update (ASU) 2014-15, Presentation of Financial StatementsGoing Concern (ASU 2014-15). ASU 2014-15 addresses managements responsibility to evaluate whether there is substantial doubt about an entitys ability to continue as a going concern and to provide related footnote disclosures. Managements evaluation should be based on relevant conditions and events that are known and reasonably knowable at the date that the financial statements are issued. The standard will be effective for the first interim period within annual reporting periods beginning after December 15, 2016. Early adoption is permitted. The adoption of this guidance is not expected to have a material impact on the Companys consolidated financial position, results of operations or cash flows.
In May 2014, the FASB issued ASU 2014-09, Revenue from Contracts with Customers (ASU 2014-09), which supersedes nearly all existing revenue recognition guidance under GAAP. The core principle of ASU 2014-09 is to recognize revenues when promised goods or services are transferred to customers in an amount that reflects the consideration to which an entity expects to be entitled for those goods or services. ASU 2014-09 defines a five-step process to achieve this core principle and, in doing so, more judgment and estimates may be required within the revenue recognition process than are required under existing GAAP. The standard is effective for annual periods beginning after December 15, 2016, and interim periods therein, using either of the following transition methods: (i) a full retrospective approach reflecting the application of the standard in each prior reporting period with the option to elect certain practical expedients, or (ii) a retrospective approach with the cumulative effect of initially adopting ASU 2014-09 recognized at the date of adoption (which includes additional footnote disclosures). The Company is currently evaluating the impact of its pending adoption of ASU 2014-09 on the Companys consolidated financial statements and has not yet determined the method by which the Company will adopt the standard in 2017.
In July 2013, the FASB issued ASU 2013-11, Presentation of an Unrecognized Tax Benefit When a Net Operating Loss Carryforward, a Similar Tax Loss, or a Tax Credit Carryforward Exists (ASU 2013-11). ASU 2013-11 clarifies guidance and eliminates diversity in practice on the presentation of unrecognized tax benefits when a net operating loss carryforward, a similar tax loss, or a tax credit carryforward exists at the reporting date. The Company adopted this standard in 2014, and it did not have a material effect on its consolidated financial position, results of operations or cash flows.
In March 2013, the FASB issued ASU 2013-05, Foreign Currency Matters (ASU 2013-05). ASU 2013-05 addresses a parents accounting for the cumulative translation adjustment upon derecognition of certain subsidiaries or group of assets within a foreign entity or of an investment in a foreign entity. The objective of this guidance is to resolve the diversity in practice about the appropriate guidance to apply to the release of the cumulative translation adjustment into net income when a parent either sells a part or all of its investment in a foreign entity or no longer holds a controlling financial interest in a subsidiary or a business within a foreign
86
entity. ASU 2013-05 provides that the entire amount of the cumulative translation adjustment associated with the foreign entity would be released when there has been a sale of a subsidiary or group of net assets within a foreign entity and the sale represents the substantially complete liquidation of the investment in the foreign entity. ASU 2013-05 is effective for fiscal years, and interim periods within those fiscal years, beginning on or after December 15, 2013. The Company adopted this standard in 2014, and it did not have a material effect on its consolidated financial position, results of operations or cash flows.
3. Prepaid Expenses and Other Current Assets
Prepaid expenses and other current assets consisted of the following at December 31, 2014 and 2013:
| Year Ended December 31, |
||||||||
| 2014 | 2013 | |||||||
| Deferred commission costs |
$ | 8,074 | $ | 6,122 | ||||
| Prepaid taxes/taxes receivable |
1,588 | 2,438 | ||||||
| Prepaid insurance |
1,021 | 571 | ||||||
| Prepaid software license fees and support |
854 | 528 | ||||||
| Capitalized costs of in-vehicle devices owned by customers |
360 | 861 | ||||||
| Prepaid subscription service fees |
21 | 529 | ||||||
| Rebate receivable |
| 1,096 | ||||||
| Other |
1,461 | 1,530 | ||||||
|
|
|
|
|
|||||
| Total |
$ | 13,379 | $ | 13,675 | ||||
|
|
|
|
|
|||||
4. Property and Equipment
Property and equipment consisted of the following at December 31, 2014 and 2013:
| Year Ended December 31, |
||||||||
| 2014 | 2013 | |||||||
| In-vehicle devicesinstalled(1) |
$ | 108,181 | $ | 96,431 | ||||
| In-vehicle devicesuninstalled |
5,541 | 4,550 | ||||||
| Computer equipment |
10,065 | 6,645 | ||||||
| Internal-use software |
7,815 | 4,806 | ||||||
| Furniture and fixtures |
1,981 | 1,873 | ||||||
| Leasehold improvements |
2,477 | 1,813 | ||||||
|
|
|
|
|
|||||
| Total property and equipment |
154,315 | 116,118 | ||||||
| Less: Accumulated depreciation and amortization(1) |
(56,326 | ) | (54,386 | ) | ||||
|
|
|
|
|
|||||
| Property and equipment, net |
$ | 79,734 | $ | 61,732 | ||||
|
|
|
|
|
|||||
| (1) | During the year ended December 31, 2014, the Company removed $18,254 of fully depreciated in-vehicle devices no longer in service. |
Depreciation and amortization expense related to property and equipment for the years ended December 31, 2014, 2013, and 2012 totaled $21,492, $12,994, and $9,547, respectively, of which $19,416, $11,684, and $8,744 was recorded in cost of subscription revenue related to depreciation of installed in-vehicle devices and amortization of internal-use software and the remainder was included in various operating expenses. The carrying value of installed in-vehicle devices (including shipping and installation costs), net of accumulated depreciation, was $61,804 and $48,373 at December 31, 2014 and 2013, respectively.
During the years ended December 31, 2014 and 2013, the Company capitalized costs of $3,777 and $2,225, respectively, associated with the development of its internal-use software related to its on-demand software accessed by customers via its website as well as customization and development of its internal business systems.
87
Amortization expense of the internal-use software totaled $1,245, $482, and $573 during the years ended December 31, 2014, 2013, and 2012, respectively. The carrying value of capitalized internal-use software was $5,235 and $3,192 as of December 31, 2014 and 2013, respectively. Foreign exchange differences also contribute to changes in the carrying value of internal-use software.
As of December 31, 2014 and 2013, the gross amount of assets under capital leases totaled $3,327 and $1,593, respectively, and related accumulated amortization totaled $1,459 and $874, respectively.
During the years ended December 31, 2014, 2013, and 2012, the Company expensed $1,739, $3,086, and $2,150, respectively, associated with the replacement of installed in-vehicle devices resulting from the Companys proactive migration to the most recent technology and to a lesser degree a required replacement of those devices. The expense was recorded in cost of subscription revenue and is included in loss on disposal of property and equipment and other assets in the consolidated statements of cash flows.
5. Business Combinations
On May 23, 2014, Fleetmatics acquired all of the stock and equity interests of Florence, Italy-based KKT Srl (KKT), the developer of Routist, a SaaS-based, intelligent routing solution for businesses looking to optimize the utilization of their fleet and mobile resources, pursuant to a Quota Sale and Purchase Agreement (the Purchase and Sale Agreement). The total consideration of $2,295 consisted entirely of cash paid to acquire all of the assets of KKT and to assume a nominal amount of liabilities. The excess of the purchase price over the fair values of assets acquired and liabilities assumed was recorded as goodwill of $1,501.
The following table summarizes the purchase price for KKT and the estimated fair values of the separately identifiable assets acquired and liabilities assumed as of May 23, 2014:
| Purchase consideration: |
||||
| Total purchase price, net of cash acquired |
$ | 2,274 | ||
| Cash acquired |
21 | |||
|
|
|
|||
| Total purchase consideration |
$ | 2,295 | ||
|
|
|
|||
| Assets acquired and liabilities assumed: |
||||
| Cash |
$ | 21 | ||
| Accounts receivable |
51 | |||
| Other current assets |
18 | |||
| Deferred tax assets |
13 | |||
| Identifiable intangible assets |
1,169 | |||
| Goodwill |
1,501 | |||
|
|
|
|||
| Total assets acquired, inclusive of goodwill |
2,773 | |||
| Accounts payable, accrued expenses and other current liabilities |
(40 | ) | ||
| Deferred tax liabilities |
(362 | ) | ||
| Other long-term liabilities |
(76 | ) | ||
|
|
|
|||
| Total liabilities assumed |
(478 | ) | ||
|
|
|
|||
| Total |
$ | 2,295 | ||
|
|
|
The estimated fair value of the intangible assets acquired as of the acquisition date was $1,169 with a useful life of three years. The acquired intangible assets consisted of developed technology and was valued using the replacement cost approach. In September 2014, the Company recorded $46 as a purchase price adjustment resulting from a minimum working capital requirement pursuant to the Purchase and Sale Agreement. The $46 working capital adjustment has been reflected in the purchase price allocation table above.
88
The results of KKT have been included in the consolidated financial statements from the acquisition date of May 23, 2014. The results of KKT were not included in pro forma combined historical results of operation of the Company as they are not material.
On August 1, 2013, the Company acquired all of the stock and equity interests of Connect2Field Holdings Pty Limited (Connect2Field), an Australian-based privately-held software product company whose Web-based and mobile applications are delivered as SaaS. The total consideration of $6,935 consisted entirely of cash paid to acquire all of the assets of Connect2Field and to assume a nominal amount of liabilities. The excess of the purchase price over the fair values of assets acquired and liabilities assumed was recorded as goodwill of $3,827. This acquisition reflects the Companys strategy to acquire new customers and increase sales to existing customers by offering complementary products and technologies.
The following table summarizes the purchase price for Connect2Field and the estimated fair values of the separately identifiable assets acquired and liabilities assumed as of August 1, 2013:
| Purchase consideration: |
||||
| Total purchase price, net of cash acquired |
$ | 6,786 | ||
| Cash acquired |
149 | |||
|
|
|
|||
| Total purchase consideration |
$ | 6,935 | ||
|
|
|
|||
| Assets acquired and liabilities assumed: |
||||
| Cash |
$ | 149 | ||
| Accounts receivable |
3 | |||
| Identifiable intangible assets |
3,038 | |||
| Goodwill |
3,827 | |||
|
|
|
|||
| Total assets acquired, inclusive of goodwill |
7,017 | |||
| Accounts payable, accrued expenses and other current liabilities |
(63 | ) | ||
| Deferred revenue |
(19 | ) | ||
|
|
|
|||
| Total liabilities assumed |
(82 | ) | ||
|
|
|
|||
| Total |
$ | 6,935 | ||
|
|
|
The estimated fair value of the intangible assets acquired as of the acquisition date was $3,038 with a useful life of three years. The acquired intangible assets consisted of developed technology and was valued using the cost of reproduction method. In November 2013, the Company recorded $65 as a purchase price adjustment resulting from a minimum working capital requirement pursuant to the Purchase and Sale Agreement. The $65 working capital adjustment has been reflected in the purchase price allocation table above.
The results of Connect2Field have been included in the consolidated financial statements from the acquisition date of August 1, 2013. The results of Connect2Field were not included in pro forma combined historical results of operation of the Company as they are not material.
6. Goodwill and Intangible Assets
As of December 31, 2014 and 2013, the carrying amount of goodwill was $30,207 and $28,706, respectively, and resulted from the acquisition of KKT in May 2014, Connect2Field in August 2013 and SageQuest in July 2010. The Company completed its annual impairment test of goodwill on October 31, 2014. No impairment of goodwill was recorded during the years ended December 31, 2014, 2013 and 2012.
89
The changes in the carrying amount of goodwill for the years ended December 31, 2014 and 2013 were as follows (in thousands):
| Year Ended December 31, |
||||||||
| 2014 | 2013 | |||||||
| Beginning balance |
$ | 28,706 | $ | 24,879 | ||||
| Acquisition of Connect2Field |
| 3,827 | ||||||
| Acquisition of KKT |
1,501 | | ||||||
|
|
|
|
|
|||||
| Total |
$ | 30,207 | $ | 28,706 | ||||
|
|
|
|
|
|||||
Intangible assets consisted of the following as of December 31, 2014 and 2013, with gross and net amounts of foreign currency-denominated intangible assets reflected at December 31, 2014 and 2013 exchange rates, respectively:
| December 31, 2014 | ||||||||||||
| Gross Amount |
Accumulated Amortization |
Carrying Value |
||||||||||
| Customer relationships |
$ | 11,100 | $ | (7,471 | ) | $ | 3,629 | |||||
| Acquired developed technology |
5,506 | (2,822 | ) | 2,684 | ||||||||
| Trademarks |
400 | (387 | ) | 13 | ||||||||
| Patent |
219 | (85 | ) | 134 | ||||||||
|
|
|
|
|
|
|
|||||||
| Total |
$ | 17,225 | $ | (10,765 | ) | $ | 6,460 | |||||
|
|
|
|
|
|
|
|||||||
| December 31, 2013 | ||||||||||||
| Gross Amount |
Accumulated Amortization |
Carrying Value |
||||||||||
| Customer relationships |
$ | 11,100 | $ | (6,155 | ) | $ | 4,945 | |||||
| Acquired developed technology |
4,338 | (1,724 | ) | 2,614 | ||||||||
| Trademarks |
400 | (359 | ) | 41 | ||||||||
| Patent |
248 | (83 | ) | 165 | ||||||||
|
|
|
|
|
|
|
|||||||
| Total |
$ | 16,086 | $ | (8,321 | ) | $ | 7,765 | |||||
|
|
|
|
|
|
|
|||||||
Amortization expense related to intangible assets was $2,562, $2,290 and $2,332 for the years ended December 31, 2014, 2013 and 2012, respectively. Amortization expense of $1,218, $631 and $383 for the years ended December 31, 2014, 2013 and 2012, respectively, was included in the cost of subscription revenues in the consolidated statements of operations, and amortization expense of $1,344, $1,659 and $1,949 for the years ended December 31, 2014, 2013 and 2012, respectively, was included in sales and marketing expense in the consolidated statements of operations.
The estimated future amortization expense of intangible assets as of December 31, 2014 is as follows:
| Years Ending December 31, |
||||
| 2015 |
$ | 2,565 | ||
| 2016 |
1,915 | |||
| 2017 |
869 | |||
| 2018 |
572 | |||
| 2019 |
466 | |||
| Thereafter |
73 | |||
|
|
|
|||
| Total |
$ | 6,460 | ||
|
|
|
|||
90
7. Other Assets
Other assets (non-current) consisted of the following as of December 31, 2014 and 2013:
| Year Ended December 31, |
||||||||
| 2014 | 2013 | |||||||
| Deferred commission costs |
$ | 7,423 | $ | 5,625 | ||||
| Capitalized costs of in-vehicle devices owned by customers |
2,037 | 2,921 | ||||||
| Other |
1,369 | 853 | ||||||
|
|
|
|
|
|||||
| Total |
$ | 10,829 | $ | 9,399 | ||||
|
|
|
|
|
|||||
8. Accrued Expenses and Other Current Liabilities
Accrued expenses and other current liabilities consisted of the following as of December 31, 2014 and 2013:
| Year Ended December 31, |
||||||||
| 2014 | 2013 | |||||||
| Accrued payroll and related expenses |
$ | 10,862 | $ | 7,720 | ||||
| Accrued professional fees |
3,137 | 1,782 | ||||||
| Accrued income taxes |
1,869 | 23 | ||||||
| Accrued marketing expense |
934 | 374 | ||||||
| Accrued insurance expense |
337 | 723 | ||||||
| Accrued litigation settlements |
| 758 | ||||||
| Other |
7,168 | 3,475 | ||||||
|
|
|
|
|
|||||
| Total |
$ | 24,307 | $ | 14,855 | ||||
|
|
|
|
|
|||||
9. Other Liabilities
Other liabilities (non-current) consisted of the following as of December 31, 2014 and 2013:
| Year Ended December 31, |
||||||||
| 2014 | 2013 | |||||||
| Accrued rent |
$ | 1,371 | $ | 1,281 | ||||
| Capital lease obligations |
918 | 147 | ||||||
| Deferred tax liabilities |
| 2,460 | ||||||
| Other |
67 | | ||||||
|
|
|
|
|
|||||
| Total |
$ | 2,356 | $ | 3,888 | ||||
|
|
|
|
|
|||||
10. Long-term Debt
Senior Secured Notes
In conjunction with the SageQuest acquisition on July 30, 2010, the Company entered into a credit agreement with D.E. Shaw Direct Capital Portfolios, LLC (DE Shaw) for $17,500 of senior secured notes (the Senior Secured Notes). All of the assets of the Company, inclusive of the SageQuest assets acquired, were used to collateralize the Senior Secured Notes.
91
Principal amounts under the Senior Secured Notes were payable in monthly installments commencing March 2012 and continuing through the maturity date on July 30, 2014. Prepayment of the Senior Secured Notes would have been required upon (a) the sale of substantially all of the Companys assets or a change in control upon the sale of equity, (b) the disposition, involuntary or voluntary, of any asset in a single transaction or series of related transactions in excess of $50, subject to permitted reinvestment, (c) a registered firm commitment underwritten public offering by the Company of its ordinary shares resulting in aggregate gross cash proceeds greater than $50,000 and in which the initial price to the public is at least $13.91 per share, as adjusted for any share capital subdivision or consolidation (a Qualified Public Offering), and (d) any excess cash flow generated by the Company, defined as (i) positive cash flow from operations, plus (ii) any cash flow from extraordinary receipts, less (iii) repayments of the Senior Secured Notes, less (iv) the unfinanced cash portion of capital expenditures net of any proceeds received from sales of fixed assets (each, a Prepayment Event). The maximum prepayment due upon a Prepayment Event would have varied based on the date that the Prepayment Event had occurred: prior to July 30, 2012, 103% of the principal balance plus accrued and unpaid interest would have been due; from July 31, 2012 through July 30, 2013, 101% of the principal balance plus accrued and unpaid interest would have been due; July 31, 2013 and thereafter, 100% of the principal balance plus accrued and unpaid interest would have been due. However, the prepayment would have been limited to the net proceeds generated in the Prepayment Event, except for in the case of excess cash flow. In the case of excess cash flow, the prepayment would have been limited to 50% of such excess cash flow.
The Senior Secured Notes bore interest at a floating rate of one-month LIBOR plus 9.50% per annum (based on actual days), but not less than 12.5%. As of December 31, 2011, the actual interest rate was 12.5%. Interest was payable monthly in arrears, commencing September 1, 2010 until the Senior Secured Notes were repaid in full. In the event of default and until the event of default was cured or waived, the interest rate was to be 2.5% per annum higher than the otherwise applicable interest rate.
On the issuance date, the Senior Secured Notes were recorded in the consolidated balance sheet net of discount of $690, related to fees assessed by the lender at that time. The carrying value of debt was being accreted to the principal amount of the debt by charges to interest expense using the effective-interest method over the four-year term of the Senior Secured Notes to the maturity date. At December 31, 2011, the debt discount balance totaled $449. Accretion amounts recognized as interest expense for the year ended December 31, 2011 totaled $170.
The credit agreement required the Company to maintain financial covenants, one of which limited the Companys maximum total leverage ratio (total indebtedness to earnings before interest, taxes, depreciation and amortization and certain other adjustments, as defined by the terms of the Senior Secured Notes agreement). The financial covenants would have become more restrictive in 2012 and 2013. In addition, the Company was required to maintain other affirmative, negative and financial covenants. The Company was not in compliance with certain of the covenants at December 31, 2011. However, the Company received a waiver of noncompliance from DE Shaw through May 31, 2012.
On May 10, 2012, the Company used the proceeds from the $25,000 Term Loan of its Senior Secured Credit Facility to pay in full all amounts due under the Senior Secured Notes, including principal then remaining of $17,063, prepayment premium of $512 and accrued interest. As a result of the early repayment of the Senior Secured Notes, in the year ended December 31, 2012, the Company recorded a loss on extinguishment of debt of $934, comprised of the write-off of unamortized debt discount of $387 and unamortized deferred financing cost of $18, the prepayment premium of $512 paid in cash, and associated legal fees of $17.
Senior Secured Credit Facility
On May 10, 2012, the Company entered into a credit facility with Wells Fargo Capital Finance, LLC consisting of a $25,000 term loan (the Term Loan) and a $25,000 revolving line of credit (the Revolving Credit Facility), which would have expired on May 10, 2017 (collectively, the Senior Secured Credit
92
Facility). The Senior Secured Credit Facility was collateralized by a senior first lien on all assets and property of the Company. The purpose of the Senior Secured Credit Facility was to repay the outstanding principal of the Senior Secured Notes, which was repaid on May 10, 2012 with proceeds of the $25,000 Term Loan, and to provide an additional source of liquidity to the Company. Borrowings under the Revolving Credit Facility were subject to drawdown limitations based on financial ratios of the Company.
The interest rate on the Term Loan and borrowings under the Revolving Credit Facility was either (a) LIBOR plus 3.5% per annum, but not less than 4.5% per annum, or (b) at the Companys option, subject to certain conditions, base rate plus 2.5% per annum, but not less than 5.5% per annum. Principal due under the Term Loan was payable in quarterly installments commencing on December 31, 2012, with $313 due in 2012, $1,250 due in 2013, $1,406 due in 2014, $2,031 due in 2015, $2,500 due in 2016 and $17,500 due in 2017. All amounts borrowed under the revolving line of credit were due and payable on May 10, 2017. Borrowings under the Senior Secured Credit Facility required a 1% prepayment penalty if the facility was terminated within the first twelve months of the agreement.
On the issuance date of May 10, 2012, the Term Loan was recorded in the consolidated balance sheet net of discount of $651, related to fees assessed by the lender at the time. The carrying value of this debt was being accreted to the principal amount of the debt by charges to interest expense using the effective-interest method over the five-year term of the Term Loan to the maturity date. At December 31, 2012, the debt discount balance totaled $556. Accretion amounts recognized as interest expense for the year ended December 31, 2012 totaled $95. On the issuance date, the Company also capitalized deferred financing costs of $484 related to third-party fees incurred in connection with the Senior Secured Credit Facility. These deferred costs were being amortized through charges to interest expense using the effective-interest method over the five-year term of the Senior Secured Credit Facility to the expiration date. At December 31, 2012, deferred financing cost recorded in other current assets and other assets (non-current) were $106 and $307, and totaled $413. Amortization amounts recognized as interest expense for the year ended December 31, 2012 totaled $71.
The Senior Secured Credit Facility contained financial covenants that, among other things, required the Company to maintain liquidity of at least $10,000, comprised of cash plus availability under borrowings, and limited the Companys maximum total leverage ratio (total indebtedness with a maturity greater than twelve months to earnings before interest, taxes, depreciation and amortization and certain other adjustments, as defined by the terms of the Senior Secured Credit Facility agreement). The leverage ratio became more restrictive in each of 2013 and 2014. The Senior Secured Credit Facility also required the Company to maintain other affirmative and negative covenants. The Company was in compliance with all such covenants as of December 31, 2012.
Amended Revolving Credit Facility
On November 29, 2013, Fleetmatics entered into an amendment to the existing Senior Secured Credit Facility with Wells Fargo Capital Finance, LLC (the Credit Facility Amendment). The Credit Facility Amendment replaced the $25,000 term loan (the Term Loan) and the $25,000 revolving line of credit with a $50,000 revolving line of credit (the Amended Revolving Credit Facility). As of December 31, 2013, the Company had outstanding borrowings of $23,750 under the Amended Revolving Credit Facility, which were used to pay down the remaining unpaid principal balance of the Term Loan. As a result of the repayment of the Term Loan in November 2013, the Company recorded as interest expense the unamortized debt discount of $426 and a $158 reduction of debt issuance costs. Amortization amounts recognized as interest expense on the remaining debt issuance costs for the year ended December 31, 2014 totaled $45.
The Amended Revolving Credit Facility contains certain customary financial covenants, including a leverage ratio and minimum liquidity requirement. The Company was in compliance with all such covenants as of December 31, 2014 and 2013. At the Companys election, the interest rate on borrowings under the Amended Revolving Credit Facility is either (a) LIBOR plus 2.0% per annum, or (b) base rate plus 1.0% per annum. Amounts borrowed under the Amended Revolving Credit Facility may be repaid and, subject to customary terms
93
and conditions, reborrowed at any time during and up to the maturity date. Any outstanding balance under the Amended Revolving Credit Facility is due and payable no later than May 10, 2017. As of December 31, 2014, the Company had outstanding borrowings of $23,750 under the Amended Revolving Credit Facility.
11. Income Taxes
The components of income before income taxes were as follows:
| Year Ended December 31, | ||||||||||||
| 2014 | 2013 | 2012 | ||||||||||
| Ireland |
$ | 26,520 | $ | 16,975 | $ | 7,561 | ||||||
| Foreign |
8,943 | 9,379 | 1,754 | |||||||||
|
|
|
|
|
|
|
|||||||
| Income before income taxes |
$ | 35,463 | $ | 26,354 | $ | 9,315 | ||||||
|
|
|
|
|
|
|
|||||||
The components of the provision (benefit) for income taxes were as follows:
| Year Ended December 31, | ||||||||||||
| 2014 | 2013 | 2012 | ||||||||||
| Current tax provision (benefit): |
||||||||||||
| Ireland taxes |
$ | 3,620 | $ | 2,647 | $ | 1,746 | ||||||
| Foreign taxes |
12,952 | (9,360 | ) | (1,829 | ) | |||||||
|
|
|
|
|
|
|
|||||||
| Total current tax provision (benefit) |
16,572 | (6,713 | ) | (83 | ) | |||||||
|
|
|
|
|
|
|
|||||||
| Deferred tax provision (benefit): |
||||||||||||
| Ireland taxes |
$ | (375 | ) | $ | (80 | ) | $ | 79 | ||||
| Foreign taxes |
(8,209 | ) | 2,690 | 3,911 | ||||||||
|
|
|
|
|
|
|
|||||||
| Total deferred tax provision (benefit) |
(8,584 | ) | 2,610 | 3,990 | ||||||||
|
|
|
|
|
|
|
|||||||
| Total provision for (benefit from) income taxes |
$ | 7,988 | $ | (4,103 | ) | $ | 3,907 | |||||
|
|
|
|
|
|
|
|||||||
A reconciliation of the Ireland statutory corporate income tax rate of 12.5% to the Companys effective income tax rate is as follows:
| Year Ended December 31, | ||||||||||||
| 2014 | 2013 | 2012 | ||||||||||
| Ireland statutory corporate income tax rate |
12.5 | % | 12.5 | % | 12.5 | % | ||||||
| Income (loss) of Irish non-trading entities |
| (0.5 | ) | (9.9 | ) | |||||||
| Foreign rate differential |
6.6 | 9.0 | 5.1 | |||||||||
| Uncertain tax positions |
4.7 | (40.4 | ) | 14.8 | ||||||||
| Change in deferred tax asset valuation allowance |
(0.5 | ) | 0.8 | 17.2 | ||||||||
| Permanent differences |
1.9 | 2.9 | 3.5 | |||||||||
| Tax credits |
(2.0 | ) | (3.1 | ) | (3.9 | ) | ||||||
| Deferred charge on intercompany transaction |
| 2.7 | 3.5 | |||||||||
| Other differences |
(0.7 | ) | 0.5 | (0.9 | ) | |||||||
|
|
|
|
|
|
|
|||||||
| Effective income tax rate |
22.5 | % | (15.6 | )% | 41.9 | % | ||||||
|
|
|
|
|
|
|
|||||||
The Companys effective income tax rate for the years ended December 31, 2014 and 2013 was 22.5% and (15.6)%, respectively, on pre-tax income of $35,463 and $26,354, respectively. The Companys effective tax rate for the year ended December 31, 2014 was higher than the statutory Irish rate of 12.5% primarily due to the recording of interest and penalties associated with our uncertain tax positions and income taxed in foreign jurisdictions with a higher statutory tax rate than the 12.5% Irish statutory rate. The increases associated with
94
these items were partially offset by research tax credits in Ireland. The Companys effective tax rate for the year ended December 31, 2013 was lower than the statutory Irish rate of 12.5% due primarily to the net reversal of $10.6 million of reserves for uncertain tax positions along with related interest and penalties due to the expiration of a statute of limitations in the United States and Ireland research and development tax credits. The Companys effective tax rate for the year ended December 31, 2012 was higher than the statutory Irish rate of 12.5% primarily due to the recording of interest and penalties associated with its uncertain tax positions and an increase in the valuation allowance for deferred tax assets related to certain Irish net operating loss carryforwards. The increase associated with these items was partially offset by the release of reserves for uncertain tax positions due to the expiration of a statute of limitations in the United Kingdom, and to research and development credits earned in Ireland.
The components of net deferred tax assets and the related valuation allowance were as follows:
| December 31, | ||||||||
| 2014 | 2013 | |||||||
| Deferred tax assets: |
||||||||
| Net operating loss carryforwards |
$ | 6,729 | $ | 8,694 | ||||
| Deferred revenue |
4,955 | 3,165 | ||||||
| Accrued expenses |
1,311 | 736 | ||||||
| Reserves and allowances |
2,575 | 2,742 | ||||||
| Share-based compensation |
4,678 | 2,487 | ||||||
| Other |
389 | 512 | ||||||
|
|
|
|
|
|||||
| Total deferred tax assets |
20,637 | 18,336 | ||||||
|
|
|
|
|
|||||
| Deferred tax liabilities: |
||||||||
| Acquired intangible assets |
(1,274 | ) | (1,761 | ) | ||||
| Depreciation and amortization |
(2,603 | ) | (8,225 | ) | ||||
|
|
|
|
|
|||||
| Total deferred tax liabilities |
(3,877 | ) | (9,986 | ) | ||||
|
|
|
|
|
|||||
| Valuation allowance |
(2,949 | ) | (3,023 | ) | ||||
|
|
|
|
|
|||||
| Net deferred tax assets |
$ | 13,811 | $ | 5,327 | ||||
|
|
|
|
|
|||||
As a result of certain realization requirements of Accounting Standards Codification 718, Compensation-Stock Compensation (ASC 718), the table of deferred tax assets and liabilities does not include certain deferred tax assets as of December 31, 2014, and December 31, 2013, that arose directly from tax deductions related to equity compensation greater than compensation recognized for financial reporting. Windfall benefits used to reduce the 2014 and 2013 current taxes payable were $12,973 and $3,813, respectively. The Company uses tax law ordering when determining when excess tax benefits have been realized.
As of December 31, 2014 and 2013, the Company had net operating loss carryforwards in the United States of approximately $21,900 and $32,431, respectively, available to reduce future federal taxable income and had approximately $6,527 and $5,938, respectively, available to reduce future state taxable income. Windfalls included in net operating loss carryforwards but not reflected in deferred tax assets for 2014 are $8,461 and for 2013 are $20,352.
The federal net operating loss carryforwards will expire from 2026 through 2033, and the state net operating loss carryforwards will expire from 2020 through 2033. Under certain circumstances, the utilization of these net operating loss carryforwards on an annual basis may be limited under U.S. tax law.
As of December 31, 2014 and 2013, the Company had net operating loss carryforwards in Ireland of approximately $10,323, available to reduce future taxable income. These net operating loss carryforwards may be carried forward indefinitely, but utilization is limited to the same entity and trades that generated the losses.
95
As of December 31, 2014 and 2013, the Company had net operating loss carryforwards in the United Kingdom of approximately $1,797 and $4,113, respectively, available to reduce future taxable income. These net operating loss carryforwards may be carried forward indefinitely. Windfalls included in the United Kingdom net operating loss carryforwards but not reflected in deferred tax assets for 2014 and 2013 are $231 and $1,434, respectively.
As of December 31, 2014 and 2013, the Companys net deferred tax asset balances of $13,811 and $5,327, respectively, are primarily related to the Companys U.S. operations. The Company has concluded, based on the weight of available evidence, that those net deferred tax assets are more likely than not to be realized in the future.
As of December 31, 2014, the Company had recorded a valuation allowance of $2,581 and $368 against certain net deferred tax assets in Ireland and Australia, respectively, because the Company believes that it is not more likely than not that the tax assets, which consist principally of net operating loss carryforwards, will be realized. The utilization of the losses in Ireland is limited to certain types of income being generated by the Company. As of December 31, 2013, the Company had recorded a valuation allowance of $2,581, $403, and $39 against its net deferred tax assets in Ireland, Australia, and Mexico, respectively, because the Company believes that it is not more likely than not that the tax assets, which consist principally of net operating loss carryforwards, will be realized. The utilization of the losses in Ireland is limited to certain types of income being generated by the Company.
In the normal course of business, the Company and its subsidiaries are subject to examination by various taxing authorities. As of December 31, 2014, the Company and its material subsidiaries remain subject to examination in the United States for tax years 2011 through 2014, in Ireland for tax years 2009 through 2014, and in the United Kingdom for tax years 2010 through 2014.
As of December 31, 2014 and 2013, the Company had recorded liabilities for unrecognized tax benefits of $429 and $195, respectively. During the years ended December 31, 2014 and 2013, the Company recorded as part of its provision for income taxes $859 and $866, respectively, of interest and penalties related to its unrecognized tax benefits. Accrued income taxes (non-current) recorded in the Companys consolidated balance sheets as of December 31, 2014 and 2013, of $3,164 and $2,094, respectively, consisted of the liabilities recorded for unrecognized tax benefits of $429 and $195, respectively, as well as accrued interest and penalties totaling $2,735 and $1,899, respectively.
A reconciliation of the beginning and ending amount of our unrecognized tax benefits, including those that were recorded against related deferred tax assets rather than as liabilities, but excluding amounts for accrued interest and penalties, is as follows:
| (in thousands) | ||||
| Unrecognized tax benefits at January 1, 2013 |
$ | 12,775 | ||
| Additions based on tax positions of current year |
223 | |||
| Reductions based on lapse of statute of limitations |
(11,718 | ) | ||
|
|
|
|||
| Unrecognized tax benefits at December 31, 2013 |
1,280 | |||
| Additions based on tax positions of current year |
1,110 | |||
| Reductions based on lapse of statute of limitations |
(66 | ) | ||
|
|
|
|||
| Unrecognized tax benefits at December 31, 2014 |
$ | 2,324 | ||
|
|
|
|||
As of December 31, 2014 and 2013, there were $2,324 and $1,280, respectively, of unrecognized tax benefits that, if recognized, would affect the Companys provision for income taxes. These amounts include unrecognized tax benefits recorded against related deferred tax assets as well as those recorded as liabilities in the consolidated balance sheets. It is reasonably possible that within the next 12 months the Companys
96
unrecognized tax benefits, exclusive of interest, may decrease by up to $1,002. This is primarily due to statute of limitations expiring for the recognition of these tax benefits of one of the Companys non-Irish subsidiaries in 2015.
As of December 31, 2014, the Companys material foreign subsidiaries in the United States and the United Kingdom had no undistributed earnings.
12. Redeemable Convertible Preferred Shares
The Company issued Series A redeemable convertible preferred shares with a 0.01375178 par value (the Series A preferred shares) in July 2008, issued Series B redeemable convertible preferred shares with a 0.01375178 par value (the Series B preferred shares) in July 2010, and issued Series C redeemable convertible preferred shares with a 0.01 par value (the Series C preferred shares) in November 2010 (collectively, the Preferred Shares). The Preferred Shares are classified outside of shareholders deficit because the shares contain redemption features that are not solely within the control of the Company. Upon the closing of the Companys IPO on October 11, 2012, all of the Companys outstanding redeemable convertible preferred shares converted into 26,653,383 ordinary shares.
Preferred Shares consisted of the following at December 31, 2011:
| Preferred Shares Authorized |
Preferred Shares Issued and Outstanding |
Redemption Value |
Carrying Value |
Ordinary Shares Issuable upon Conversion |
||||||||||||||||
| Series A preferred shares |
8,908,904 | 8,908,904 | $ | 40,001 | $ | 44,626 | 9,502,830 | |||||||||||||
| Series B preferred shares |
6,150,095 | 6,150,095 | 19,004 | 18,432 | 4,100,063 | |||||||||||||||
| Series C preferred shares |
19,575,735 | 19,575,735 | 68,515 | 67,781 | 13,050,490 | |||||||||||||||
|
|
|
|
|
|
|
|
|
|
|
|||||||||||
| 34,634,734 | 34,634,734 | $ | 127,520 | $ | 130,839 | 26,653,383 | ||||||||||||||
|
|
|
|
|
|
|
|
|
|
|
|||||||||||
The holders of the Preferred Shares had the following rights and preferences as of December 31, 2011:
Voting and Other Rights
Each holder of Preferred Shares was entitled to vote together with the holders of ordinary shares and was entitled to the number of votes equal to the number of ordinary shares into which such series of preferred shares could convert on the date of record or the effective date of the vote. In addition, the consent of at least a majority of the holders of Preferred Shares, voting together as a single class, was required to effect certain changes to the Companys debt and equity structure and to effect certain other events. The consent of at least 75% of the holders of each series of preferred shares was required to effect changes to the rights and preferences of that series, and a vote of at least a majority of holders of the Preferred Shares was required to permit the issuance of any class of shares.
The holders of Preferred Shares had, pro rata with the holders of ordinary shares, (i) the right of first refusal on the Companys issuance of additional Preferred Shares or ordinary shares, (ii) the right of refusal on a holders sale of Preferred Shares or ordinary shares (following the Companys right of first refusal), and (iii) the right to participate in any sale of ordinary shares (other than ordinary shares that were issued upon conversion of Preferred Shares) to a third-party purchaser, including the right to sell the same percentage of their Preferred Shares, on a fully converted basis, or ordinary shares as the holder who entered into the agreement with the third-party purchaser.
97
Dividends
The Preferred Shares had no specific dividend rights; however, if dividends are declared, then the holders of the Preferred Shares, participating on a fully converted basis, rank equally with the holders of the ordinary shares with respect to those dividends.
Redemption
The Preferred Shares were redeemable at the option of the holders of at least a majority of the then outstanding shares of Preferred Shares, voting together as a single class on a fully converted basis. The Preferred Shares were redeemable in three annual installments, beginning on the date following the fourth anniversary of the original issue date of the Series C preferred shares (that is, on November 23, 2014) and ending on the date two years from such first redemption date at a price equal to the original issue price of $4.49 for Series A preferred shares, $3.09 for Series B preferred shares and $3.50 per share for Series C preferred shares (each, the Original Issue Price).
The difference between the aggregate amount initially recorded for each series of the Preferred Shares and the respective aggregate redemption value of each series of the Preferred Shares was being accreted to the redemption value of each series of Preferred Shares over the period from the date of issuance to the earliest redemption date (as may be adjusted) using the effective-interest method. The issuance of the Series B preferred shares modified the original redemption date of the Series A preferred shares from July 24, 2013 to July 30, 2014. The issuance of the Series C preferred shares modified the redemption dates of both the Series A preferred shares and the Series B preferred shares from July 30, 2014 to November 23, 2014. Upon each change of the redemption date, the effective-interest calculation was adjusted such that the difference between the then carrying value of the Series A preferred shares and Series B preferred shares (as of the dates of the change) and their respective redemption values would be then accreted over the new redemption period to the earliest redemption date of November 23, 2014.
Conversion
Each preferred share was convertible at the option of the holder at any time and all preferred shares mandatorily convert upon the vote of a majority of the holders of Preferred Shares, voting together as a single class on a fully converted basis. Each share of Preferred Shares was convertible into the number of fully paid ordinary shares as determined by dividing the respective Preferred Shares Original Issue Price by the conversion price in effect at the time. The conversion prices of the Series A preferred shares at issuance was $5.904116 and as of December 31, 2010 and 2011 was $4.209375. The conversion price of the Series B preferred shares at issuance and as of December 31, 2010 and 2011 was $4.635. The conversion price of the Series C preferred shares at issuance and as of December 31, 2010 and 2011 was $5.25. The Preferred Shares conversion prices were subject to adjustment in accordance with the Companys Articles of Association for subsequent stock dividends, stock splits and other recapitalizations. In addition, the Articles of Association include a provision that provides for a reduction in the conversion price if there were subsequent issuances of ordinary shares for consideration per share less than the conversion price, which the Company refers to as the Conversion Price Protection provision.
Each preferred share automatically converts into ordinary shares at the then effective conversion price immediately upon the closing of the Companys first underwritten public offering in which the aggregate proceeds raised exceed $50,000 and pursuant to which the initial price to the public is at least $13.91 per share (as adjusted for any share capital subdivision or consolidation). Upon the closing of the Companys IPO on October 11, 2012, all of the Companys outstanding redeemable convertible preferred shares converted into 26,653,383 ordinary shares.
98
Liquidation Preference
In the event of any liquidation, dissolution or winding-up of the affairs of the Company, whether voluntary or involuntary, the holders of the then outstanding Preferred Shares were entitled, before any payment is made to the holders of the ordinary shares, to receive an amount per share equal to $4.49 for Series A preferred shares, $3.09 for Series B preferred shares and $3.50 per share for Series C preferred shares (each, the Liquidation Preference). In the event that the assets to be distributed are not sufficient to permit payment in full of such liquidation payments, the entire assets of the Company will be distributed ratably in proportion to the liquidation preference of the holders of the Preferred Shares. After the holders of the then outstanding Preferred Shares have been paid in full their liquidation payments, the remaining assets of the Company shall be distributed only to the holders of the ordinary shares on a pro rata basis. In the event of an acquisition or asset transfer, the holder of Preferred Shares were entitled to the distribution of proceeds equal to the greater of the Liquidation Preference or the consideration the holders would receive in a liquidation event had they exercised their conversion privilege immediately prior to such acquisition or asset transfer.
13. Deferred Shares
Deferred shares are non-voting, non-redeemable shares and carry no rights other than a lowest-priority right to share in the capital of the Company upon a winding-up or liquidation. The deferred shares were issued by the Company in order to ensure compliance with an Irish law requirement that no more than 90% of the issued share capital is redeemable and serve no other purpose.
In July 2008, the Company authorized 100,000,215,088 deferred shares with a par value of 0.00000001 per share. At the same time, the Company issued 705,658 deferred shares in lieu of fractional shares to the holders of ordinary shares who converted their ordinary shares into Series A preferred shares (see Note 12). Shortly after, upon the closing of the Series A preferred shares transaction, the 705,658 deferred shares were transferred back to the Company for no consideration. For both the issuance and the reacquisition, the Company ascribed no value to these deferred shares considering that they are non-voting, non-redeemable shares and carry no rights other than a lowest-priority right to share in the capital of the Company upon a winding-up or liquidation, and that they were transferred back to the Company for no consideration.
In July 2010, in connection with the issuance of Series B preferred shares (see Note 12), the Company converted 100,000,000,000 authorized and unissued deferred shares into 100,000 authorized ordinary shares and canceled the remaining 215,088 authorized and unissued deferred shares. As a result, authorized and issued deferred shares were reduced to zero and authorized and unissued ordinary shares were increased by 100,000 shares.
In November 2010, in connection with the issuance of the Series C preferred shares (see Note 12), the Company converted 2,230,330 authorized and unissued ordinary shares into 2,230,330 deferred shares with a par value of 0.01 per share. As a result, 2,230,330 deferred shares with a par value of 0.01 per share were authorized. These deferred shares were issued to the majority shareholder of the Company. The Company ascribed a value of $29 to the deferred shares issued, representing their aggregate par value, considering that they are non-voting, non-redeemable shares and carry no rights other than a 22 (or $29) lowest-priority right to share in the capital of the Company upon a winding-up or liquidation.
14. Ordinary Shares
Each holder of ordinary shares is entitled to one vote per share. The holders of ordinary shares are not entitled to receive dividends unless declared by the Board of Directors. The voting, dividend and liquidation rights of the holders of ordinary shares are subject to and qualified by the rights and preferences of the holders of the Preferred Shares. No dividends have been declared through December 31, 2014.
99
On October 11, 2012, the Company completed the initial public offering of its ordinary shares, which resulted in the issuance and sale of 6,250,000 ordinary shares by the Company and the sale of 2,734,375 ordinary shares by selling shareholders at a price of $17.00 per ordinary share. The Company received net proceeds from the initial public offering of $93,313, based upon the initial public offering price of $17.00 per ordinary share and after deducting underwriting discounts and commissions and offering costs paid by the Company. The Company received no proceeds from the sale of ordinary shares by the selling shareholders. Upon the closing of the Companys initial public offering, all of the Companys outstanding redeemable convertible preferred shares converted into 26,653,383 ordinary shares.
On July 30, 2013, we completed a follow-on public offering of our ordinary shares, which resulted in the sale of 1,000,000 ordinary shares by the Company and 9,925,000 ordinary shares by other selling shareholders at a price of $33.00 per ordinary share. The Company received net proceeds from this follow-on offering of $32,060, based upon the price of $33.00 per ordinary share after deducting underwriting discounts and commissions and offering costs paid by the Company. The Company received no proceeds from the sale of ordinary shares by the selling shareholders.
15. Share-Based Awards
2004 Share Option Plan
In 2004, the Board of Directors adopted and the Companys shareholders approved the 2004 Share Option Plan (the 2004 Plan). As amended in July 2010, the 2004 Plan permitted grants of options for the purchase of up to 3,151,369 ordinary shares to be issued to employees, directors and consultants. Under the 2004 Plan, options were to be granted with exercise prices no less than the fair market value per share of the Companys ordinary shares on the grant date and have a maximum term of seven years. In conjunction with the approval by shareholders of the 2011 Stock Option and Incentive Plan in September 2011, the Board of Directors voted that no further options shall be granted under the 2004 Plan.
2011 Stock Option and Incentive Plan
In September 2011, the Board of Directors adopted and the Companys shareholders approved the 2011 Stock Option and Incentive Plan (the 2011 Plan). The 2011 Plan permits the Company to make grants of incentive stock options, non-qualified stock options, restricted stock units and cash-based awards at an exercise price no less than the fair market value per share of the Companys ordinary shares on the grant date and with a maximum term of seven years. These awards may be granted to the Companys employees and non-employee directors. The Company initially reserved 666,667 ordinary shares for issuance under the 2011 Plan. On May 9, 2012, the Companys Board of Directors and shareholders increased the number of ordinary shares reserved for issuance under the 2011 Plan from 666,667 to 1,166,667, and on September 18, 2012, the Companys Board of Directors and shareholders increased the number of ordinary shares reserved for issuance under the 2011 Plan by 466,667 shares from 1,166,667 to 1,633,334. On July 18, 2013, the Companys Board of Directors approved and adopted an amendment and restatement to the 2011 Plan (the Amended and Restated 2011 Plan) and recommended that the Amended and Restated 2011 Plan be submitted to the Companys shareholders for approval at the Companys annual general meeting held on August 19, 2013. The Companys shareholders approved the Amended and Restated 2011 Plan on August 19, 2013. The authorized number of ordinary shares reserved for issuance under the Amended and Restated 2011 Plan increased from 1,633,334 to 1,883,334 and the number of shares reserved and available for issuance under the Amended and Restated 2011 Plan automatically increases each February 1, beginning in 2014, by an amount equal to the lesser of (i) 4.75% of the number of ordinary shares issued and outstanding on the immediately preceding January 31 or (ii) such lesser number of shares as determined by the compensation committee of the Board of Directors. This number is subject to adjustment in the event of a stock split, stock dividend or other change in our capitalization. In addition, per the terms of the 2011 Plan, ordinary shares previously reserved for issuance under the 2004 Plan that are not needed to fulfill the Companys obligations for awards as a result of cancelation, forfeiture, expiration or net issuances of awards are to be added to the number of shares available for issuance under the 2011 Plan. In February 2014, pursuant to the terms of the 2011 Plan, the number of ordinary shares reserved for issuance under the 2011 Plan
100
automatically increased by 1,761,450 shares from 1,883,334 to 3,644,784, calculated as 4.75% of the January 31, 2014 ordinary shares issued and outstanding. In February 2015, pursuant to the terms of the 2011 Plan, the number of ordinary shares reserved for issuance under the 2011 Plan automatically increased by 1,800,126 shares from 3,644,784 to 5,444,910, calculated as 4.75% of the January 31, 2015 ordinary shares issued and outstanding.
The Company grants share-based awards with employment service conditions only (service-based awards) and share-based awards with both employment service and performance conditions (performance-based awards). The Company applies the fair value recognition provisions for all share-based awards granted or modified and records compensation costs over the requisite service period of the award based on the grant-date fair value. The straight-line method is applied to all service-based awards granted, while the graded-vesting method is applied to all performance-based awards granted. The requisite service period for service-based awards is generally four years, with restrictions lapsing evenly over the period.
2012 Employee Share Purchase Plan
In September 2012, the Companys Board of Directors adopted and its shareholders approved the 2012 Employee Share Purchase Plan, which became effective upon the closing of the Companys IPO in October 2012. The 2012 Employee Share Purchase Plan authorizes the issuance of up to 400,000 ordinary shares to participating employees.
All employees who have been employed for at least 30 days and whose customary employment is for more than 20 hours per week are eligible to participate in the 2012 Employee Share Purchase Plan. Any employee who owns 5% or more of the voting power or value of ordinary shares is not eligible to purchase shares under the 2012 Employee Share Purchase Plan. The Company will make one or more offerings each year to its employees to purchase shares under the 2012 Employee Share Purchase Plan. The first offering began during 2013 and subsequent offerings will usually begin on each May 1 and November 1 and will continue for six-month periods, referred to as offering periods. Each eligible employee may elect to participate in any offering by submitting an enrollment form at least 15 days before the relevant offering date.
Each employee who is a participant in the 2012 Employee Share Purchase Plan may purchase shares by authorizing payroll deductions of up to 15% of his or her base compensation during an offering period. Unless the participating employee has previously withdrawn from the offering, his or her accumulated payroll deductions will be used to purchase ordinary shares on the last business day of the offering period at a price equal to 85% of the fair market value of the ordinary shares on the first business day or the last business day of the offering period, whichever is lower, provided that no more than 2,500 ordinary shares may be purchased by any one employee during each offering period. Under applicable tax rules, an employee may purchase no more than $25 worth of ordinary shares, valued at the start of the purchase period, under the 2012 Employee Share Purchase Plan in any calendar year.
The accumulated payroll deductions of any employee who is not a participant on the last day of an offering period will be refunded. An employees rights under the 2012 Employee Share Purchase Plan terminate upon voluntary withdrawal from the plan or when the employee ceases employment with us for any reason.
The 2012 Employee Share Purchase Plan may be terminated or amended by the Board of Directors at any time. An amendment that increases the number of ordinary shares that are authorized under the 2012 Employee Share Purchase Plan and certain other amendments require the approval of the Companys shareholders.
101
Stock Option Valuation
The fair value of each share option grant was estimated on the date of grant using the Black-Scholes option-pricing model. The risk-free interest rate was determined by reference to the U.S. Treasury yield curve in effect at the time of grant of the award for time periods approximately equal to the expected term of the award. The expected term has been determined utilizing the simplified method for awards that qualify as plain-vanilla options, which represents the average of the contractual term and the weighted average vesting period of the options. Expected volatility has been based on the historical volatility of the Companys publicly traded peer companies as the Company has historically been a private company and lacks company-specific historical and implied volatility information. Expected dividend yield was based on the Companys expectation of not paying cash dividends in the foreseeable future. The Company did not grant any stock options in the years ended December 31, 2014 and 2013. The assumptions used to determine the fair value of stock options granted in the year ended December 31, 2012 are as follows, presented on a weighted average basis:
| Year Ended December 31, 2012 |
||||
| Risk-free interest rate |
0.63 | % | ||
| Expected term (in years) |
4.1 | |||
| Expected volatility |
56 | % | ||
| Expected dividend yield |
0 | % | ||
The Company recognizes compensation expense for only the portion of awards that are expected to vest. In developing a forfeiture rate estimate, the Company has considered its historical experience to estimate pre-vesting forfeitures for service-based awards. For performance-based awards, the Company estimates the probability that the performance condition will be met. The impact of a forfeiture rate adjustment will be recognized in full in the period of adjustment, and if the actual forfeiture rate is materially different from the Companys estimate, the Company may be required to record adjustments to share-based compensation expense in future periods.
As required by the 2004 Plan and the 2011 Plan, the exercise price for awards granted is not to be less than the fair market value of ordinary shares as estimated by the Companys Board of Directors as of the date of grant. Prior to the Companys October 2012 IPO, the Company valued its ordinary shares by taking into consideration the most recently available valuation of ordinary shares performed by management and the Board of Directors as well as additional factors which may have changed since the date of the most recent contemporaneous valuation through the date of grant. In December 2010 and during the first half of 2011, the Board of Directors granted stock options for the purchase of 1,798,611 and 35,667 ordinary shares, respectively, with a weighted average exercise price of $3.08 per share based on its determination of the value of ordinary shares. In November 2010, certain holders of the ordinary shares converted 10,193,347 ordinary shares into Series C convertible preferred shares on a 1-for-1.5 basis and immediately sold those preferred shares to an outside investor at $3.50 per share (see Note 12). Based on this transaction and solely for the purposes of accounting for share-based compensation for financial statement purposes, in mid-2011, the Company reassessed the fair value of its ordinary shares and determined it to be $5.25 per share as of November 2010 (and through June 2011). As a result, the grant-date fair value of each of the awards granted in December 2010 and in the first half of 2011 was revalued to reflect an underlying ordinary share fair value of $5.25. The difference between the original estimated fair value of $3.08 and the reassessed fair value of $5.25 of the Companys ordinary shares resulted in an increase of $3,174 and $63 in the aggregate fair value of stock options granted in December 2010 and in first six months of 2011, respectively, which is being and will continue to be recorded as additional compensation expense in the consolidated statements of operations over the requisite service periods of between one and four years.
102
Stock Option Activity
Stock option activity during the years ended December 31, 2013 and 2014:
| Number of Shares Under Option |
Weighted Average Exercise Price |
Weighted Average Remaining Contractual Term |
Aggregate Intrinsic Value |
|||||||||||||
| (In Years) | ||||||||||||||||
| Outstanding at December 31, 2012 |
2,957,515 | $ | 4.66 | 4.2 | $ | 60,383 | ||||||||||
| Granted |
| $ | | |||||||||||||
| Exercised |
(1,424,273 | ) | $ | 3.87 | ||||||||||||
| Forfeited and canceled |
(55,419 | ) | $ | 7.45 | ||||||||||||
|
|
|
|||||||||||||||
| Outstanding at December 31, 2013 |
1,477,823 | $ | 5.36 | 4.3 | $ | 55,989 | ||||||||||
| Granted |
| $ | | |||||||||||||
| Exercised |
(608,620 | ) | $ | 4.67 | ||||||||||||
| Forfeited and canceled |
(18,956 | ) | $ | 9.67 | ||||||||||||
|
|
|
|||||||||||||||
| Outstanding at December 31, 2014 |
850,247 | $ | 5.76 | 3.5 | $ | 25,274 | ||||||||||
|
|
|
|||||||||||||||
| Vested and expected to vest at December 31, 2014 |
842,745 | $ | 5.73 | 3.5 | $ | 25,084 | ||||||||||
|
|
|
|||||||||||||||
| Exercisable at December 31, 2014 |
719,917 | $ | 5.03 | 3.4 | $ | 21,926 | ||||||||||
|
|
|
|||||||||||||||
The aggregate intrinsic value in the table above represents the total intrinsic value, based on the Companys ordinary shares closing price of $35.49 and $43.25 as of December 31, 2014 and 2013, respectively. The total intrinsic value of stock options exercised during the years ended December 31, 2014 and 2013 was $18,200 and $41,075, respectively.
The unrecognized compensation expense associated with stock options outstanding at December 31, 2014 and 2013 was $497 and $2,073, respectively, which is expected to be recognized over weighted average periods of 1.3 years and 1.6 years, respectively.
For the years ended December 31, 2014, 2013 and 2012, the Company recorded realized excess tax benefits from the exercises of stock options of $12,973, $3,813 and $(266), respectively, within shareholders equity.
Restricted Stock Unit Awards
During the year ended December 31, 2014, the Company granted service-based restricted stock units (RSUs) for the purchase of 532,001 ordinary shares and performance-based restricted stock units (PSUs) for the purchase of 353,500 ordinary shares with a grant-date fair value of $31.40. The RSUs have restrictions which lapse four years from the date of grant. Restrictions on the PSUs will lapse based upon the achievement of certain financial performance targets during the applicable performance period, which ended on December 31, 2014. Related to these PSUs, as of December 31, 2014, options for the purchase of 222,609 ordinary shares were expected to vest as a result of achieving the specified performance targets. The grant date fair value of the shares is recognized over the requisite period of performance once achievement of criteria is deemed probable. Periodically throughout the performance period, the Company estimates the likelihood of achieving performance goals. Actual results, and future changes in estimates, may differ substantially from the Companys current estimates. If the targets are not achieved, the shares will be forfeited by the employee.
103
Share-based Compensation
The Company recognized share-based compensation expense from all awards in the following expense categories:
| Year Ended December 31, | ||||||||||||
| 2014 | 2013 | 2012 | ||||||||||
| Cost of subscription revenue |
$ | 707 | $ | 395 | $ | 136 | ||||||
| Sales and marketing |
4,751 | 2,586 | 921 | |||||||||
| Research and development |
1,946 | 1,069 | 187 | |||||||||
| General and administrative |
5,803 | 3,420 | 1,178 | |||||||||
|
|
|
|
|
|
|
|||||||
| Total |
$ | 13,207 | $ | 7,470 | $ | 2,422 | ||||||
|
|
|
|
|
|
|
|||||||
16. Net Income per Share
Basic and diluted net income per share attributable to ordinary shareholders was calculated as follows for the years ended December 31, 2014, 2013 and 2012:
| Year Ended December 31, | ||||||||||||
| 2014 | 2013 | 2012 | ||||||||||
| Basic net income per share: |
||||||||||||
| Numerator: |
||||||||||||
| Net income |
$ | 27,475 | $ | 30,457 | $ | 5,408 | ||||||
| Accretion of redeemable convertible preferred shares to redemption value |
| | (335 | ) | ||||||||
|
|
|
|
|
|
|
|||||||
| Net income |
$ | 27,475 | $ | 30,457 | $ | 5,073 | ||||||
|
|
|
|
|
|
|
|||||||
| Denominator: |
||||||||||||
| Weighted average ordinary shares outstandingbasic |
37,473,442 | 35,722,300 | 8,822,169 | |||||||||
|
|
|
|
|
|
|
|||||||
| Net income per sharebasic |
$ | 0.73 | $ | 0.85 | $ | 0.58 | ||||||
|
|
|
|
|
|
|
|||||||
| Diluted net income per share: |
||||||||||||
| Numerator: |
||||||||||||
| Net income |
$ | 27,475 | $ | 30,457 | $ | 5,408 | ||||||
| Accretion of redeemable convertible preferred shares to redemption value |
| | (335 | ) | ||||||||
|
|
|
|
|
|
|
|||||||
| Net incomediluted |
$ | 27,475 | $ | 30,457 | $ | 5,073 | ||||||
|
|
|
|
|
|
|
|||||||
| Denominator: |
||||||||||||
| Weighted average ordinary shares outstandingbasic |
37,473,442 | 35,722,300 | 8,822,169 | |||||||||
| Dilutive effect of ordinary share equivalents |
1,078,418 | 1,417,539 | 1,262,411 | |||||||||
|
|
|
|
|
|
|
|||||||
| Weighted average ordinary shares outstandingdiluted |
38,551,860 | 37,139,839 | 10,084,580 | |||||||||
|
|
|
|
|
|
|
|||||||
| Net income per sharediluted |
$ | 0.71 | $ | 0.82 | $ | 0.50 | ||||||
|
|
|
|
|
|
|
|||||||
104
Stock options for the purchase of 203,170 weighted average shares were excluded from the computation of diluted net income per share attributable to ordinary shareholders for the year ended December 31, 2012 because those options had an antidilutive impact due to their exercise prices being greater than the average fair value of the Companys ordinary shares for that period.
17. Commitments and Contingencies
Lease Commitments
The Company leases its office space under non-cancelable operating leases, some of which contain payment escalations. The Company recognizes rent expense on a straight-line basis over the non-cancelable lease term and records the difference between cash rent payments and rent expense recognized in the consolidated statements of operations as accrued rent within accrued expenses (current) and other liabilities (non-current). The Company also leases office equipment under operating leases that expire at various dates through 2015. At December 31, 2014, the accrued rent balance for office leases was $1,125, of which $149 was included in accrued expenses (current) and $976 was included in other long-term liabilities. At December 31, 2013, the accrued rent balance for office leases was $947, of which $125 was included in accrued expenses (current) and $822 was included in other long-term liabilities.
Total rent expense under these operating leases was approximately $3,439, $3,041 and $1,652 for the years ended December 31, 2014, 2013 and 2012, respectively. The Company also leases furniture and computer equipment under capital leases that expire at various dates through 2017.
Future minimum lease payments under non-cancelable operating and capital leases at December 31, 2014 are as follows:
| Years Ending December 31, |
Operating Leases | Capital Leases | Total | |||||||||
| 2015 |
$ | 11,057 | $ | 830 | $ | 11,887 | ||||||
| 2016 |
6,607 | 663 | 7,270 | |||||||||
| 2017 |
5,951 | 274 | 6,225 | |||||||||
| 2018 |
2,330 | | 2,330 | |||||||||
| 2019 |
1,131 | | 1,131 | |||||||||
| Thereafter |
1,894 | | 1,894 | |||||||||
|
|
|
|
|
|
|
|||||||
| Total |
$ | 28,970 | 1,767 | $ | 30,737 | |||||||
|
|
|
|
|
|||||||||
| Less amount representing interest |
(90 | ) | ||||||||||
|
|
|
|||||||||||
| Present value of minimum lease payments |
$ | 1,677 | ||||||||||
|
|
|
|||||||||||
Data Center Agreements
The Company has agreements with various vendors to provide specialized space and services for the Company to host its software application. Future minimum payments under non-cancelable data center agreements at December 31, 2014 totaled $1,148 due in the year ending December 31, 2015.
Purchase Commitments
As of December 31, 2014, the Company had non-cancelable purchase commitments related to telecommunications, subscription fees for third-party data (such as Internet maps and posted speed limits) and subscription fees for software services totaling $11,290, of which $6,161, $2,778 and $2,351 will become payable in the years ending December 31, 2015, 2016 and 2017, respectively.
105
Indemnification Agreements
In the ordinary course of business, the Company may provide indemnifications of varying scope and terms to customers, vendors, lessors, business partners, and other parties with respect to certain matters including, but not limited to, losses arising out of breach of such agreements, from services to be provided by the Company, or from intellectual property infringement claims made by third parties. In addition, the Company has entered into indemnification agreements with members of its Board of Directors and certain of its officers that will require the Company, among other things, to indemnify them against certain liabilities that may arise by reason of their status or service as directors or officers. The maximum potential amount of future payments the Company could be required to make under these indemnification agreements is, in many cases, unlimited. To date, the Company has not incurred any material costs as a result of such indemnifications. The Company does not believe that the outcome of any claims under indemnification arrangements will have a material effect on its consolidated financial position, results of operations or cash flows, and it has not accrued any liabilities related to such obligations in its consolidated financial statements as of December 31, 2014 and 2013.
Litigation
From time to time, the Company may become subject to legal proceedings, claims and litigation arising in the ordinary course of business. In addition, the Company may receive notification alleging infringement of patent or other intellectual property rights. The Company is not a party to any material legal proceedings, nor is the Company aware of any pending or threatened litigation, that, in its opinion, would have a material adverse effect on its business or its consolidated financial position, results of operations or cash flows should such litigation be resolved unfavorably. The Company accrues contingent liabilities when it is probable that future expenditures will be made and such expenditures can be reasonably estimated.
On May 19, 2014, Rothschild Location Technologies, LLC (Rothschild) filed a complaint against the Company (Rothschild Location Technologies, LLC v. Fleetmatics USA, LLC, Civil Action No. 14-635) in the United States District Court for the District of Delaware alleging infringement of U.S. Patent No. 8,606,503, entitled Device, System and Method for Remotely Entering, Storing and Sharing Addresses for a Positional Information Device. The parties executed an agreement to settle the claims for an amount not material to the business of the Company and on December 1, 2014 Rothschild filed a notice of dismissal with the court dismissing the case with prejudice. All claims have now been paid pursuant to the settlement and the case is now closed.
On December 19, 2013, GPNE Corp. filed a complaint against the Company (GPNE Corp. v. Fleetmatics USA, LLC, Civil Action No. 13-2049) in the United States District Court for the District of Delaware alleging infringement of U.S. Patent No. 7,555,267 entitled Network Communication System Wherein a Node Obtains Resources For Transmitting Data By Transmitting Two Reservation Requests (the 267 Patent) and U.S. Patent No. 8,086,240 (the 240 patent) entitled Data Communication System Using A Reserve Request And Four Frequencies To Enable Transmitting Data Packets Which Can Include A Count Value And Termination Indication Information (the 240 Patent). On May 6, 2014, the parties filed a joint stipulation dismissing the 267 patent with prejudice. On May 7, 2014, GPNE Corp. filed an amended complaint alleging that we infringed the 240 patent and U.S. Patent No. 7,570,954, entitled Communication System Wherein A Clocking Signal From A Controller, A Request From A Node, Acknowledgement Of The Request, And Data Transferred From The Node Are All Provided on Different Frequencies, Enabling Simultaneous Transmission Of These Signals (the 954 Patent). In response to GPNEs amended complaint, the Company denied infringement, asserted invalidity, and counterclaimed with state-law claims for tortious interference with business relations and unfair competition. On November 12, 2014, the parties filed a joint stipulation dismissing the 240 patent with prejudice. As a result, of the three patents asserted by GPNE, only the 954 patent currently remains in the litigation. GPNE Corp. seeks damages and not an injunction. At this stage of the litigation, the Company is unable to estimate whether a loss is reasonably possible. While the Company does not believe that this litigation will have a material adverse effect on our business, financial condition, operating results, or cash flows, we cannot assure you that this will be the case.
106
On August 14, 2012, a putative class action complaint was filed in the Sixth Judicial Circuit in Pinellas County, Florida, entitled U.S. Prisoner Transport, et al. v. Fleetmatics USA, LLC, et al., Case No. 1200-9933 CI-20. The Company removed the case to the United States District Court for the Middle District of Florida on September 13, 2012, U.S. Prisoner Transport, et al. v. Fleetmatics USA, LLC, et al., Case No. 8:12-CV-2079. The Company moved to dismiss the complaint on September 20, 2012. Plaintiffs filed an amended complaint on October 4, 2012 and changed the case caption to Brevard Extraditions, Inc., d/b/a U.S. Prisoner Transport, et al. v. Fleetmatics USA, LLC, et al. The Company moved to dismiss the amended complaint on October 18, 2012. The Court denied the Companys motion to dismiss in part and granted it in part on September 27, 2013, and granted plaintiffs leave to file a second amended complaint. Plaintiffs filed a second amended complaint on October 11, 2013. The second amended complaint alleges essentially the same claims as previously alleged. On January 21, 2014, the parties executed an agreement to a settlement with class members for an aggregate of $525, which was subject to Court approval. On June 27, 2014, the court granted final approval of the settlement and dismissed the case with prejudice. All claims have now been paid pursuant to this settlement, and the case is now closed.
Management Services Agreement
The Company was party to a Management Services Agreement that required the Company to make payments of up to $15,000 through 2014 if certain performance targets were achieved (see Note 19). On August 20, 2012, the Company paid Privia an aggregate of $7,800 in full satisfaction of all present and future amounts that were payable by the Company under the agreement.
18. 401(k) Savings Plan
The Company has a defined contribution savings plan under Section 401(k) of the Internal Revenue Code. This plan covers substantially all employees who meet minimum age and service requirements and allows participants to defer a portion of their annual compensation on a pre-tax basis. Company contributions to the plan may be made at the discretion of the Board of Directors. The Company made no contributions to the plan during the years ended December 31, 2014, 2013 or 2012.
19. Related Party Transactions
Concurrent with the Series C preferred shares financing in November 2010 (see Note 12), the Company entered into a consulting and non-compete agreement (the Management Services Agreement) with Privia Enterprises Limited (Privia), a company controlled by certain of the Companys former shareholders and members of its Board of Directors, one of whom continued to serve as a member of the Companys Board of Directors as of December 31, 2011. Pursuant to this agreement, in exchange for consulting services to be performed by Privia, the Company agreed to pay Privia up to $15,000 in three separate installments if the Company sold a specified number of subscriptions, measured by unit installations, during each of the twelve months ending March 31, 2012, 2013 and 2014. These payments would be made after the conclusion of each measurement period and were scheduled to be paid as follows: $3,000 for the twelve months ending March 31, 2012, $5,000 for the twelve months ending March 31, 2013 and $7,000 for the twelve months ending March 31, 2014. The Company accrued for these payments during each of these three periods as the Company expected to sell the number of units that would require it to make this payout in full. The Company recorded expense of $5,353 and $2,217 for the years ended December 31, 2012 and 2011, respectively, for these future payments. As of December 31, 2012 and 2011, amounts accrued under this agreement totaled $0 and $2,448, respectively, and were included in accrued expenses and other current liabilities as a component of accrued professional fees. On August 20, 2012, the Company paid Privia an aggregate of $7,800 in full satisfaction of all present and future amounts that were payable by the Company under the Management Services Agreement.
107
20. Segment Reporting and Geographic Data
The Company has determined that it operates in one segment (see Note 2).
The geographic area data below summarizes subscription revenue and long-lived tangible assets for the significant countries in which the Company operates:
| Year Ended December 31, | ||||||||||||
| 2014 | 2013 | 2012 | ||||||||||
| Subscription revenue(1): |
||||||||||||
| United States |
$ | 203,959 | $ | 155,554 | $ | 111,386 | ||||||
| United Kingdom |
13,607 | 11,423 | 8,944 | |||||||||
| Ireland |
4,217 | 3,880 | 3,742 | |||||||||
| All other countries |
9,798 | 6,493 | 3,379 | |||||||||
|
|
|
|
|
|
|
|||||||
| Total subscription revenue |
$ | 231,581 | $ | 177,350 | $ | 127,451 | ||||||
|
|
|
|
|
|
|
|||||||
| Year Ended December 31, | ||||||||||||
| 2014 | 2013 | 2012 | ||||||||||
| Long-lived tangible assets(2): |
||||||||||||
| United States |
$ | 65,558 | $ | 51,085 | $ | 34,232 | ||||||
| United Kingdom |
4,933 | 4,493 | 3,407 | |||||||||
| Ireland |
8,315 | 6,082 | 3,493 | |||||||||
| All other countries |
928 | 72 | | |||||||||
|
|
|
|
|
|
|
|||||||
| Total long-lived tangible assets |
$ | 79,734 | $ | 61,732 | $ | 41,132 | ||||||
|
|
|
|
|
|
|
|||||||
| (1) | Subscription revenue represents sales to external customers based on the location of the customer. |
| (2) | Long-lived tangible assets consist of property and equipment based on the country in which the assets are located and are reported at carrying value. |
21. Valuation Accounts
Activity in allowance accounts related to accounts receivable and deferred tax assets consisted of the following:
| Balance at Beginning of Year |
Charged to Operations |
Deductions | Balance at End of Year |
|||||||||||||
| Year ended December 31, 2012: |
||||||||||||||||
| Accounts receivable allowances |
$ | 1,237 | 1,509 | (1) | (1,859 | )(2) | $ | 887 | ||||||||
| Deferred tax asset valuation allowance |
$ | 975 | 1,606 | | $ | 2,581 | ||||||||||
| Year ended December 31, 2013: |
||||||||||||||||
| Accounts receivable allowances |
$ | 887 | 1,601 | (1) | (1,093 | )(2) | $ | 1,395 | ||||||||
| Deferred tax asset valuation allowance |
$ | 2,581 | 442 | | $ | 3,023 | ||||||||||
| Year ended December 31, 2014: |
||||||||||||||||
| Accounts receivable allowances |
$ | 1,395 | 2,413 | (1) | (1,608 | )(2) | $ | 2,200 | ||||||||
| Deferred tax asset valuation allowance |
$ | 3,023 | | (74 | ) | $ | 2,949 | |||||||||
| (1) | Amounts represent charges to general and administrative expense for increases to the allowance for doubtful accounts. |
| (2) | Amounts represent cash collections from customers for accounts previously reserved and write-offs of accounts receivable recorded against the allowance for doubtful accounts. |
108
22. Subsequent Events
On January 21, 2015, Fleetmatics Group PLC and its subsidiaries Fleetmatics USA, LLC and Fleetmatics Development Limited, as borrowers (the Company) entered into a Credit Agreement with Citibank, N.A., as administrative agent, and the lenders party thereto, for a senior, first-priority secured financing comprised of revolving loans, letters of credit and swing line loans in a total maximum amount of $125,000 (the Credit Facility). The Credit Facility consists of a five-year multi-currency revolving credit facility in a dollar amount of up to $125,000 which includes a sublimit of $5,000 for letters of credit and a $10,000 swing line facility. The Credit Facility also includes an accordion feature that will allow the Company to increase the Credit Facility to a total of $200,000, subject to securing additional commitments from existing lenders or new lending institutions. The Company used the net proceeds of borrowings under the Credit Facility to repay the $23,750 outstanding under the Companys previously existing revolving credit facility with Wells Fargo Capital Finance, LLC and for working capital and other general corporate purposes. At the Companys election, loans made under the Credit Facility bear interest at either (1) a rate per annum equal to (a) the highest of the Administrative Agents prime rate, or 0.5% in excess of the Federal Funds Effective Rate or 2.0% in excess of one- month LIBOR (the Base Rate), plus an applicable margin, or (2) the one-, two-, three-, or six-month per annum LIBOR for deposits in U.S. dollars, plus an applicable margin. The applicable margin for the revolving loans depends on the Company leverage ratio and varies from 0.5% to 1.25%, in the case of Base Rate loans, and from 1.50% to 2.25%, in the case of LIBOR loans. Swing line loans bear interest at the Base Rate. Commitment fees on the average daily unused portion of the Credit Facility (excluding swing line loans) are payable at rates per annum ranging from 0.2% to 0.3%, depending the Companys leverage ratio. The Credit Facility contains certain customary financial, affirmative and negative covenants including a maximum leverage ratio and minimum interest coverage ratio and negative covenants that limit or restrict, among other things, dividends, secured indebtedness, mergers and fundamental changes, asset dispositions and sales, investments and acquisitions, liens and encumbrances, transactions with affiliates, and other matters customarily restricted in such agreements. Amounts borrowed under the Credit Facility may be repaid and, subject to customary terms and conditions, reborrowed at any time during and up to the maturity date. Any outstanding balance under the Credit Facility is due and payable no later than January 21, 2020.
On February 19, 2015, the Company acquired privately held Ornicar SAS, or Ornicar, a SaaS provider of fleet management solutions. Based in Grenoble, France Ornicar will add approximately 15,000 vehicles under subscription to Fleetmatics existing installed base, which as of December 31, 2014, was approximately 552,000 subscribed vehicles worldwide. This acquisition and Ornicars operations prior to the acquisition are not material to the Companys financial statements.
On February 20, 2015, the Company granted service-based restricted stock units (RSUs) for the purchase of 669,685 ordinary shares and performance-based restricted stock units (PSUs) for the purchase of 224,250 ordinary shares with a grant-date fair value of $38.88. The RSUs have restrictions which lapse four years from the date of grant. Restrictions on the PSUs will lapse based upon the achievement of certain financial performance targets during the applicable performance period, which ends on December 31, 2015. The grant date fair value of the shares is recognized over the requisite period of performance once achievement of criteria is deemed probable. Periodically throughout the performance period, the Company estimates the likelihood of achieving performance goals. Actual results, and future changes in estimates, may differ substantially from the Companys current estimates. If the targets are not achieved, the shares will be forfeited by the employee.
109
| Item 9. | Changes in and Disagreements with Accountants on Accounting and Financial Disclosure |
None.
| Item 9A. | Controls and Procedures |
Evaluation of Disclosure Controls and Procedures
Our management, with the participation of our chief executive officer and our chief financial officer, evaluated the effectiveness of our disclosure controls and procedures as of December 31, 2014. The term disclosure controls and procedures, as defined in Rules 13a-15(e) and 15d-15(e) under the Exchange Act, means controls and other procedures of a company that are designed to ensure that information required to be disclosed by a company in the reports that it files or submits under the Exchange Act is recorded, processed, summarized and reported, within the time periods specified in the SECs rules and forms. Disclosure controls and procedures include, without limitation, controls and procedures designed to ensure that information required to be disclosed by a company in the reports that it files or submits under the Exchange Act is accumulated and communicated to the companys management, including its chief executive officer and chief financial officer, as appropriate to allow timely decisions regarding required disclosure. Management recognizes that any controls and procedures, no matter how well designed and operated, can provide only reasonable assurance of achieving their objectives and management necessarily applies its judgment in evaluating the cost benefit relationship of possible controls and procedures. Based on the evaluation of our disclosure controls and procedures as of December 31, 2014, our chief executive officer and chief financial officer have concluded that, as of such date, our disclosure controls and procedures were effective at the reasonable assurance level.
Managements Annual Report on Internal Control Over Financial Reporting
Our management is responsible for establishing and maintaining adequate internal control over financial reporting as defined in Rule 13a-15(f) or 15d-15(f) of the Exchange Act. Internal control over financial reporting is a process designed to provide reasonable assurance regarding the reliability of financial reporting and the preparation of financial statements for external purposes in accordance with generally accepted accounting principles, and includes those policies and procedures that: (i) pertain to the maintenance of records that, in reasonable detail, accurately and fairly reflect the transactions and dispositions of our assets; (ii) provide reasonable assurance that transactions are recorded as necessary to permit preparation of financial statements in accordance with generally accepted accounting principles, and that our receipts and expenditures are being made only in accordance with authorizations of our management and directors; and (iii) provide reasonable assurance regarding prevention or timely detection of unauthorized acquisition, use or disposition of our assets that could have a material effect on our financial statements.
Because of its inherent limitations, internal control over financial reporting may not prevent or detect misstatements. Also, projections of any evaluation of effectiveness to future periods are subject to the risk that controls may become inadequate because of changes in conditions, or that the degree of compliance with the policies or procedures may deteriorate.
Our management assessed the effectiveness of our internal control over financial reporting as of December 31, 2014 using the criteria set forth by the Committee of Sponsoring Organizations of the Treadway Commission (COSO) in its Internal Control-Integrated Framework (2013). Based on this assessment and those criteria, management concluded that our internal control over financial reporting was effective as of December 31, 2014.
The effectiveness of the Companys internal control over financial reporting as of December 31, 2014 has been audited by PricewaterhouseCoopers LLP, an independent registered public accounting firm, as stated in their report which is included in Part II, Item 8 of this Annual Report on Form 10-K.
Changes in Internal Control over Financial Reporting
There were no changes in the Companys internal control over financial reporting that occurred during the quarter ended December 31, 2014 that materially affected, or are reasonably likely to materially affect, the Companys internal control over financial reporting.
| Item 9B. | Other Information |
None.
110
PART III
| Item 10. | Directors, Executive Officers and Corporate Governance |
The information required by this Item 10 is incorporated herein by reference to an amendment to our Annual Report on Form 10-K to be filed within 120 days of our fiscal year end.
| Item 11. | Executive Compensation |
The information required by this Item 11 is incorporated herein by reference to an amendment to our Annual Report on Form 10-K to be filed within 120 days of our fiscal year end.
| Item 12. | Security Ownership of Certain Beneficial Owners and Management and Related Stockholder Matters |
The information required by this Item 12 is incorporated herein by reference to an amendment to our Annual Report on Form 10-K to be filed within 120 days of our fiscal year end.
| Item 13. | Certain Relationships and Related Transactions and Director Independence |
The information required by this Item 13 is incorporated herein by reference to an amendment to our Annual Report on Form 10-K to be filed within 120 days of our fiscal year end.
| Item 14. | Principal Accountant Fees and Services |
The information required by this Item 14 is incorporated herein by reference to an amendment to our Annual Report on Form 10-K to be filed within 120 days of our fiscal year end.
111
PART IV
| Item 15. | Exhibits, Financial Statement Schedules. |
| (a) | The following documents are filed as part of this Annual Report on Form 10-K: |
| (1) | Financial Statements (included in Item 8 of this Annual Report on Form 10-K): |
| (2) | Financial Statement Schedules: |
Financial Statement Schedules have been omitted because the information required to be set forth therein is not applicable or is shown in the accompanying Consolidated Financial Statements or notes thereto.
| (3) | Exhibits |
112
The registrant hereby certifies that it meets all of the requirements for filing on Form 10-K and that it has duly caused and authorized the undersigned to sign this Annual Report on its behalf.
| FLEETMATICS GROUP PLC | ||||||
| Date: February 27, 2015 | By: | /s/ Stephen Lifshatz |
||||
| Name: | Stephen Lifshatz | |||||
| Title: | Chief Financial Officer Chief Accounting Officer (Principal Financial Officer and Principal Accounting Officer) |
|||||
POWER OF ATTORNEY AND SIGNATURES
Each person whose individual signature appears below hereby constitutes and appoints Stephen Lifshatz and Sharon Levine, and each of them, with full power of substitution and resubstitution and full power to act without the other, as his or her true and lawful attorney-in-fact and agent to act in his or her name, place and stead and to execute in the name and on behalf of each person, individually and in each capacity stated below, and to file any and all amendments to this Annual Report on Form 10-K, and to file the same, with all exhibits thereto, and other documents in connection therewith, with the Securities and Exchange Commission, granting unto said attorneys-in-fact and agents, and each of them, full power and authority to do and perform each and every act and thing, ratifying and confirming all that said attorneys-in-fact and agents or any of them or their or his substitute or substitutes may lawfully do or cause to be done by virtue thereof.
Pursuant to the requirements of the Securities and Exchange Act of 1934, as amended, this report has been signed below by the following persons on behalf of the registrant and in the capacities and on the dates indicated.
| Name |
Title |
Date |
||
| /s/ James M. Travers James M. Travers |
Chief Executive Officer and Chairman of the Board (Principal Executive Officer) | February 27, 2015 | ||
| /s/ Stephen Lifshatz Stephen Lifshatz |
Chief Financial Officer (Principal Financial and Accounting Officer) | February 27, 2015 | ||
| /s/ Andrew G. Flett Andrew G. Flett |
Director | February 27, 2015 | ||
| /s/ James F. Kelliher James F. Kelliher |
Director | February 27, 2015 | ||
| /s/ Jack Noonan Jack Noonan |
Director | February 27, 2015 | ||
| /s/ Liam Young Liam Young |
Director | February 27, 2015 | ||
| /s/ Vincent De Palma Vincent De Palma |
Director | February 27, 2015 | ||
113
| Name |
Title |
Date |
||
| /s/ Brian Halligan Brian Halligan |
Director | February 27, 2015 | ||
| /s/ Allison Mnookin Allison Mnookin |
Director | February 27, 2015 | ||
114
EXHIBIT INDEX TO ANNUAL REPORT ON FORM 10-K
FOR FISCAL YEAR ENDED DECEMBER 31, 2014
| Exhibit No. |
Exhibit |
|
| 3.1 | Amended and Restated Articles of Association of the Registrant as currently in effect (filed as Exhibit 3.2 to the Registration Statement on Form F-1/A filed September 24, 2012 (File No. 001-35678) and incorporated herein by reference). | |
| 4.1 | Registration Rights Agreement, dated as of September 21, 2012 by and among Fleetmatics Investor Holdings, L.P., Fleetmatics Group Limited and Fleetmatics Group Public Limited Company (filed as Exhibit 4.1 to the Registration Statement on Form F-1/A (File No. 001-35678) and incorporated herein by reference). | |
| 10.1** | Form of Indemnification Agreement entered into between the Registrant and its officers and directors (filed as Exhibit 10.6 to the Registration statement on Form F-1 (File No. 001-35678) filed August 20, 2012 and incorporated herein by reference). | |
| 10.2** | Form of Indemnification Agreement entered into between Fleetmatics USA Group Holdings, Inc. and its officers and directors (filed as Exhibit 10.7 to the Registration statement on Form F-1 (File No. 001-35678) filed August 20, 2012 and incorporated herein by reference). | |
| 10.3** | Employment Agreement, dated January 1, 2013 between Fleetmatics Group PLC, Fleetmatics USA, LLC, and James Travers (filed as Exhibit 10.8 to the Registration statement on Form F-1 (File No. 001-35678) filed January 22, 2013 and incorporated herein by reference). | |
| 10.4** | Employment Agreement, dated December 6, 2010 between Fleetmatics Group Limited, Fleetmatics USA, LLC and Stephen Lifshatz (filed as Exhibit 10.9 to the Registration Statement on Form F-1/A filed September 24, 2012 (File No. 001-35678) and incorporated herein by reference). | |
| 10.5** | Amended and Restated Service Agreement, dated September 20, 2012, between Fleetmatics IRL Limited and Peter Mitchell (filed as Exhibit 10.10 to the Registration Statement on Form F-1/A filed September 24, 2012 (File No. 001-35678) and incorporated herein by reference). | |
| 10.6** | Employment Agreement, dated July 30, 2010 between Fleetmatics Group Limited, Fleetmatics USA, LLC (formerly known as Fleetmatics USA, Inc.) and Dennis Abrahams (filed as Exhibit 10.11 to the Registration Statement on Form F-1/A filed September 24, 2012 (File No. 001-35678) and incorporated herein by reference). | |
| 10.7** | Employment Agreement, dated June 14, 2011 between Fleetmatics Group Limited, FleetMatics USA, LLC (formerly known as Fleetmatics USA, Inc.) and Andrew Reynolds (filed as Exhibit 10.12 to the Registration Statement on Form F-1/A filed September 24, 2012 (File No. 001-35678) and incorporated herein by reference). |
|
| 10.8** | Employment Agreement, dated June 4, 2012 between Fleetmatics Group Limited, FleetMatics USA, LLC and Jorge Diaz (filed as Exhibit 10.14 to the Registration Statement on Form F-1/A filed September 24, 2012 (File No. 001-35678) and incorporated herein by reference). | |
| 10.9** | Amended and Restated Service Agreement, dated September 20, 2012 between Fleetmatics IRL Limited and John Goggin (filed as Exhibit 10.15 to the Registration Statement on Form F-1/A filed September 24, 2012 (File No. 001-35678) and incorporated herein by reference). | |
| 10.10** | Employment Agreement, dated July 30, 2013 between Fleetmatics Group Limited, Fleetmatics USA Holdings, Inc. and Kathleen Finato (filed as Exhibit 10.20 to the Registration Statement on Form F-1 filed September 12, 2013 (File No. 001-35678) and incorporated herein by reference). | |
| 10.11** | Amended and Restated 2004 Share Option Plan of the Registrant (filed as Exhibit 10.16 to the Registration Statement on Form F-1/A filed September 24, 2012 (File No. 001-35678) and incorporated herein by reference). | |
115
| Exhibit No. |
Exhibit |
|
| 10.12** | 2011 Stock Option and Incentive Plan of the Registrant, as amended, and form of agreement thereunder (filed as Exhibit 10.17 to the Registration Statement on Form F-1/A filed September 24, 2012 (File No. 001-35678) and incorporated herein by reference). | |
| 10.13** | 2012 Employee Share Purchase Plan (filed as Exhibit 10.18 to the Registration Statement on Form F-1/A filed September 24, 2012 (File No. 001-35678) and incorporated herein by reference). | |
| 10.14** | Senior Executive Cash Incentive Bonus Plan (filed as Exhibit 10.19 to the Registration Statement on Form F-1/A filed September 24, 2012 (File No. 001-35678) and incorporated herein by reference). | |
| 10.15** | Non-Employee Director Compensation Policy Plan (filed as Exhibit 10.20 to the Registration Statement on Form F-1/A filed September 24, 2012 (File No. 001-35678) and incorporated herein by reference). | |
| 10.16** | Amended and Restated Non-Employee Director Compensation Policy (filed as Exhibit 10.16 to the Annual Report on Form 10-K filed March 17, 2014 (File No. 001-35678) and incorporated herein by reference. | |
| 10.17 | Lease Agreement between Fleetmatics USA, LLC and Newton Wellesley Executive Office Park LLC, dated as of December 30, 2010 in respect of the Registrants Wellesley, Massachusetts headquarters facilities, or the Boston headquarters (filed as Exhibit 10.2 to the Registration Statement on Form F-1 filed August 20, 2012 (File No. 001-35678) and incorporated herein by reference). | |
| 10.18 | First Amendment of Lease between Newton Wellesley Executive Office Park LLC and Fleetmatics USA, LLC dated as of July 7, 2011 in respect of the Boston headquarters (filed as Exhibit 10.3 to the Registration Statement on Form F-1 filed August 20, 2012 (File No. 001-35678) and incorporated herein by reference). | |
| 10.19 | Lease of First Floor Offices at Templeogue Village, Dublin, between Fleetmatics Group PLC and Whisperglen Limited, dated January 1, 2009 (filed as Exhibit 10.3 to the Annual Report on Form 20-F filed March 29, 2013 (File No. 001-35678) and incorporated herein by reference). | |
| 10.20 | First Amendment of Lease between Fleetmatics USA, LLC and US Carwash Inc. dated as of February 11, 2013(filed as Exhibit 99.3 to the Current Report on Form 6-K filed May 15, 2013 (File No. 001-35678) and incorporated herein by reference). | |
| 10.21 | First Amendment of Lease between the Jade Group, LLC and Fleetmatics USA, LLC dated as of March 1, 2013(filed as Exhibit 99.4 to the Current Report on Form 6-K filed May 15, 2013 (File No. 001-35678) and incorporated herein by reference). | |
| 10.22 | Lease Agreement among Fleetmatics (UK) Limited, Fleetmatics Group PLC and the Prudential Assurance Company dated as of March 13, 2013 (filed as Exhibit 99.5 to the Current Report on Form 6-K filed May 15, 2013 (File No. 001-35678) and incorporated herein by reference). | |
| 10.23 | Lease Agreement between Fleetmatics USA LLC and BP Bay Colony, LLC dated as of June 12, 2013 (filed as Exhibit 99.3 to the Current Report on Form 6-K filed August 9, 2013 (File No. 001-35678) and incorporated herein by reference). | |
| 10.24 | First Amendment of Lease between Fleetmatics USA LLC and YPI 1600 Corporate Center, LLC dated as of December 1, 2013 (filed as Exhibit 10.24 to the Annual Report on Form 10-K filed March 17, 2014 (File No. 001-35678) and incorporated herein by reference). | |
| 10.25 | First Amendment of Lease between Fleetmatics USA, LLC and BP Bay Colony LLC dated as of May 1, 2014 (filed as Exhibit 10.1 to the Current Report on Form 10-Q filed August 8, 2014 (File No. 001-35678) and incorporated herein by reference). | |
116
| Exhibit No. |
Exhibit |
|
| 10.26 | Management Services Agreement, dated November 23, 2010, by and among Privia Enterprises Limited, Fleetmatics Group Limited and the persons listed in Schedule 1 thereto as modified on August 20, 2012 (filed as Exhibit 10.4 to the Registration Statement on Form F-1/A filed September 24, 2012 (File No. 001-35678) and incorporated herein by reference). | |
| 10.27 | Credit Agreement, dated as of May 10, 2012, by and among Fleetmatics Group Limited, Fleetmatics USA Group Holdings, Inc., Fleetmatics USA Holdings, Inc., Fleetmatics (UK) Limited, Fleetmatics IRL Limited, Fleetmatics Patents Limited, SageQuest LLC, Fleetmatics USA, LLC, Wells Fargo Capital Finance, LLC and the other lenders party thereto (filed as Exhibit 10.5 to the Registration Statement on Form F-1/A filed September 24, 2012 (File No. 001-35678) and incorporated herein by reference). | |
| 10.28 | Sixth Amendment to Credit Agreement, dated as of November 29, 2013, by and among Fleetmatics Group PLC, Fleetmatics Group Limited, Fleetmatics USA Group Holdings, Inc., Fleetmatics USA Holdings, Inc., Fleetmatics (UK) Limited, Fleetmatics IRL Limited, Fleetmatics Patents Limited, SageQuest LLC, Fleetmatics USA, LLC, and Wells Fargo Capital Finance, LLC, as administrative agent (filed as Exhibit 99.1 to the Current Report on Form 6-K filed December 5, 2013 (File No. 001-35678) and incorporated herein by reference). | |
| 10.29 | Credit Agreement, dated as of January 21, 2015, by and among Fleetmatics Group PLC, Fleetmatics Development Limited and Fleetmatics USA, LLC, Citibank, N.A. and the other lenders party thereto (filed as Exhibit 99.1 to the Current Report on Form 8-K filed January 22, 2015 (File No. 001-35678) and incorporated herein by reference). | |
| 21.1* | Subsidiaries of the Registrant. | |
| 23.1* | Consent of PricewaterhouseCoopers LLP. | |
| 31.1* | Rule 13a-14(a) or Rule 15d-14(a) Certification of Principal Executive Officer. | |
| 31.2* | Rule 13a-14(a) or Rule 15d-14(a) Certification of Principal Financial Officer. | |
| 32.1* | Certifications of Principal Executive Officer and Principal Financial Officer, pursuant to 18 U.S.C. Section 1350, as adopted pursuant to Section 906 of the Sarbanes-Oxley Act of 2002. | |
| 101* | XBRL (Extensible Business Reporting Language) The following materials from Fleetmatics Group PLCs Annual Report on Form 10-K for the fiscal year-ended December 31, 2014, formatted in XBRL: (i) Consolidated Statements of Operations, (ii) Consolidated Balance Sheets, (iii) Statements of Consolidated Comprehensive Income, (iv) Consolidated Statements of Shareholders Equity (Deficit) (v) Consolidated Statements of Cash Flows, and (vi) Notes to the Consolidated Financial Statements. | |
| 101.INS* | XBRL Instance Document | |
| 101.SCH* | XBRL Taxonomy Extension Schema | |
| 101.CAL* | XBRL Taxonomy Extension Calculation Linkbase | |
| 101.DEF* | XBRL Taxonomy Extension Definition Linkbase | |
| 101.LAB* | XBRL Taxonomy Extension Label Linkbase | |
| 101.PRE* | XBRL Taxonomy Extension Presentation Linkbase | |
| * | Filed herewith. |
| ** | Indicates a management contract or any compensatory plan, contract or arrangement required to be filed as an exhibit pursuant to Item 15(b) of Form 10-K. |
| | Furnished herewith. |
117
