Citigroup Inc 10-Q 2014-09-30
Sign in or join
Add a note by highlighting text or Replying to an existing note.
Add a note by highlighting text or Replying to an existing note.
|
Delaware
(State or other jurisdiction of incorporation or organization)
|
52-1568099
(I.R.S. Employer Identification No.)
|
|
|
399 Park Avenue, New York, NY
(Address of principal executive offices)
|
10022
(Zip code)
|
|
|
(212) 559-1000
(Registrant's telephone number, including area code)
| ||
Large accelerated filer x
|
Accelerated filer o
|
Non-accelerated filer o
(Do not check if a smaller reporting company)
|
Smaller reporting company o
|
|||
OVERVIEW |
|
MANAGEMENT'S DISCUSSION AND ANALYSIS OF FINANCIAL CONDITION AND RESULTS OF OPERATIONS |
|
Executive Summary |
|
Summary of Selected Financial Data |
|
SEGMENT AND BUSINESS—INCOME (LOSS) AND REVENUES |
|
CITICORP |
|
Global Consumer Banking (GCB) |
|
North America GCB |
|
EMEA GCB |
|
Latin America GCB |
|
Asia Global GCB |
|
Institutional Clients Group |
|
Corporate/Other |
|
CITI HOLDINGS |
|
BALANCE SHEET REVIEW |
|
|
OFF-BALANCE-SHEET
ARRANGEMENTS
|
|
CAPITAL RESOURCES |
|
Current Regulatory Capital Standards |
|
Overview |
|
Basel III Transition Arrangements |
|
Basel III (Full Implementation) |
|
Supplementary Leverage Ratio |
|
|
Tangible Common Equity, Tangible Book Value
Per Share and Book Value Per Share
|
|
MANAGING GLOBAL RISK |
|
Table of Contents—Credit, Market (Including Funding and Liquidity), Country and Cross-Border Risk Sections |
|
FAIR VALUE ADJUSTMENTS FOR DERIVATIVES AND FAIR VALUE OPTION LIABILITIES |
|
CREDIT DERIVATIVES |
|
INCOME TAXES |
|
DISCLOSURE CONTROLS AND PROCEDURES |
|
DISCLOSURE PURSUANT TO SECTION 219 OF THE IRAN THREAT REDUCTION AND SYRIA HUMAN RIGHTS ACT |
|
FORWARD-LOOKING STATEMENTS |
|
FINANCIAL STATEMENTS AND NOTES TABLE OF CONTENTS |
|
CONSOLIDATED FINANCIAL STATEMENTS |
|
NOTES TO CONSOLIDATED FINANCIAL STATEMENTS |
|
LEGAL PROCEEDINGS |
|
UNREGISTERED SALES OF EQUITY, PURCHASES OF EQUITY SECURITIES, DIVIDENDS |
|

* |
On October 14, 2014, Citigroup announced that it intends to exit its consumer businesses in 11 markets as well as its consumer finance business in Korea. For additional information, see “Executive Summary” and “Global Consumer Banking” below. Effective in the first quarter of 2015, these businesses will be reported as part of Citi Holdings. Citi intends to release a revised Quarterly Financial Data Supplement reflecting this realignment prior to the release of first quarter of 2015 earnings information.
|

• |
Efficient resource allocation and disciplined expense management: Citi continued to benefit from savings resulting from its previously-announced repositioning actions, as well as ongoing efforts to simplify and streamline the organization. As part of these efforts, on October 14, 2014, Citigroup announced strategic actions to accelerate the transformation of GCB by focusing on those markets where it believes it has the greatest scale, growth potential and ability to provide meaningful returns to its shareholders. As part of these actions, Citigroup intends to exit its consumer businesses in 11 markets, plus its consumer finance business in Korea (for additional information on the markets included in these actions, see “Global Consumer Banking” below). Upon completion of these actions, which Citi expects to be substantially completed by the end of 2015, the new GCB footprint will continue to serve nearly 57 million clients in 24 markets that capture over 95% of GCB’s revenue base as of September 30, 2014. Citi will also continue to serve its institutional clients in these markets, which continue to be an important part of Citi’s global network.
|
• |
Wind down of Citi Holdings: During the current quarter, Citi completed the sales of its consumer businesses in Greece and Spain, which contributed to a 7% decline in Citi Holdings assets during the quarter. Citi Holdings’ assets declined by $19 billion, or 16%, from the prior-year period. |
• |
Utilization of deferred tax assets (DTAs): Citi further reduced its DTAs by approximately $700 million during the third quarter of 2014, and has utilized approximately |
Third Quarter |
Nine Months |
|||||||||||||||
In millions of dollars, except per-share amounts and ratios |
2014 |
2013 |
% Change |
2014 |
2013 |
% Change |
||||||||||
Net interest revenue |
$ |
12,187 |
$ |
11,511 |
6 |
% |
$ |
35,892 |
$ |
34,823 |
3 |
% |
||||
Non-interest revenue |
7,417 |
6,393 |
16 |
23,178 |
23,817 |
(3 |
) |
|||||||||
Revenues, net of interest expense |
$ |
19,604 |
$ |
17,904 |
9 |
% |
$ |
59,070 |
$ |
58,640 |
1 |
% |
||||
Operating expenses |
12,955 |
11,679 |
11 |
40,625 |
36,116 |
12 |
||||||||||
Provisions for credit losses and for benefits and claims |
1,750 |
1,959 |
(11 |
) |
5,454 |
6,442 |
(15 |
) |
||||||||
Income from continuing operations before income taxes |
$ |
4,899 |
$ |
4,266 |
15 |
% |
$ |
12,991 |
$ |
16,082 |
(19 |
)% |
||||
Income taxes |
1,985 |
1,080 |
84 |
5,873 |
4,777 |
23 |
||||||||||
Income from continuing operations |
$ |
2,914 |
$ |
3,186 |
(9 |
)% |
$ |
7,118 |
$ |
11,305 |
(37 |
)% |
||||
Income (loss) from discontinued operations, net of taxes (1)
|
(16 |
) |
92 |
NM |
(1 |
) |
89 |
NM |
||||||||
Net income before attribution of noncontrolling interests |
$ |
2,898 |
$ |
3,278 |
(12 |
)% |
$ |
7,117 |
$ |
11,394 |
(38 |
)% |
||||
Net income attributable to noncontrolling interests |
59 |
51 |
16 |
154 |
177 |
(13 |
) |
|||||||||
Citigroup’s net income |
$ |
2,839 |
$ |
3,227 |
(12 |
)% |
$ |
6,963 |
$ |
11,217 |
(38 |
)% |
||||
Less: |
||||||||||||||||
Preferred dividends-Basic |
$ |
128 |
$ |
110 |
16 |
% |
$ |
352 |
$ |
123 |
NM |
|||||
Dividends and undistributed earnings allocated to employee restricted and deferred shares that contain nonforfeitable rights to dividends, applicable to Basic EPS |
44 |
61 |
(28 |
) |
108 |
217 |
(50 |
) |
||||||||
Income allocated to unrestricted common shareholders for Basic EPS |
$ |
2,667 |
$ |
3,056 |
(13 |
)% |
$ |
6,503 |
$ |
10,877 |
(40 |
)% |
||||
Add: Interest expense, net of tax, and dividends on convertible securities and adjustment of undistributed earnings allocated to employee restricted and deferred shares with nonforfeitable rights to dividends, applicable to diluted EPS |
— |
— |
— |
$ |
— |
$ |
2 |
(100 |
) |
|||||||
Income allocated to unrestricted common shareholders for diluted EPS |
$ |
2,667 |
$ |
3,056 |
(13 |
) |
$ |
6,503 |
$ |
10,879 |
(40 |
)% |
||||
Earnings per share |
||||||||||||||||
Basic |
||||||||||||||||
Income from continuing operations |
$ |
0.89 |
$ |
0.98 |
(9 |
)% |
$ |
2.14 |
$ |
3.55 |
(40 |
)% |
||||
Net income |
0.88 |
1.01 |
(13 |
) |
2.14 |
3.58 |
(40 |
) |
||||||||
Diluted |
||||||||||||||||
Income from continuing operations |
$ |
0.88 |
$ |
0.98 |
(10 |
)% |
$ |
2.14 |
$ |
3.55 |
(40 |
)% |
||||
Net income |
0.88 |
1.00 |
(12 |
) |
2.14 |
3.57 |
(40 |
) |
||||||||
Dividends declared per common share |
0.01 |
0.01 |
— |
0.03 |
0.03 |
— |
||||||||||
Citigroup Inc. and Consolidated Subsidiaries | |||||||||||||
Third Quarter |
Nine Months |
||||||||||||
In millions of dollars, except per-share amounts, ratios and direct staff |
2014 |
2013 |
% Change |
2014 |
2013 |
% Change |
|||||||
At September 30: |
|||||||||||||
Total assets |
$ |
1,882,849 |
$ |
1,899,511 |
(1 |
)% |
|||||||
Total deposits |
942,655 |
955,460 |
(1 |
) |
|||||||||
Long-term debt |
223,842 |
221,593 |
1 |
||||||||||
Citigroup common stockholders’ equity |
203,304 |
195,603 |
4 |
||||||||||
Total Citigroup stockholders’ equity |
212,272 |
200,846 |
6 |
||||||||||
Direct staff (in thousands)
|
243 |
252 |
(4 |
) |
|||||||||
Performance Metrics |
|||||||||||||
Return on average assets |
0.59 |
% |
0.69 |
% |
0.49 |
% |
0.80 |
% |
|||||
Return on average common stockholders’ equity (2)
|
5.3 |
6.4 |
4.4 |
7.8 |
|||||||||
Return on average total stockholders’ equity (2)
|
5.3 |
6.5 |
4.4 |
7.7 |
|||||||||
Efficiency ratio |
66 |
65 |
69 |
62 |
|||||||||
Basel III Ratios—Transition Arrangements |
|||||||||||||
Common Equity Tier 1 Capital (3)
|
12.97 |
% |
N/A |
||||||||||
Tier 1 Capital (3)
|
12.97 |
N/A |
|||||||||||
Total Capital (3)
|
14.40 |
N/A |
|||||||||||
Tier 1 Leverage (4)
|
9.03 |
N/A |
|||||||||||
Basel III Ratios—Full Implementation |
|||||||||||||
Common Equity Tier 1 Capital (5)
|
10.66 |
% |
10.50 |
% |
|||||||||
Tier 1 Capital (5)
|
11.43 |
10.93 |
|||||||||||
Total Capital (5)
|
12.77 |
13.15 |
|||||||||||
Estimated Supplementary Leverage Ratio (6)
|
5.99 |
5.26 |
|||||||||||
Citigroup common stockholders’ equity to assets |
10.80 |
% |
10.30 |
% |
|||||||||
Total Citigroup stockholders’ equity to assets |
11.27 |
10.57 |
|||||||||||
Dividend payout ratio (7)
|
1.1 |
1.0 |
|||||||||||
Book value per common share |
$ |
67.11 |
$ |
64.49 |
4 |
% |
|||||||
Ratio of earnings to fixed charges and preferred stock dividends |
2.37x |
2.02x |
2.16x |
2.25x |
|||||||||
(1) |
Discontinued operations include Credicard, Citi Capital Advisors and Egg Banking credit card business. See Note 2 to the Consolidated Financial Statements for additional information on Citi’s discontinued operations. |
(2) |
The return on average common stockholders’ equity is calculated using net income less preferred stock dividends divided by average common stockholders’ equity. The return on average total Citigroup stockholders’ equity is calculated using net income divided by average Citigroup stockholders’ equity. |
(3) |
Capital ratios reflecting the capital (numerator) derived under the transition provisions of the final U.S. Basel III rules, which became effective January 1, 2014, and risk-weighted assets (denominator) based on the Advanced Approaches for determining total risk-weighted assets. |
(4) |
The leverage ratio represents Tier 1 Capital divided by quarterly adjusted average total assets. |
(5) |
Capital ratios based on the final U.S. Basel III rules, with full implementation assumed for capital components; risk-weighted assets based on the Advanced Approaches for determining total risk-weighted assets. |
(6) |
Citi’s estimated Supplementary Leverage ratio for the third quarter of 2014 is based on the revised final U.S. Basel III rules. Citi’s estimated Supplementary Leverage ratio for the third quarter of 2013 is presented on a pro forma basis to conform to the current period presentation. |
Third Quarter |
% Change |
Nine Months |
% Change |
|||||||||||||
In millions of dollars |
2014 |
2013 |
2014 |
2013 |
||||||||||||
Income (loss) from continuing operations |
||||||||||||||||
CITICORP |
||||||||||||||||
Global Consumer Banking |
||||||||||||||||
North America |
$ |
1,185 |
$ |
894 |
33 |
% |
$ |
3,282 |
$ |
3,052 |
8 |
% |
||||
EMEA |
1 |
13 |
(92 |
) |
31 |
36 |
(14 |
) |
||||||||
Latin America |
338 |
264 |
28 |
948 |
966 |
(2 |
) |
|||||||||
Asia |
413 |
364 |
13 |
1,008 |
1,168 |
(14 |
) |
|||||||||
Total |
$ |
1,937 |
$ |
1,535 |
26 |
% |
$ |
5,269 |
$ |
5,222 |
1 |
% |
||||
Institutional Clients Group |
||||||||||||||||
North America |
$ |
888 |
$ |
508 |
75 |
% |
$ |
3,245 |
$ |
2,748 |
18 |
% |
||||
EMEA |
461 |
374 |
23 |
1,797 |
2,031 |
(12 |
) |
|||||||||
Latin America |
294 |
427 |
(31 |
) |
1,065 |
1,426 |
(25 |
) |
||||||||
Asia |
690 |
431 |
60 |
1,753 |
1,741 |
1 |
||||||||||
Total |
$ |
2,333 |
$ |
1,740 |
34 |
% |
$ |
7,860 |
$ |
7,946 |
(1 |
)% |
||||
Corporate/Other |
$ |
(1,598 |
) |
$ |
20 |
NM |
$ |
(2,488 |
) |
$ |
(374 |
) |
NM |
|||
Total Citicorp |
$ |
2,672 |
$ |
3,295 |
(19 |
)% |
$ |
10,641 |
$ |
12,794 |
(17 |
)% |
||||
Citi Holdings |
$ |
242 |
$ |
(109 |
) |
NM |
$ |
(3,523 |
) |
$ |
(1,489 |
) |
NM |
|||
Income from continuing operations |
$ |
2,914 |
$ |
3,186 |
(9 |
)% |
$ |
7,118 |
$ |
11,305 |
(37 |
)% |
||||
Discontinued operations |
$ |
(16 |
) |
$ |
92 |
NM |
$ |
(1 |
) |
$ |
89 |
NM |
||||
Net income attributable to noncontrolling interests |
59 |
51 |
16 |
% |
154 |
177 |
(13 |
)% |
||||||||
Citigroup’s net income |
$ |
2,839 |
$ |
3,227 |
(12 |
)% |
$ |
6,963 |
$ |
11,217 |
(38 |
)% |
||||
Third Quarter |
% Change |
Nine Months |
% Change |
|||||||||||||
In millions of dollars |
2014 |
2013 |
2014 |
2013 |
||||||||||||
CITICORP |
||||||||||||||||
Global Consumer Banking |
||||||||||||||||
North America |
$ |
4,989 |
$ |
4,739 |
5 |
% |
$ |
14,554 |
$ |
14,902 |
(2 |
)% |
||||
EMEA |
347 |
359 |
(3 |
) |
1,053 |
1,091 |
(3 |
) |
||||||||
Latin America |
2,357 |
2,272 |
4 |
6,949 |
6,913 |
1 |
||||||||||
Asia |
1,944 |
1,862 |
4 |
5,755 |
5,790 |
(1 |
) |
|||||||||
Total |
$ |
9,637 |
$ |
9,232 |
4 |
% |
$ |
28,311 |
$ |
28,696 |
(1 |
)% |
||||
Institutional Clients Group |
||||||||||||||||
North America |
$ |
3,178 |
$ |
2,439 |
30 |
% |
$ |
9,882 |
$ |
9,261 |
7 |
% |
||||
EMEA |
2,263 |
2,147 |
5 |
7,486 |
7,988 |
(6 |
) |
|||||||||
Latin America |
1,015 |
1,095 |
(7 |
) |
3,267 |
3,541 |
(8 |
) |
||||||||
Asia |
1,915 |
1,691 |
13 |
5,433 |
5,733 |
(5 |
) |
|||||||||
Total |
$ |
8,371 |
$ |
7,372 |
14 |
% |
$ |
26,068 |
$ |
26,523 |
(2 |
)% |
||||
Corporate/Other |
$ |
8 |
$ |
42 |
(81 |
)% |
$ |
184 |
$ |
162 |
14 |
% |
||||
Total Citicorp |
$ |
18,016 |
$ |
16,646 |
8 |
% |
$ |
54,563 |
$ |
55,381 |
(1 |
)% |
||||
Citi Holdings |
$ |
1,588 |
$ |
1,258 |
26 |
% |
$ |
4,507 |
$ |
3,259 |
38 |
% |
||||
Total Citigroup net revenues |
$ |
19,604 |
$ |
17,904 |
9 |
% |
$ |
59,070 |
$ |
58,640 |
1 |
% |
||||
Third Quarter |
Nine Months |
% Change |
||||||||||||||
In millions of dollars except as otherwise noted |
2014 |
2013 |
% Change |
2014 |
2013 |
|||||||||||
Net interest revenue |
$ |
11,329 |
$ |
10,735 |
6 |
% |
$ |
33,159 |
$ |
32,510 |
2 |
% |
||||
Non-interest revenue |
6,687 |
5,911 |
13 |
21,404 |
22,871 |
(6 |
) |
|||||||||
Total revenues, net of interest expense |
$ |
18,016 |
$ |
16,646 |
8 |
% |
$ |
54,563 |
$ |
55,381 |
(1 |
)% |
||||
Provisions for credit losses and for benefits and claims |
||||||||||||||||
Net credit losses |
$ |
1,750 |
$ |
1,795 |
(3 |
)% |
$ |
5,460 |
$ |
5,581 |
(2 |
)% |
||||
Credit reserve build (release) |
(381 |
) |
(104 |
) |
NM |
(1,100 |
) |
(722 |
) |
(52 |
) |
|||||
Provision for loan losses |
$ |
1,369 |
$ |
1,691 |
(19 |
)% |
$ |
4,360 |
$ |
4,859 |
(10 |
)% |
||||
Provision for benefits and claims |
52 |
51 |
2 |
144 |
160 |
(10 |
) |
|||||||||
Provision for unfunded lending commitments |
(27 |
) |
108 |
NM |
(78 |
) |
116 |
NM |
||||||||
Total provisions for credit losses and for benefits and claims |
$ |
1,394 |
$ |
1,850 |
(25 |
)% |
$ |
4,426 |
$ |
5,135 |
(14 |
)% |
||||
Total operating expenses |
$ |
12,063 |
$ |
10,283 |
17 |
% |
$ |
33,675 |
$ |
31,639 |
6 |
% |
||||
Income from continuing operations before taxes |
$ |
4,559 |
$ |
4,513 |
1 |
% |
$ |
16,462 |
$ |
18,607 |
(12 |
)% |
||||
Income taxes |
1,887 |
1,218 |
55 |
5,821 |
5,813 |
— |
||||||||||
Income from continuing operations |
$ |
2,672 |
$ |
3,295 |
(19 |
)% |
$ |
10,641 |
$ |
12,794 |
(17 |
)% |
||||
Income (loss) from discontinued operations, net of taxes |
(16 |
) |
92 |
NM |
(1 |
) |
89 |
NM |
||||||||
Noncontrolling interests |
55 |
45 |
22 |
149 |
165 |
(10 |
) |
|||||||||
Net income |
$ |
2,601 |
$ |
3,342 |
(22 |
)% |
$ |
10,491 |
$ |
12,718 |
(18 |
)% |
||||
Balance sheet data (in billions of dollars)
|
||||||||||||||||
Total end-of-period (EOP) assets |
$ |
1,780 |
$ |
1,778 |
— |
% |
||||||||||
Average assets |
1,788 |
1,735 |
3 |
$ |
1,784 |
$ |
1,742 |
2 |
% |
|||||||
Return on average assets |
0.58 |
% |
0.76 |
% |
0.79 |
% |
0.98 |
% |
||||||||
Efficiency ratio (Operating expenses/Total revenues) |
67 |
62 |
62 |
57 |
||||||||||||
Total EOP loans |
$ |
576 |
$ |
561 |
3 |
|||||||||||
Total EOP deposits |
$ |
928 |
$ |
914 |
2 |
|||||||||||
Third Quarter |
% Change |
Nine Months |
% Change |
|||||||||||||
In millions of dollars except as otherwise noted |
2014 |
2013 |
2014 |
2013 |
||||||||||||
Net interest revenue |
$ |
7,366 |
$ |
7,100 |
4 |
% |
$ |
21,604 |
$ |
21,333 |
1 |
% |
||||
Non-interest revenue |
2,271 |
2,132 |
7 |
6,707 |
7,363 |
(9 |
) |
|||||||||
Total revenues, net of interest expense |
$ |
9,637 |
$ |
9,232 |
4 |
% |
$ |
28,311 |
$ |
28,696 |
(1 |
)% |
||||
Total operating expenses |
$ |
5,281 |
$ |
5,189 |
2 |
% |
$ |
15,932 |
$ |
15,826 |
1 |
% |
||||
Net credit losses |
$ |
1,738 |
$ |
1,730 |
— |
% |
$ |
5,305 |
$ |
5,424 |
(2 |
)% |
||||
Credit reserve build (release) |
(373 |
) |
(85 |
) |
NM |
(909 |
) |
(662 |
) |
(37 |
) |
|||||
Provision (release) for unfunded lending commitments |
(2 |
) |
15 |
NM |
(8 |
) |
39 |
NM |
||||||||
Provision for benefits and claims |
52 |
51 |
2 |
144 |
160 |
(10 |
) |
|||||||||
Provisions for credit losses and for benefits and claims |
$ |
1,415 |
$ |
1,711 |
(17 |
)% |
$ |
4,532 |
$ |
4,961 |
(9 |
)% |
||||
Income from continuing operations before taxes |
$ |
2,941 |
$ |
2,332 |
26 |
% |
$ |
7,847 |
$ |
7,909 |
(1 |
)% |
||||
Income taxes |
1,004 |
797 |
26 |
2,578 |
2,687 |
(4 |
) |
|||||||||
Income from continuing operations |
$ |
1,937 |
$ |
1,535 |
26 |
% |
$ |
5,269 |
$ |
5,222 |
1 |
% |
||||
Noncontrolling interests |
9 |
4 |
NM |
23 |
15 |
53 |
||||||||||
Net income |
$ |
1,928 |
$ |
1,531 |
26 |
% |
$ |
5,246 |
$ |
5,207 |
1 |
% |
||||
Balance Sheet data (in billions of dollars)
|
||||||||||||||||
Average assets |
$ |
401 |
$ |
391 |
3 |
% |
$ |
399 |
$ |
394 |
1 |
% |
||||
Return on average assets |
1.91 |
% |
1.55 |
% |
1.76 |
% |
1.78 |
% |
||||||||
Efficiency ratio |
55 |
56 |
56 |
55 |
||||||||||||
Total EOP assets |
$ |
400 |
$ |
401 |
— |
|||||||||||
Average deposits |
333.0 |
323.7 |
3 |
332.8 |
326.2 |
2 |
||||||||||
Net credit losses as a percentage of average loans |
2.30 |
% |
2.41 |
% |
2.38 |
% |
2.55 |
% |
||||||||
Revenue by business |
||||||||||||||||
Retail banking |
$ |
4,164 |
$ |
3,928 |
6 |
% |
$ |
12,250 |
$ |
13,002 |
(6 |
)% |
||||
Cards (1)
|
5,473 |
5,304 |
3 |
16,061 |
15,694 |
2 |
||||||||||
Total |
$ |
9,637 |
$ |
9,232 |
4 |
% |
$ |
28,311 |
$ |
28,696 |
(1 |
)% |
||||
Income from continuing operations by business |
||||||||||||||||
Retail banking |
$ |
538 |
$ |
257 |
NM |
$ |
1,336 |
$ |
1,589 |
(16 |
)% |
|||||
Cards (1)
|
1,399 |
1,278 |
9 |
3,933 |
3,633 |
8 |
||||||||||
Total |
$ |
1,937 |
$ |
1,535 |
26 |
% |
$ |
5,269 |
$ |
5,222 |
1 |
% |
||||
Foreign Currency (FX) Translation Impact |
||||||||||||||||
Total revenue-as reported |
$ |
9,637 |
$ |
9,232 |
4 |
% |
$ |
28,311 |
$ |
28,696 |
(1 |
)% |
||||
Impact of FX translation (2)
|
— |
(51 |
) |
— |
(397 |
) |
||||||||||
Total revenues-ex-FX |
$ |
9,637 |
$ |
9,181 |
5 |
% |
$ |
28,311 |
$ |
28,299 |
— |
% |
||||
Total operating expenses-as reported |
$ |
5,281 |
$ |
5,189 |
2 |
% |
$ |
15,932 |
$ |
15,826 |
1 |
% |
||||
Impact of FX translation (2)
|
— |
(29 |
) |
— |
(211 |
) |
||||||||||
Total operating expenses-ex-FX |
$ |
5,281 |
$ |
5,160 |
2 |
% |
$ |
15,932 |
$ |
15,615 |
2 |
% |
||||
Total provisions for LLR & PBC-as reported |
$ |
1,415 |
$ |
1,711 |
(17 |
)% |
$ |
4,532 |
$ |
4,961 |
(9 |
)% |
||||
Impact of FX translation (2)
|
— |
(6 |
) |
— |
(69 |
) |
||||||||||
Total provisions for LLR & PBC-ex-FX |
$ |
1,415 |
$ |
1,705 |
(17 |
)% |
$ |
4,532 |
$ |
4,892 |
(7 |
)% |
||||
Net income-as reported |
$ |
1,928 |
$ |
1,531 |
26 |
% |
$ |
5,246 |
$ |
5,207 |
1 |
% |
||||
Impact of FX translation (2)
|
— |
(28 |
) |
— |
(92 |
) |
||||||||||
Net income-ex-FX |
$ |
1,928 |
$ |
1,503 |
28 |
% |
$ |
5,246 |
$ |
5,115 |
3 |
% |
||||
(1) |
Includes both Citi-branded cards and Citi retail services. |
(2) |
Reflects the impact of foreign exchange (FX) translation into U.S. dollars at the third quarter of 2014 average exchange rates for all periods presented. |
Third Quarter |
% Change |
Nine Months |
% Change |
|||||||||||||
In millions of dollars, except as otherwise noted |
2014 |
2013 |
2014 |
2013 |
||||||||||||
Net interest revenue |
$ |
4,362 |
$ |
4,136 |
5 |
% |
$ |
12,758 |
$ |
12,352 |
3 |
% |
||||
Non-interest revenue |
627 |
603 |
4 |
1,796 |
2,550 |
(30 |
) |
|||||||||
Total revenues, net of interest expense |
$ |
4,989 |
$ |
4,739 |
5 |
% |
$ |
14,554 |
$ |
14,902 |
(2 |
)% |
||||
Total operating expenses |
$ |
2,404 |
$ |
2,423 |
(1 |
)% |
$ |
7,177 |
$ |
7,368 |
(3 |
)% |
||||
Net credit losses |
$ |
1,017 |
$ |
1,083 |
(6 |
)% |
$ |
3,190 |
$ |
3,528 |
(10 |
)% |
||||
Credit reserve build (release) |
(340 |
) |
(228 |
) |
(49 |
) |
(1,008 |
) |
(949 |
) |
(6 |
) |
||||
Provisions for benefits and claims |
12 |
17 |
(29 |
) |
30 |
44 |
(32 |
) |
||||||||
Provision for unfunded lending commitments |
— |
3 |
(100 |
) |
3 |
3 |
— |
|||||||||
Provisions for credit losses and for benefits and claims |
$ |
689 |
$ |
875 |
(21 |
)% |
$ |
2,215 |
$ |
2,626 |
(16 |
)% |
||||
Income from continuing operations before taxes |
$ |
1,896 |
$ |
1,441 |
32 |
% |
$ |
5,162 |
$ |
4,908 |
5 |
% |
||||
Income taxes |
711 |
547 |
30 |
1,880 |
1,856 |
1 |
||||||||||
Income from continuing operations |
$ |
1,185 |
$ |
894 |
33 |
% |
$ |
3,282 |
$ |
3,052 |
8 |
% |
||||
Noncontrolling interests |
(1 |
) |
— |
— |
(1 |
) |
1 |
NM |
||||||||
Net income |
$ |
1,186 |
$ |
894 |
33 |
% |
$ |
3,283 |
$ |
3,051 |
8 |
% |
||||
Balance Sheet data (in billions of dollars)
|
||||||||||||||||
Average assets |
$ |
178 |
$ |
173 |
3 |
% |
$ |
177 |
$ |
174 |
2 |
% |
||||
Return on average assets |
2.64 |
% |
2.05 |
% |
2.48 |
% |
2.34 |
% |
||||||||
Efficiency ratio |
48 |
51 |
49 |
49 |
||||||||||||
Average deposits |
$ |
170.4 |
$ |
166.5 |
2 |
$ |
170.7 |
$ |
165.1 |
3 |
||||||
Net credit losses as a percentage of average loans |
2.59 |
% |
2.88 |
% |
2.74 |
% |
3.19 |
% |
||||||||
Revenue by business |
||||||||||||||||
Retail banking |
$ |
1,228 |
$ |
1,124 |
9 |
% |
$ |
3,540 |
$ |
4,289 |
(17 |
)% |
||||
Citi-branded cards |
2,115 |
2,087 |
1 |
6,162 |
6,091 |
1 |
||||||||||
Citi retail services |
1,646 |
1,528 |
8 |
4,852 |
4,522 |
7 |
||||||||||
Total |
$ |
4,989 |
$ |
4,739 |
5 |
% |
$ |
14,554 |
$ |
14,902 |
(2 |
)% |
||||
Income from continuing operations by business |
||||||||||||||||
Retail banking |
$ |
105 |
$ |
(37 |
) |
NM |
$ |
211 |
$ |
432 |
(51 |
)% |
||||
Citi-branded cards |
639 |
548 |
17 |
1,763 |
1,420 |
24 |
||||||||||
Citi retail services |
441 |
383 |
15 |
1,308 |
1,200 |
9 |
||||||||||
Total |
$ |
1,185 |
$ |
894 |
33 |
% |
$ |
3,282 |
$ |
3,052 |
8 |
% |
||||
Third Quarter |
% Change |
Nine Months |
% Change |
|||||||||||||
In millions of dollars, except as otherwise noted |
2014 |
2013 |
2014 |
2013 |
||||||||||||
Net interest revenue |
$ |
230 |
$ |
226 |
2 |
% |
$ |
694 |
$ |
709 |
(2 |
)% |
||||
Non-interest revenue |
117 |
133 |
(12 |
) |
359 |
382 |
(6 |
) |
||||||||
Total revenues, net of interest expense |
$ |
347 |
$ |
359 |
(3 |
)% |
$ |
1,053 |
$ |
1,091 |
(3 |
)% |
||||
Total operating expenses |
$ |
326 |
$ |
315 |
3 |
% |
$ |
954 |
$ |
1,010 |
(6 |
)% |
||||
Net credit losses |
$ |
25 |
$ |
21 |
19 |
% |
$ |
56 |
$ |
49 |
14 |
% |
||||
Credit reserve build (release) |
(2 |
) |
3 |
NM |
1 |
(17 |
) |
NM |
||||||||
Provision for unfunded lending commitments |
— |
— |
— |
1 |
— |
100 |
||||||||||
Provisions for credit losses |
$ |
23 |
$ |
24 |
(4 |
)% |
$ |
58 |
$ |
32 |
81 |
% |
||||
Income (loss) from continuing operations before taxes |
$ |
(2 |
) |
$ |
20 |
NM |
$ |
41 |
$ |
49 |
(16 |
)% |
||||
Income taxes (benefits) |
(3 |
) |
7 |
NM |
10 |
13 |
(23 |
) |
||||||||
Income (loss) from continuing operations |
$ |
1 |
$ |
13 |
(92 |
)% |
$ |
31 |
$ |
36 |
(14 |
)% |
||||
Noncontrolling interests |
7 |
3 |
NM |
17 |
11 |
55 |
||||||||||
Net income (loss) |
$ |
(6 |
) |
$ |
10 |
NM |
$ |
14 |
$ |
25 |
(44 |
)% |
||||
Balance Sheet data (in billions of dollars)
|
||||||||||||||||
Average assets |
$ |
10 |
$ |
9 |
11 |
% |
$ |
10 |
$ |
10 |
— |
% |
||||
Return on average assets |
(0.24 |
)% |
0.44 |
% |
0.19 |
% |
0.33 |
% |
||||||||
Efficiency ratio |
94 |
88 |
91 |
93 |
||||||||||||
Average deposits |
$ |
13.2 |
$ |
12.0 |
10 |
$ |
13.2 |
$ |
12.7 |
4 |
||||||
Net credit losses as a percentage of average loans |
1.19 |
% |
1.08 |
% |
0.91 |
% |
0.82 |
% |
||||||||
Revenue by business |
||||||||||||||||
Retail banking |
$ |
212 |
$ |
219 |
(3 |
)% |
$ |
650 |
$ |
648 |
— |
% |
||||
Citi-branded cards |
135 |
140 |
(4 |
) |
403 |
443 |
(9 |
) |
||||||||
Total |
$ |
347 |
$ |
359 |
(3 |
)% |
$ |
1,053 |
$ |
1,091 |
(3 |
)% |
||||
Income (loss) from continuing operations by business |
||||||||||||||||
Retail banking |
$ |
(10 |
) |
$ |
(7 |
) |
(43 |
)% |
$ |
(10 |
) |
$ |
(25 |
) |
60 |
% |
Citi-branded cards |
11 |
20 |
(45 |
) |
41 |
61 |
(33 |
) |
||||||||
Total |
$ |
1 |
$ |
13 |
(92 |
)% |
$ |
31 |
$ |
36 |
(14 |
)% |
||||
Foreign Currency (FX) Translation Impact |
||||||||||||||||
Total revenues-as reported |
$ |
347 |
$ |
359 |
(3 |
)% |
$ |
1,053 |
$ |
1,091 |
(3 |
)% |
||||
Impact of FX translation (1)
|
— |
(14 |
) |
— |
(28 |
) |
||||||||||
Total revenues-ex-FX |
$ |
347 |
$ |
345 |
1 |
% |
$ |
1,053 |
$ |
1,063 |
(1 |
)% |
||||
Total operating expenses-as reported |
$ |
326 |
$ |
315 |
3 |
% |
$ |
954 |
$ |
1,010 |
(6 |
)% |
||||
Impact of FX translation (1)
|
— |
(10 |
) |
— |
(21 |
) |
||||||||||
Total operating expenses-ex-FX |
$ |
326 |
$ |
305 |
7 |
% |
$ |
954 |
$ |
989 |
(4 |
)% |
||||
Provisions for credit losses-as reported |
$ |
23 |
$ |
24 |
(4 |
)% |
$ |
58 |
$ |
32 |
81 |
% |
||||
Impact of FX translation (1)
|
— |
(2 |
) |
— |
(3 |
) |
||||||||||
Provisions for credit losses-ex-FX |
$ |
23 |
$ |
22 |
5 |
% |
$ |
58 |
$ |
29 |
100 |
% |
||||
Net income (loss)-as reported |
$ |
(6 |
) |
$ |
10 |
NM |
$ |
14 |
$ |
25 |
(44 |
)% |
||||
Impact of FX translation (1)
|
— |
1 |
— |
3 |
||||||||||||
Net income (loss)-ex-FX |
$ |
(6 |
) |
$ |
11 |
NM |
$ |
14 |
$ |
28 |
(50 |
)% |
||||
(1) |
Reflects the impact of foreign exchange (FX) translation into U.S. dollars at the second quarter of 2014 average exchange rates for all periods presented. |
NM |
Not meaningful |
Third Quarter |
% Change |
Nine Months |
% Change |
|||||||||||||
In millions of dollars, except as otherwise noted |
2014 |
2013 |
2014 |
2013 |
||||||||||||
Net interest revenue |
$ |
1,611 |
$ |
1,575 |
2 |
% |
$ |
4,687 |
$ |
4,692 |
— |
% |
||||
Non-interest revenue |
746 |
697 |
7 |
2,262 |
2,221 |
2 |
||||||||||
Total revenues, net of interest expense |
$ |
2,357 |
$ |
2,272 |
4 |
% |
$ |
6,949 |
$ |
6,913 |
1 |
% |
||||
Total operating expenses |
$ |
1,378 |
$ |
1,319 |
4 |
% |
$ |
4,052 |
$ |
4,011 |
1 |
% |
||||
Net credit losses |
$ |
503 |
$ |
434 |
16 |
% |
$ |
1,465 |
$ |
1,269 |
15 |
% |
||||
Credit reserve build (release) |
10 |
168 |
(94 |
) |
177 |
310 |
(43 |
) |
||||||||
Provision (release) for unfunded lending commitments |
(1 |
) |
— |
(100 |
) |
(1 |
) |
— |
(100 |
) |
||||||
Provision for benefits and claims |
40 |
34 |
18 |
114 |
116 |
(2 |
) |
|||||||||
Provisions for loan losses and for benefits and claims (LLR & PBC) |
$ |
552 |
$ |
636 |
(13 |
)% |
$ |
1,755 |
$ |
1,695 |
4 |
% |
||||
Income from continuing operations before taxes |
$ |
427 |
$ |
317 |
35 |
% |
$ |
1,142 |
$ |
1,207 |
(5 |
)% |
||||
Income taxes |
89 |
53 |
68 |
194 |
241 |
(20 |
) |
|||||||||
Income from continuing operations |
$ |
338 |
$ |
264 |
28 |
% |
$ |
948 |
$ |
966 |
(2 |
)% |
||||
Noncontrolling interests |
3 |
1 |
NM |
7 |
3 |
NM |
||||||||||
Net income |
$ |
335 |
$ |
263 |
27 |
% |
$ |
941 |
$ |
963 |
(2 |
)% |
||||
Balance Sheet data (in billions of dollars)
|
||||||||||||||||
Average assets |
$ |
80 |
$ |
80 |
— |
% |
$ |
80 |
$ |
82 |
(2 |
)% |
||||
Return on average assets |
1.66 |
% |
1.30 |
% |
1.57 |
% |
1.62 |
% |
||||||||
Efficiency ratio |
58 |
58 |
58 |
58 |
||||||||||||
Average deposits |
$ |
46.9 |
$ |
45.0 |
4 |
$ |
46.6 |
$ |
45.3 |
3 |
% |
|||||
Net credit losses as a percentage of average loans |
4.81 |
% |
4.22 |
% |
4.69 |
% |
4.16 |
% |
||||||||
Revenue by business |
||||||||||||||||
Retail banking |
$ |
1,534 |
$ |
1,483 |
3 |
% |
$ |
4,543 |
$ |
4,571 |
(1 |
)% |
||||
Citi-branded cards |
823 |
789 |
4 |
2,406 |
2,342 |
3 |
||||||||||
Total |
$ |
2,357 |
$ |
2,272 |
4 |
% |
$ |
6,949 |
$ |
6,913 |
1 |
% |
||||
Income from continuing operations by business |
||||||||||||||||
Retail banking |
$ |
182 |
$ |
123 |
48 |
% |
$ |
595 |
$ |
541 |
10 |
% |
||||
Citi-branded cards |
156 |
141 |
11 |
353 |
425 |
(17 |
) |
|||||||||
Total |
$ |
338 |
$ |
264 |
28 |
% |
$ |
948 |
$ |
966 |
(2 |
)% |
||||
Foreign Currency (FX) Translation Impact |
||||||||||||||||
Total revenues-as reported |
$ |
2,357 |
$ |
2,272 |
4 |
% |
$ |
6,949 |
$ |
6,913 |
1 |
% |
||||
Impact of FX translation (1)
|
— |
(48 |
) |
— |
(273 |
) |
||||||||||
Total revenues-ex-FX |
$ |
2,357 |
$ |
2,224 |
6 |
% |
$ |
6,949 |
$ |
6,640 |
5 |
% |
||||
Total operating expenses-as reported |
$ |
1,378 |
$ |
1,319 |
4 |
% |
$ |
4,052 |
$ |
4,011 |
1 |
% |
||||
Impact of FX translation (1)
|
— |
(25 |
) |
— |
(149 |
) |
||||||||||
Total operating expenses-ex-FX |
$ |
1,378 |
$ |
1,294 |
6 |
% |
$ |
4,052 |
$ |
3,862 |
5 |
% |
||||
Provisions for LLR & PBC-as reported |
$ |
552 |
$ |
636 |
(13 |
)% |
$ |
1,755 |
$ |
1,695 |
4 |
% |
||||
Impact of FX translation (1)
|
— |
(8 |
) |
— |
(58 |
) |
||||||||||
Provisions for LLR & PBC-ex-FX |
$ |
552 |
$ |
628 |
(12 |
)% |
$ |
1,755 |
$ |
1,637 |
7 |
% |
||||
Net income-as reported |
$ |
335 |
$ |
263 |
27 |
% |
$ |
941 |
$ |
963 |
(2 |
)% |
||||
Impact of FX translation (1)
|
— |
(31 |
) |
— |
(70 |
) |
||||||||||
Net income-ex-FX |
$ |
335 |
$ |
232 |
44 |
% |
$ |
941 |
$ |
893 |
5 |
% |
||||
(1) |
Reflects the impact of foreign exchange (FX) translation into U.S. dollars at the third quarter of 2014 average exchange rates for all periods presented. |
Third Quarter |
% Change |
Nine Months |
% Change |
|||||||||||||
In millions of dollars, except as otherwise noted |
2014 |
2013 |
2014 |
2013 |
||||||||||||
Net interest revenue |
$ |
1,163 |
$ |
1,163 |
— |
% |
$ |
3,465 |
$ |
3,580 |
(3 |
)% |
||||
Non-interest revenue |
781 |
699 |
12 |
2,290 |
2,210 |
4 |
||||||||||
Total revenues, net of interest expense |
$ |
1,944 |
$ |
1,862 |
4 |
% |
$ |
5,755 |
$ |
5,790 |
(1 |
)% |
||||
Total operating expenses |
$ |
1,173 |
$ |
1,132 |
4 |
% |
$ |
3,749 |
$ |
3,437 |
9 |
% |
||||
Net credit losses |
$ |
193 |
$ |
192 |
1 |
% |
$ |
594 |
$ |
578 |
3 |
% |
||||
Credit reserve build (release) |
(41 |
) |
(28 |
) |
(46 |
) |
(79 |
) |
(6 |
) |
NM |
|||||
Provision for unfunded lending commitments |
(1 |
) |
12 |
NM |
(11 |
) |
36 |
NM |
||||||||
Provisions for loan losses |
$ |
151 |
$ |
176 |
(14 |
)% |
$ |
504 |
$ |
608 |
(17 |
)% |
||||
Income from continuing operations before taxes |
$ |
620 |
$ |
554 |
12 |
% |
$ |
1,502 |
$ |
1,745 |
(14 |
)% |
||||
Income taxes |
207 |
190 |
9 |
494 |
577 |
(14 |
) |
|||||||||
Income from continuing operations |
$ |
413 |
$ |
364 |
13 |
% |
$ |
1,008 |
$ |
1,168 |
(14 |
)% |
||||
Noncontrolling interests |
— |
— |
— |
— |
— |
— |
||||||||||
Net income |
$ |
413 |
$ |
364 |
13 |
% |
$ |
1,008 |
$ |
1,168 |
(14 |
)% |
||||
Balance Sheet data (in billions of dollars)
|
||||||||||||||||
Average assets |
$ |
133 |
$ |
129 |
3 |
% |
$ |
132 |
$ |
129 |
2 |
% |
||||
Return on average assets |
1.23 |
% |
1.12 |
% |
1.02 |
% |
1.21 |
% |
||||||||
Efficiency ratio |
60 |
% |
61 |
% |
65 |
% |
59 |
% |
||||||||
Average deposits |
$ |
102.5 |
$ |
100.2 |
2 |
$ |
102.3 |
$ |
103.2 |
(1 |
) |
|||||
Net credit losses as a percentage of average loans |
0.82 |
% |
0.87 |
% |
0.86 |
% |
0.88 |
% |
||||||||
Revenue by business |
||||||||||||||||
Retail banking |
$ |
1,190 |
$ |
1,102 |
8 |
% |
$ |
3,517 |
$ |
3,494 |
1 |
% |
||||
Citi-branded cards |
754 |
760 |
(1 |
) |
2,238 |
2,296 |
(3 |
) |
||||||||
Total |
$ |
1,944 |
$ |
1,862 |
4 |
% |
$ |
5,755 |
$ |
5,790 |
(1 |
)% |
||||
Income from continuing operations by business |
||||||||||||||||
Retail banking |
$ |
261 |
$ |
178 |
47 |
% |
$ |
540 |
$ |
641 |
(16 |
)% |
||||
Citi-branded cards |
152 |
186 |
(18 |
) |
468 |
527 |
(11 |
) |
||||||||
Total |
$ |
413 |
$ |
364 |
13 |
% |
$ |
1,008 |
$ |
1,168 |
(14 |
)% |
||||
Foreign Currency (FX) Translation Impact |
||||||||||||||||
Total revenues-as reported |
$ |
1,944 |
$ |
1,862 |
4 |
% |
$ |
5,755 |
$ |
5,790 |
(1 |
)% |
||||
Impact of FX translation (1)
|
— |
11 |
— |
(96 |
) |
|||||||||||
Total revenues-ex-FX |
$ |
1,944 |
$ |
1,873 |
4 |
% |
$ |
5,755 |
$ |
5,694 |
1 |
% |
||||
Total operating expenses-as reported |
$ |
1,173 |
$ |
1,132 |
4 |
% |
$ |
3,749 |
$ |
3,437 |
9 |
% |
||||
Impact of FX translation (1)
|
— |
6 |
— |
(41 |
) |
|||||||||||
Total operating expenses-ex-FX |
$ |
1,173 |
$ |
1,138 |
3 |
% |
$ |
3,749 |
$ |
3,396 |
10 |
% |
||||
Provisions for loan losses-as reported |
$ |
151 |
$ |
176 |
(14 |
)% |
$ |
504 |
$ |
608 |
(17 |
)% |
||||
Impact of FX translation (1)
|
— |
4 |
— |
(8 |
) |
|||||||||||
Provisions for loan losses-ex-FX |
$ |
151 |
$ |
180 |
(16 |
)% |
$ |
504 |
$ |
600 |
(16 |
)% |
||||
Net income-as reported |
$ |
413 |
$ |
364 |
13 |
% |
$ |
1,008 |
$ |
1,168 |
(14 |
)% |
||||
Impact of FX translation (1)
|
— |
2 |
— |
(25 |
) |
|||||||||||
Net income-ex-FX |
$ |
413 |
$ |
366 |
13 |
% |
$ |
1,008 |
$ |
1,143 |
(12 |
)% |
||||
(1) |
Reflects the impact of foreign exchange (FX) translation into U.S. dollars at the third quarter of 2014 average exchange rates for all periods presented.
|
NM |
Not meaningful |
Third Quarter |
% Change |
Nine Months |
% Change |
|||||||||||||
In millions of dollars, except as otherwise noted |
2014 |
2013 |
2014 |
2013 |
||||||||||||
Commissions and fees |
$ |
1,112 |
$ |
1,081 |
3 |
% |
$ |
3,311 |
$ |
3,322 |
— |
% |
||||
Administration and other fiduciary fees |
641 |
625 |
3 |
1,945 |
1,989 |
(2 |
) |
|||||||||
Investment banking |
1,047 |
842 |
24 |
3,261 |
2,910 |
12 |
||||||||||
Principal transactions |
1,395 |
863 |
62 |
5,578 |
5,785 |
(4 |
) |
|||||||||
Other |
151 |
132 |
14 |
275 |
863 |
(68 |
) |
|||||||||
Total non-interest revenue |
$ |
4,346 |
$ |
3,543 |
23 |
% |
$ |
14,370 |
$ |
14,869 |
(3 |
)% |
||||
Net interest revenue (including dividends) |
4,025 |
3,829 |
5 |
11,698 |
11,654 |
— |
||||||||||
Total revenues, net of interest expense |
$ |
8,371 |
$ |
7,372 |
14 |
% |
$ |
26,068 |
$ |
26,523 |
(2 |
)% |
||||
Total operating expenses |
$ |
5,040 |
$ |
4,888 |
3 |
% |
$ |
14,925 |
$ |
14,973 |
— |
% |
||||
Net credit losses |
$ |
12 |
$ |
65 |
(82 |
)% |
$ |
155 |
$ |
157 |
(1 |
)% |
||||
Provision (release) for unfunded lending commitments |
(25 |
) |
93 |
NM |
(70 |
) |
77 |
NM |
||||||||
Credit reserve (release) |
(8 |
) |
(19 |
) |
58 |
(191 |
) |
(60 |
) |
NM |
||||||
Provisions for credit losses |
$ |
(21 |
) |
$ |
139 |
NM |
$ |
(106 |
) |
$ |
174 |
NM |
||||
Income from continuing operations before taxes |
$ |
3,352 |
$ |
2,345 |
43 |
% |
$ |
11,249 |
$ |
11,376 |
(1 |
)% |
||||
Income taxes |
1,019 |
605 |
68 |
3,389 |
3,430 |
(1 |
) |
|||||||||
Income from continuing operations |
$ |
2,333 |
$ |
1,740 |
34 |
% |
$ |
7,860 |
$ |
7,946 |
(1 |
)% |
||||
Noncontrolling interests |
42 |
19 |
NM |
87 |
92 |
(5 |
) |
|||||||||
Net income |
$ |
2,291 |
$ |
1,721 |
33 |
% |
$ |
7,773 |
$ |
7,854 |
(1 |
)% |
||||
Average assets (in billions of dollars)
|
$ |
1,048 |
$ |
1,052 |
— |
% |
$ |
1,057 |
$ |
1,071 |
(1 |
)% |
||||
Return on average assets |
0.87 |
% |
0.65 |
% |
0.98 |
% |
0.98 |
% |
||||||||
Efficiency ratio |
60 |
% |
66 |
% |
57 |
% |
56 |
% |
||||||||
Revenues by region |
||||||||||||||||
North America |
$ |
3,178 |
$ |
2,439 |
30 |
% |
$ |
9,882 |
$ |
9,261 |
7 |
% |
||||
EMEA |
2,263 |
2,147 |
5 |
7,486 |
7,988 |
(6 |
) |
|||||||||
Latin America |
1,015 |
1,095 |
(7 |
) |
3,267 |
3,541 |
(8 |
) |
||||||||
Asia |
1,915 |
1,691 |
13 |
5,433 |
5,733 |
(5 |
) |
|||||||||
Total |
$ |
8,371 |
$ |
7,372 |
14 |
% |
$ |
26,068 |
$ |
26,523 |
(2 |
)% |
||||
Income from continuing operations by region |
||||||||||||||||
North America |
$ |
888 |
$ |
508 |
75 |
% |
$ |
3,245 |
$ |
2,748 |
18 |
% |
||||
EMEA |
461 |
374 |
23 |
1,797 |
2,031 |
(12 |
) |
|||||||||
Latin America |
294 |
427 |
(31 |
) |
1,065 |
1,426 |
(25 |
) |
||||||||
Asia |
690 |
431 |
60 |
1,753 |
1,741 |
1 |
||||||||||
Total |
$ |
2,333 |
$ |
1,740 |
34 |
% |
$ |
7,860 |
$ |
7,946 |
(1 |
)% |
||||
Average loans by region (in billions of dollars)
|
||||||||||||||||
North America |
$ |
111 |
$ |
100 |
11 |
% |
$ |
109 |
$ |
95 |
15 |
% |
||||
EMEA |
58 |
54 |
7 |
58 |
54 |
7 |
||||||||||
Latin America |
40 |
38 |
5 |
40 |
38 |
5 |
||||||||||
Asia |
69 |
67 |
3 |
69 |
64 |
8 |
||||||||||
Total |
$ |
278 |
$ |
259 |
7 |
% |
$ |
276 |
$ |
251 |
10 |
% |
||||
EOP deposits by business (in billions of dollars) |
||||||||||||||||
Treasury and trade solutions |
$ |
381 |
$ |
371 |
3 |
% |
||||||||||
All other ICG businesses
|
186 |
195 |
(5 |
) |
||||||||||||
Total |
$ |
567 |
$ |
566 |
— |
% |
||||||||||
Third Quarter |
% Change |
Nine Months |
% Change |
|||||||||||||
In millions of dollars |
2014 |
2013 |
2014 |
2013 |
||||||||||||
Investment banking revenue details
|
||||||||||||||||
Advisory |
$ |
318 |
$ |
167 |
90 |
% |
$ |
686 |
$ |
586 |
17 |
% |
||||
Equity underwriting |
298 |
197 |
51 |
994 |
749 |
33 |
||||||||||
Debt underwriting |
632 |
578 |
9 |
1,958 |
1,930 |
1 |
||||||||||
Total investment banking |
$ |
1,248 |
$ |
942 |
32 |
% |
$ |
3,638 |
$ |
3,265 |
11 |
% |
||||
Treasury and trade solutions |
1,965 |
1,950 |
1 |
5,922 |
5,881 |
1 |
||||||||||
Corporate lending - excluding gain/(loss) on loan hedges |
442 |
379 |
17 |
1,311 |
1,118 |
17 |
||||||||||
Private bank |
663 |
614 |
8 |
1,987 |
1,888 |
5 |
||||||||||
Total Banking revenues (ex-CVA/DVA and gain/(loss) on loan hedges) |
$ |
4,318 |
$ |
3,885 |
11 |
% |
$ |
12,858 |
$ |
12,152 |
6 |
% |
||||
Corporate lending - gain/(loss) on loan hedges (1)
|
$ |
91 |
$ |
(147 |
) |
NM |
$ |
30 |
$ |
(148 |
) |
NM |
||||
Total Banking revenues (ex-CVA/DVA and including gain/(loss) on loan hedges) |
$ |
4,409 |
$ |
3,738 |
18 |
% |
$ |
12,888 |
$ |
12,004 |
7 |
% |
||||
Fixed income markets |
$ |
2,981 |
$ |
2,838 |
5 |
% |
$ |
9,827 |
$ |
10,947 |
(10 |
)% |
||||
Equity markets |
763 |
670 |
14 |
2,305 |
2,334 |
(1 |
) |
|||||||||
Securities services |
600 |
553 |
8 |
1,759 |
1,718 |
2 |
||||||||||
Other |
(66 |
) |
(95 |
) |
31 |
(356 |
) |
(300 |
) |
(19 |
) |
|||||
Total Markets and securities services (ex-CVA/DVA) |
$ |
4,278 |
$ |
3,966 |
8 |
% |
$ |
13,535 |
$ |
14,699 |
(8 |
)% |
||||
Total ICG (ex-CVA/DVA) |
$ |
8,687 |
$ |
7,704 |
13 |
% |
$ |
26,423 |
$ |
26,703 |
(1 |
)% |
||||
CVA/DVA (excluded as applicable in lines above) (2)
|
(316 |
) |
(332 |
) |
5 |
% |
(355 |
) |
(180 |
) |
(97 |
)% |
||||
Fixed income markets |
(306 |
) |
(287 |
) |
(7 |
)% |
(368 |
) |
(146 |
) |
NM |
|||||
Equity markets |
(4 |
) |
(39 |
) |
90 |
16 |
(27 |
) |
NM |
|||||||
Private bank |
(6 |
) |
(6 |
) |
— |
(3 |
) |
(7 |
) |
57 |
||||||
Total Revenues, net of interest expense |
$ |
8,371 |
$ |
7,372 |
14 |
% |
$ |
26,068 |
$ |
26,523 |
(2 |
)% |
||||
(1) |
Hedges on accrual loans reflect the mark-to-market on credit derivatives used to economically hedge the corporate loan accrual portfolio. The fixed premium costs of these hedges is netted against the corporate lending revenues to reflect the cost of credit protection. |
(2) |
For the third quarter of 2014, includes the impact of a one-time pretax charge of $430 million related to the implementation of funding valuation adjustments (FVA) on derivatives. For additional information, see “Fair Value Adjustments for Derivatives and Fair Value Option Liabilities” below and Note 22 to the Consolidated Financial Statements. FVA is included within CVA for presentation purposes. |
• |
Revenues increased 13%, reflecting higher revenues in each of Banking (increase of 18%, 11% excluding the gains/(losses) on hedges on accrual loans) and Markets and securities services (increase of 8%). Citi expects revenues in ICG, particularly its Markets and securities services businesses, will likely continue to reflect the overall market environment as well as normal seasonal trends.
|
• |
Investment banking revenues increased 32%, reflecting an increase in advisory and equity and debt underwriting revenues. Advisory revenues increased 90%, reflecting an increase in wallet share and higher market volumes. Equity underwriting revenues increased 51% on higher market volumes and share gains. Debt underwriting revenues increased 9%.
|
• |
Treasury and trade solutions revenues increased 1%, as continued higher deposit balances and fee growth were partially offset by the impact of spread compression globally. End-of-period deposit balances increased 3%, while average trade loans decreased 8%, primarily reflecting increased distribution of assets in line with balance sheet optimization efforts (see “Balance Sheet” below).
|
• |
Corporate lending revenues increased $301 million to $533 million. Excluding the impact of gains/(losses) on hedges on accrual loans, revenues increased 17%, primarily due to continued growth in average loan balances and lower funding costs, partially offset by lower loan yields.
|
• |
Private bank revenues increased 8% due to growth in client business volumes and improved spreads in banking as well as an increase in assets under management in managed investments, partially offset by continued spread compression in lending.
|
• |
Fixed income markets revenues increased 5% driven by an increase in securitized products revenues as well as an increase in foreign exchange volatility and volumes that positively impacted the rates and currencies businesses in the latter part of the quarter. Securitized products revenues increased, particularly in North America, due to investor appetite for spread products. Commodities revenues also increased, particularly in North America, driven by strong investor and corporate client flows.
|
• |
Equity markets revenues increased 14% primarily reflecting improved performance in the derivatives and prime finance businesses, partially offset by lower cash
|
• |
Securities services revenues increased 8% due to increased volumes, assets under custody and overall client activity.
|
• |
Revenues decreased 1%, primarily reflecting lower revenues in fixed income markets, partially offset by higher revenues in investment banking, corporate lending and the private bank.
|
• |
Investment banking revenues increased 11%, primarily reflecting higher levels of market activity and a slight increase in overall investment banking wallet share. Advisory revenues increased 17% as a result of higher wallet share driven by the completion of previously-announced transactions. Equity underwriting revenues increased 33%, driven by increased market activity, partially offset by lower wallet share. Debt underwriting revenues increased 1% as a slight wallet share improvement was partially offset by lower market activity.
|
• |
Treasury and trade solutions revenues increased 1%, as higher deposit balances were partially offset by the impact of spread compression globally. End-of-period deposit balances increased 3% and average trade loans increased
|
• |
Corporate lending revenues increased 38%. Excluding the impact of gains/(losses) on hedges on accrual loans, revenues increased 17%, as higher loan balances and lower funding costs were partially offset by lower loan yields.
|
• |
Private bank revenues increased 5% due to improved managed investments performance and growth in management fees, higher banking volumes and spreads as well as lending volume growth, partially offset by the continued spread compression in lending.
|
• |
Fixed income markets revenues decreased 10%, as declines in rates and currencies, primarily reflecting the uncertain emerging market and macroeconomic environment as well as historically low levels of volatility and client activity across the business during the current year-to-date period, were partially offset by improved performance in securitized products and commodities. Local markets performance decreased as a result of the uncertain market environment and purposefully lower risk levels.
|
• |
Equity markets revenues decreased 1%, primarily due to lower client activity and weak trading performance in EMEA, particularly in the second quarter of 2014. Cash trading performance decreased driven by a decline in commissions in all regions, except EMEA, and weaker trading performance in EMEA. Derivatives declined due to lower market volatility levels and strong prior-year performance in flow derivatives. These declines were partially offset by higher volumes in the prime finance business.
|
• |
Securities services revenues increased 2%, reflecting lower net interest revenue due to a reduction in deposits and ongoing spread compression, partially offset by an increase in volumes, assets under custody and overall client activity.
|
Third Quarter |
%
Change
|
Nine Months |
% Change |
|||||||||||||
In millions of dollars |
2014 |
2013 |
2014 |
2013 |
||||||||||||
Net interest revenue |
$ |
(62 |
) |
$ |
(194 |
) |
68 |
% |
$ |
(143 |
) |
$ |
(477 |
) |
70 |
% |
Non-interest revenue |
70 |
236 |
(70 |
) |
327 |
639 |
(49 |
) |
||||||||
Total revenues, net of interest expense |
$ |
8 |
$ |
42 |
(81 |
)% |
$ |
184 |
$ |
162 |
14 |
% |
||||
Total operating expenses |
$ |
1,742 |
$ |
206 |
NM |
$ |
2,818 |
$ |
840 |
NM |
||||||
Provisions for loan losses and for benefits and claims |
— |
— |
— |
% |
— |
— |
— |
% |
||||||||
Loss from continuing operations before taxes |
$ |
(1,734 |
) |
$ |
(164 |
) |
NM |
$ |
(2,634 |
) |
$ |
(678 |
) |
NM |
||
Benefits for income taxes |
(136 |
) |
(184 |
) |
26 |
% |
(146 |
) |
(304 |
) |
52 |
% |
||||
Loss from continuing operations |
$ |
(1,598 |
) |
$ |
20 |
NM |
$ |
(2,488 |
) |
$ |
(374 |
) |
NM |
|||
Income (loss) from discontinued operations, net of taxes |
(16 |
) |
92 |
NM |
(1 |
) |
89 |
NM |
||||||||
Net loss before attribution of noncontrolling interests |
$ |
(1,614 |
) |
$ |
112 |
NM |
$ |
(2,489 |
) |
$ |
(285 |
) |
NM |
|||
Noncontrolling interests |
4 |
22 |
(82 |
)% |
39 |
58 |
(33 |
)% |
||||||||
Net loss |
$ |
(1,618 |
) |
$ |
90 |
NM |
$ |
(2,528 |
) |
$ |
(343 |
) |
NM |
|||
Third Quarter |
% Change |
Nine Months |
% Change |
|||||||||||||
In millions of dollars, except as otherwise noted |
2014 |
2013 |
2014 |
2013 |
||||||||||||
Net interest revenue |
$ |
858 |
$ |
776 |
11 |
% |
$ |
2,733 |
$ |
2,313 |
18 |
% |
||||
Non-interest revenue |
730 |
482 |
51 |
1,774 |
946 |
88 |
||||||||||
Total revenues, net of interest expense |
$ |
1,588 |
$ |
1,258 |
26 |
% |
$ |
4,507 |
$ |
3,259 |
38 |
% |
||||
Provisions for credit losses and for benefits and claims |
||||||||||||||||
Net credit losses |
$ |
347 |
$ |
635 |
(45 |
)% |
$ |
1,265 |
$ |
2,335 |
(46 |
)% |
||||
Credit reserve build (release) |
(141 |
) |
(674 |
) |
79 |
(678 |
) |
(1,501 |
) |
55 |
||||||
Provision for loan losses |
$ |
206 |
$ |
(39 |
) |
NM |
$ |
587 |
$ |
834 |
(30 |
)% |
||||
Provision for benefits and claims |
153 |
153 |
— |
451 |
475 |
(5 |
) |
|||||||||
Provision (release) for unfunded lending commitments |
(3 |
) |
(5 |
) |
40 |
(10 |
) |
(2 |
) |
NM |
||||||
Total provisions for credit losses and for benefits and claims |
$ |
356 |
$ |
109 |
NM |
$ |
1,028 |
$ |
1,307 |
(21 |
)% |
|||||
Total operating expenses |
$ |
892 |
$ |
1,396 |
(36 |
)% |
$ |
6,950 |
$ |
4,477 |
55 |
% |
||||
Loss from continuing operations before taxes |
$ |
340 |
$ |
(247 |
) |
NM |
$ |
(3,471 |
) |
$ |
(2,525 |
) |
(37 |
)% |
||
Income taxes (benefits) |
98 |
(138 |
) |
NM |
52 |
(1,036 |
) |
NM |
||||||||
Loss from continuing operations |
$ |
242 |
$ |
(109 |
) |
NM |
$ |
(3,523 |
) |
$ |
(1,489 |
) |
NM |
|||
Noncontrolling interests |
4 |
6 |
(33 |
)% |
5 |
12 |
(58 |
)% |
||||||||
Citi Holdings net income (loss) |
$ |
238 |
$ |
(115 |
) |
NM |
$ |
(3,528 |
) |
$ |
(1,501 |
) |
NM |
|||
Total revenues, net of interest expense (excluding CVA/DVA) |
||||||||||||||||
Total revenues-as reported |
$ |
1,588 |
$ |
1,258 |
26 |
% |
$ |
4,507 |
$ |
3,259 |
38 |
% |
||||
CVA/DVA(1)
|
(55 |
) |
(4 |
) |
NM |
(42 |
) |
2 |
NM |
|||||||
Total revenues-excluding CVA/DVA |
$ |
1,643 |
$ |
1,262 |
30 |
% |
$ |
4,549 |
$ |
3,257 |
40 |
% |
||||
Balance sheet data (in billions of dollars)
|
||||||||||||||||
Average assets |
$ |
107 |
$ |
125 |
(14 |
)% |
$ |
111 |
$ |
140 |
(21 |
)% |
||||
Return on average assets |
0.88 |
% |
(0.37 |
)% |
(4.25 |
)% |
(1.43 |
)% |
||||||||
Efficiency ratio |
56 |
% |
111 |
% |
154 |
% |
137 |
% |
||||||||
Total EOP assets |
$ |
103 |
$ |
122 |
(16 |
)% |
||||||||||
Total EOP loans |
77.7 |
96.2 |
(19 |
) |
||||||||||||
Total EOP deposits |
14.4 |
41.8 |
(67 |
) |
||||||||||||
(1) |
For the third quarter of 2014, includes the impact of a one-time pretax charge of $44 million related to the implementation of funding valuation adjustments (FVA) on derivatives. For additional information, see “Fair Value Adjustments for Derivatives and Fair Value Option Liabilities” below and Note 22 to the Consolidated Financial Statements. FVA is included within CVA for presentation purposes. |
In billions of dollars |
Sept. 30, 2014 |
June 30, 2014 |
Dec. 31, 2013 |
Sept. 30, 2013 |
EOP
3Q14 vs. 2Q14
Increase
(decrease)
|
%
Change
|
EOP
3Q14 vs. 4Q13
Increase
(decrease)
|
%
Change
|
EOP 3Q14 vs. 3Q13 Increase (decrease) |
% Change |
|||||||||||||||||
Assets |
|||||||||||||||||||||||||||
Cash and deposits with banks |
$ |
179 |
$ |
189 |
$ |
199 |
$ |
205 |
$ |
(10 |
) |
(5 |
)% |
$ |
(20 |
) |
(10 |
)% |
$ |
(26 |
) |
(13 |
)% |
||||
Federal funds sold and securities borrowed or purchased under agreements to resell |
245 |
250 |
257 |
274 |
(5 |
) |
(2 |
) |
(12 |
) |
(5 |
) |
(29 |
) |
(11 |
) |
|||||||||||
Trading account assets |
291 |
291 |
286 |
292 |
— |
— |
5 |
2 |
(1 |
) |
— |
||||||||||||||||
Investments |
333 |
326 |
309 |
304 |
7 |
2 |
24 |
8 |
29 |
10 |
|||||||||||||||||
Loans, net of unearned income |
654 |
668 |
665 |
658 |
(14 |
) |
(2 |
) |
(11 |
) |
(2 |
) |
(4 |
) |
(1 |
) |
|||||||||||
Allowance for loan losses |
(17 |
) |
(18 |
) |
(19 |
) |
(21 |
) |
1 |
(6 |
) |
2 |
(11 |
) |
4 |
(19 |
) |
||||||||||
Loans, net |
637 |
650 |
646 |
637 |
(13 |
) |
(2 |
) |
(9 |
) |
(1 |
) |
— |
— |
|||||||||||||
Other assets |
198 |
204 |
183 |
188 |
(6 |
) |
(3 |
) |
15 |
8 |
10 |
5 |
|||||||||||||||
Total assets |
$ |
1,883 |
$ |
1,910 |
$ |
1,880 |
$ |
1,900 |
$ |
(27 |
) |
(1 |
)% |
$ |
3 |
— |
% |
$ |
(17 |
) |
(1 |
)% |
|||||
Liabilities |
|||||||||||||||||||||||||||
Deposits |
$ |
943 |
$ |
966 |
$ |
968 |
$ |
955 |
$ |
(23 |
) |
(2 |
)% |
$ |
(25 |
) |
(3 |
)% |
$ |
(12 |
) |
(1 |
)% |
||||
Federal funds purchased and securities loaned or sold under agreements to repurchase |
176 |
184 |
204 |
216 |
(8 |
) |
(4 |
) |
(28 |
) |
(14 |
) |
(40 |
) |
(19 |
) |
|||||||||||
Trading account liabilities |
137 |
123 |
109 |
122 |
14 |
11 |
28 |
26 |
15 |
12 |
|||||||||||||||||
Short-term borrowings |
65 |
60 |
59 |
59 |
5 |
8 |
6 |
10 |
6 |
10 |
|||||||||||||||||
Long-term debt |
224 |
227 |
221 |
222 |
(3 |
) |
(1 |
) |
3 |
1 |
2 |
1 |
|||||||||||||||
Other liabilities |
124 |
137 |
113 |
123 |
(13 |
) |
(9 |
) |
11 |
10 |
1 |
1 |
|||||||||||||||
Total liabilities |
$ |
1,669 |
$ |
1,697 |
$ |
1,674 |
$ |
1,697 |
$ |
(28 |
) |
(2 |
)% |
$ |
(5 |
) |
— |
% |
$ |
(28 |
) |
(2 |
)% |
||||
Total equity |
214 |
213 |
206 |
203 |
1 |
— |
8 |
4 |
11 |
5 |
|||||||||||||||||
Total liabilities and equity |
$ |
1,883 |
$ |
1,910 |
$ |
1,880 |
$ |
1,900 |
$ |
(27 |
) |
(1 |
)% |
$ |
3 |
— |
% |
$ |
(17 |
) |
(1 |
)% |
|||||
In millions of dollars |
Global
Consumer
Banking
|
Institutional
Clients
Group
|
Corporate/Other
and
Consolidating
Eliminations(2)
|
Subtotal
Citicorp
|
Citi
Holdings
|
Citigroup
Parent
Company-
Issued
Long-Term
Debt and
Stockholders’
Equity(3)
|
Total
Citigroup
Consolidated
|
||||||||||||||
Assets |
|||||||||||||||||||||
Cash and deposits with banks |
$ |
16,765 |
$ |
63,817 |
$ |
97,622 |
$ |
178,204 |
$ |
840 |
$ |
— |
$ |
179,044 |
|||||||
Federal funds sold and securities borrowed or purchased under agreements to resell |
5,397 |
239,080 |
— |
244,477 |
985 |
— |
245,462 |
||||||||||||||
Trading account assets |
5,391 |
281,646 |
386 |
287,423 |
3,399 |
— |
290,822 |
||||||||||||||
Investments |
30,640 |
100,727 |
189,431 |
320,798 |
12,249 |
— |
333,047 |
||||||||||||||
Loans, net of unearned income and |
|||||||||||||||||||||
allowance for loan losses |
289,455 |
274,786 |
— |
564,241 |
72,670 |
— |
636,911 |
||||||||||||||
Other assets |
53,213 |
87,192 |
44,497 |
184,902 |
12,661 |
— |
197,563 |
||||||||||||||
Total assets |
$ |
400,861 |
$ |
1,047,248 |
$ |
331,936 |
$ |
1,780,045 |
$ |
102,804 |
$ |
— |
$ |
1,882,849 |
|||||||
Liabilities and equity |
|||||||||||||||||||||
Total deposits |
$ |
331,873 |
$ |
567,358 |
$ |
29,030 |
$ |
928,261 |
$ |
14,394 |
$ |
— |
$ |
942,655 |
|||||||
Federal funds purchased and securities loaned or sold under agreements to repurchase |
7,035 |
168,647 |
— |
175,682 |
50 |
— |
175,732 |
||||||||||||||
Trading account liabilities |
22 |
136,406 |
25 |
136,453 |
819 |
— |
137,272 |
||||||||||||||
Short-term borrowings |
440 |
52,950 |
11,275 |
64,665 |
173 |
— |
64,838 |
||||||||||||||
Long-term debt |
1,356 |
35,370 |
33,634 |
70,360 |
5,590 |
147,892 |
223,842 |
||||||||||||||
Other liabilities |
19,169 |
83,245 |
13,297 |
115,711 |
8,908 |
— |
124,619 |
||||||||||||||
Net inter-segment funding (lending) |
40,966 |
3,272 |
243,056 |
287,294 |
72,870 |
(360,164 |
) |
— |
|||||||||||||
Total liabilities |
$ |
400,861 |
$ |
1,047,248 |
$ |
330,317 |
$ |
1,778,426 |
$ |
102,804 |
$ |
(212,272 |
) |
$ |
1,668,958 |
||||||
Total equity |
— |
— |
1,619 |
1,619 |
— |
212,272 |
213,891 |
||||||||||||||
Total liabilities and equity |
$ |
400,861 |
$ |
1,047,248 |
$ |
331,936 |
$ |
1,780,045 |
$ |
102,804 |
$ |
— |
$ |
1,882,849 |
|||||||
(1) |
The supplemental information presented in the table above reflects Citigroup’s consolidated GAAP balance sheet by reporting segment as of September 30, 2014. The respective segment information depicts the assets and liabilities managed by each segment as of such date. While this presentation is not defined by GAAP, Citi believes that these non-GAAP financial measures enhance investors’ understanding of the balance sheet components managed by the underlying business segments, as well as the beneficial inter-relationships of the asset and liability dynamics of the balance sheet components among Citi’s business segments.
|
(2) |
Consolidating eliminations for total Citigroup and Citigroup parent company assets and liabilities are recorded within the Corporate/Other segment.
|
(3) |
The total stockholders’ equity and the majority of long-term debt of Citigroup reside in the Citigroup parent company Consolidated Balance Sheet. Citigroup allocates stockholders’ equity and long-term debt to its businesses through inter-segment allocations as shown above. |
Variable interests and other obligations, including contingent obligations, arising from variable interests in nonconsolidated VIEs |
See Note 20 to the Consolidated Financial Statements. |
Letters of credit, and lending and other commitments |
See Note 24 to the Consolidated Financial Statements. |
Guarantees |
See Note 24 to the Consolidated Financial Statements. |
Basel III Transition Arrangements: Minimum Risk-Based Capital Ratios |

Basel III Transition Arrangements: Significant Regulatory Capital Adjustments and Deductions |
January 1 |
||||||||||
2014 |
2015 |
2016 |
2017 |
2018 |
||||||
Phase-in of Significant Regulatory Capital Adjustments and Deductions |
||||||||||
Common Equity Tier 1 Capital(1)
|
20 |
% |
40 |
% |
60 |
% |
80 |
% |
100 |
% |
Common Equity Tier 1 Capital(2)
|
20 |
% |
40 |
% |
60 |
% |
80 |
% |
100 |
% |
Additional Tier 1 Capital(2)(3)
|
80 |
% |
60 |
% |
40 |
% |
20 |
% |
0 |
% |
100 |
% |
100 |
% |
100 |
% |
100 |
% |
100 |
% |
|
Phase-out of Significant AOCI Regulatory Capital Adjustments |
||||||||||
Common Equity Tier 1 Capital(4)
|
80 |
% |
60 |
% |
40 |
% |
20 |
% |
0 |
% |
(1) |
Includes the phase-in of Common Equity Tier 1 Capital deductions for all intangible assets other than goodwill and mortgage servicing rights (MSRs); and excess over 10%/15% limitations for deferred tax assets (DTAs) arising from temporary differences, significant common stock investments in unconsolidated financial institutions and MSRs. Goodwill (including goodwill “embedded” in the valuation of significant common stock investments in unconsolidated financial institutions) is fully deducted in arriving at Common Equity Tier 1 Capital commencing January 1, 2014. The amount of other intangible assets, aside from MSRs, not deducted in arriving at Common Equity Tier 1 Capital are risk-weighted at 100%, as are the excess over the 10%/15% limitations for DTAs arising from temporary differences, significant common stock investments in unconsolidated financial institutions and MSRs prior to full implementation of the Final Basel III Rules. Upon full implementation, the amount of temporary difference DTAs, significant common stock investments in unconsolidated financial institutions and MSRs not deducted in arriving at Common Equity Tier 1 Capital are risk-weighted at 250%. |
(2) |
Includes the phase-in of Common Equity Tier 1 Capital deductions related to DTAs arising from net operating loss, foreign tax credit and general business credit carry-forwards and defined benefit pension plan net assets; and the phase-in of the Common Equity Tier 1 Capital adjustment for cumulative unrealized net gains (losses) related to changes in fair value of financial liabilities attributable to Citi’s own creditworthiness. |
(3) |
To the extent Additional Tier 1 Capital is not sufficient to absorb regulatory capital adjustments and deductions, such excess is to be applied against Common Equity Tier 1 Capital. |
(4) |
Includes the phase-out from Common Equity Tier 1 Capital of adjustments related to unrealized gains (losses) on available-for-sale (AFS) debt securities; unrealized gains on AFS equity securities; unrealized gains (losses) on held-to-maturity (HTM) securities included in AOCI; and defined benefit plans liability adjustment. |
September 30, 2014 |
December 31, 2013(1)
|
||||||||||||
In millions of dollars, except ratios |
Advanced Approaches |
Standardized Approach(2)
|
Advanced Approaches |
Standardized Approach(2)
|
|||||||||
Common Equity Tier 1 Capital |
$ |
166,425 |
$ |
166,425 |
$ |
157,473 |
$ |
157,473 |
|||||
Tier 1 Capital |
166,425 |
166,425 |
157,473 |
157,473 |
|||||||||
Total Capital (Tier 1 Capital + Tier 2 Capital) (3)
|
184,807 |
195,711 |
176,748 |
187,374 |
|||||||||
Risk-Weighted Assets |
1,282,986 |
1,103,639 |
1,177,736 |
1,103,045 |
|||||||||
Quarterly Adjusted Average Total Assets (4)
|
1,842,777 |
1,842,777 |
1,830,896 |
1,830,896 |
|||||||||
Common Equity Tier 1 Capital ratio (5)
|
12.97 |
% |
15.08 |
% |
13.37 |
% |
14.28 |
% |
|||||
Tier 1 Capital ratio (5)
|
12.97 |
15.08 |
13.37 |
14.28 |
|||||||||
Total Capital ratio (5)
|
14.40 |
17.73 |
15.01 |
16.99 |
|||||||||
Tier 1 Leverage ratio |
9.03 |
9.03 |
8.60 |
8.60 |
|||||||||
(1) |
Pro forma presentation based on application of the Final Basel III Rules consistent with current period presentation. |
(2) |
Basel III 2014 Standardized Approach which reflects the application of the Basel I credit risk and Basel II.5 market risk capital rules. |
(3) |
Under the Advanced Approaches framework eligible credit reserves that exceed expected credit losses are eligible for inclusion in Tier 2 Capital to the extent the excess reserves do not exceed 0.6% of credit risk-weighted assets, which differs from the Standardized Approach in which the allowance for credit losses is includable in Tier 2 Capital up to 1.25% of credit risk-weighted assets, with any excess allowance for credit losses being deducted in arriving at credit risk-weighted assets. |
(4) |
Tier 1 Leverage ratio denominator. |
(5) |
As of September 30, 2014 and December 31, 2013, Citi’s reportable Common Equity Tier 1 Capital, Tier 1 Capital, and Total Capital ratios were the lower derived under the Basel III Advanced Approaches framework.
|
In millions of dollars |
September 30, 2014 |
December 31,
2013(1)
|
||||
Common Equity Tier 1 Capital |
||||||
Citigroup common stockholders’ equity(2)
|
$ |
203,421 |
$ |
197,694 |
||
Add: Qualifying noncontrolling interests |
564 |
597 |
||||
Regulatory Capital Adjustments and Deductions: |
||||||
Less: Net unrealized losses on securities AFS, net of tax(3)(4)
|
(330) |
(1,312) |
||||
Less: Defined benefit plans liability adjustment, net of tax(4)
|
(3,276) |
(3,191) |
||||
Less: Accumulated net unrealized losses on cash flow hedges, net of tax(5)
|
(979) |
(1,245) |
||||
|
Less: Cumulative unrealized net gain related to changes in fair value of financial liabilities
attributable to own creditworthiness, net of tax (4)(6)
|
39 |
35 |
||||
Less: Intangible assets: |
||||||
Goodwill, net of related deferred tax liabilities (DTLs) (7)
|
23,678 |
24,518 |
||||
|
Identifiable intangible assets other than mortgage servicing rights (MSRs), net of related
DTLs(4)
|
861 |
990 |
||||
Less: Defined benefit pension plan net assets(4)
|
236 |
225 |
||||
|
Less: Deferred tax assets (DTAs) arising from net operating loss, foreign tax credit and general
business credit carry-forwards (4)(8)
|
4,931 |
5,288 |
||||
|
Less: Excess over 10%/15% limitations for other DTAs, certain common stock investments,
and MSRs (4)(8)(9)
|
1,915 |
2,343 |
||||
Less: Deductions applied to Common Equity Tier 1 Capital due to insufficient amount of Additional Tier 1 Capital to cover deductions(4) |
10,485 |
13,167 |
||||
Total Common Equity Tier 1 Capital |
$ |
166,425 |
$ |
157,473 |
||
Additional Tier 1 Capital |
||||||
Qualifying perpetual preferred stock (2)
|
$ |
8,851 |
$ |
6,645 |
||
Qualifying trust preferred securities (10)
|
1,726 |
2,616 |
||||
Qualifying noncontrolling interests |
7 |
8 |
||||
Regulatory Capital Adjustment and Deductions: |
||||||
|
Less: Cumulative unrealized net gain related to changes in fair value of financial liabilities
attributable to own creditworthiness, net of tax (4)(6)
|
154 |
142 |
||||
Less: Minimum regulatory capital requirements of insurance underwriting subsidiaries(11)
|
248 |
243 |
||||
Less: Defined benefit pension plan net assets(4)
|
943 |
900 |
||||
|
Less: DTAs arising from net operating loss, foreign tax credit and general
business credit carry-forwards (4)(8)
|
19,724 |
21,151 |
||||
|
Less: Deductions applied to Common Equity Tier 1 Capital due to insufficient amount of Additional
Tier 1 Capital to cover deductions(4)
|
(10,485) |
(13,167) |
||||
Total Additional Tier 1 Capital |
$ |
— |
$ |
— |
||
Total Tier 1 Capital (Common Equity Tier 1 Capital + Additional Tier 1 Capital) |
$ |
166,425 |
$ |
157,473 |
||
Tier 2 Capital |
||||||
Qualifying subordinated debt(12)
|
$ |
16,985 |
$ |
16,594 |
||
Qualifying trust preferred securities |
— |
1,242 |
||||
Qualifying noncontrolling interests |
12 |
13 |
||||
Excess of eligible credit reserves over expected credit losses(13)
|
1,633 |
1,669 |
||||
Regulatory Capital Deduction: |
||||||
Less: Minimum regulatory capital requirements of insurance underwriting subsidiaries(11)
|
248 |
243 |
||||
Total Tier 2 Capital |
$ |
18,382 |
$ |
19,275 |
||
Total Capital (Tier 1 Capital + Tier 2 Capital) |
$ |
184,807 |
$ |
176,748 |
||
In millions of dollars |
September 30, 2014 |
December 31,
2013(15)
|
||||
Credit Risk (14)
|
$ |
882,201 |
$ |
834,082 |
||
Market Risk |
100,785 |
112,154 |
||||
Operational Risk |
300,000 |
231,500 |
||||
Total Risk-Weighted Assets |
$ |
1,282,986 |
$ |
1,177,736 |
||
(1) |
Pro forma presentation of regulatory capital components and tiers based on application of the Final Basel III Rules consistent with current period presentation. |
(2) |
Issuance costs of $117 million and $93 million related to preferred stock outstanding at September 30, 2014 and December 31, 2013, respectively, are excluded from common stockholders’ equity and netted against preferred stock in accordance with Federal Reserve Board regulatory reporting requirements, which differ from those under U.S. GAAP.
|
(3) |
In addition, includes the net amount of unamortized loss on held-to-maturity (HTM) securities. This amount relates to securities that were previously transferred from AFS to HTM, and non-credit related factors such as changes in interest rates and liquidity spreads for HTM securities with other-than-temporary impairment. |
(4) |
The transition arrangements for significant regulatory capital adjustments and deductions impacting Common Equity Tier 1 Capital and/or Additional Tier 1 Capital are set forth above in the table entitled “Basel III Transition Arrangements: Significant Regulatory Capital Adjustments and Deductions.” |
(5) |
Common Equity Tier 1 Capital is adjusted for accumulated net unrealized gains (losses) on cash flow hedges included in AOCI that relate to the hedging of items not recognized at fair value on the balance sheet. |
(6) |
The cumulative impact of changes in Citigroup’s own creditworthiness in valuing liabilities for which the fair value option has been elected and own-credit valuation adjustments on derivatives are excluded from Common Equity Tier 1 Capital, in accordance with the Final Basel III Rules. |
(7) |
Includes goodwill “embedded” in the valuation of significant common stock investments in unconsolidated financial institutions. |
(8) |
Of Citi’s approximately $49.9 billion of net DTAs at September 30, 2014, approximately $24.8 billion of such assets were includable in regulatory capital pursuant to the Final Basel III Rules, while approximately $25.1 billion of such assets were excluded in arriving at regulatory capital. Comprising the excluded net DTAs was an aggregate of approximately $26.6 billion of net DTAs arising from net operating loss, foreign tax credit and general business credit carry-forwards as well as temporary differences, of which $16.8 billion were deducted from Common Equity Tier 1 Capital and $9.8 billion were deducted from Additional Tier 1 Capital. In addition, approximately $1.5 billion of net DTLs, primarily consisting of DTLs associated with goodwill and certain other intangible assets, partially offset by DTAs related to cash flow hedges, are permitted to be excluded prior to deriving the amount of net DTAs subject to deduction under these rules. Separately, under the Final Basel III Rules, goodwill and these other intangible assets are deducted net of associated DTLs in arriving at Common Equity Tier 1 Capital, while Citi’s current cash flow hedges and the related deferred tax effects are not required to be reflected in regulatory capital.
|
(9) |
Aside from MSRs, reflects DTAs arising from temporary differences and significant common stock investments in unconsolidated financial institutions. |
(10) |
Represents Citigroup Capital XIII trust preferred securities, which are permanently grandfathered as Tier 1 Capital under the Final Basel III Rules, as well as non-grandfathered trust preferred securities. Under the Final Basel III Rules, the amount of non-grandfathered trust preferred securities eligible for inclusion in Tier 1 Capital during 2014 is limited to 50% of the amount of non-grandfathered trust preferred securities outstanding at January 1, 2014, with the remaining 50% eligible for inclusion in Tier 2 Capital. As a result of approximately $17.5 million of redemptions of non-grandfathered trust preferred securities during the third quarter of 2014, the remaining amount of non-grandfathered trust preferred securities outstanding at September 30, 2014 were eligible for inclusion in Tier 1 Capital.
|
(11) |
50% of the minimum regulatory capital requirements of insurance underwriting subsidiaries must be deducted from each of Tier 1 Capital and Tier 2 Capital. |
(12) |
Under the transition arrangements of the Final Basel III Rules, non-qualifying subordinated debt issuances which consist of those with a fixed-to-floating rate step-up feature where the call/step-up date has not passed are eligible for 50% inclusion in Tier 2 Capital during 2014, with the threshold based upon the aggregate outstanding principal amounts of such issuances as of January 1, 2014. |
(13) |
Advanced Approaches banking organizations are permitted to include in Tier 2 Capital eligible credit reserves that exceed expected credit losses to the extent that the excess reserves do not exceed 0.6% of credit risk-weighted assets. |
In millions of dollars |
Three Months Ended September 30, 2014 |
Nine Months Ended September 30, 2014 |
||||
Common Equity Tier 1 Capital |
||||||
Balance, beginning of period(1)
|
$ |
164,289 |
$ |
157,473 |
||
Net income |
2,839 |
6,963 |
||||
Dividends declared |
(159 |
) |
(443 |
) |
||
Net increase in treasury stock |
(111 |
) |
(973 |
) |
||
Net increase in additional paid-in capital(2)(3)
|
170 |
670 |
||||
Net increase in foreign currency translation adjustment net of hedges, net of tax |
(1,721 |
) |
(2,230 |
) |
||
Net change in unrealized losses on securities AFS, net of tax(4)
|
(42 |
) |
245 |
|||
Net change in defined benefit plans liability adjustment, net of tax(4)
|
14 |
(21 |
) |
|||
|
Net increase in cumulative unrealized net gain related to changes in fair value of financial
liabilities attributable to own creditworthiness, net of tax
|
(16 |
) |
(4 |
) |
||
Net decrease in goodwill, net of related deferred tax liabilities (DTLs) |
787 |
840 |
||||
|
Net decrease in other intangible assets other than mortgage servicing rights (MSRs),
net of related DTLs
|
40 |
129 |
||||
Net increase in defined benefit pension plan net assets |
(23 |
) |
(11 |
) |
||
Net decrease in deferred tax assets (DTAs) arising from net operating loss, foreign tax credit and general business credit carry-forwards |
97 |
357 |
||||
|
Net decrease in excess over 10%/15% limitations for other DTAs, certain common stock
investments and MSRs
|
132 |
428 |
||||
|
Net decrease in regulatory capital deduction applied to Common Equity Tier 1 Capital
due to insufficient Additional Tier 1 Capital to cover deductions
|
210 |
2,682 |
||||
Other |
(81 |
) |
320 |
|||
Net increase in Common Equity Tier 1 Capital |
$ |
2,136 |
$ |
8,952 |
||
Common Equity Tier 1 Capital Balance, end of period |
$ |
166,425 |
$ |
166,425 |
||
Additional Tier 1 Capital |
||||||
Balance, beginning of period(1)
|
$ |
— |
$ |
— |
||
Net increase in qualifying perpetual preferred stock(3)
|
— |
2,206 |
||||
Net decrease in qualifying trust preferred securities |
(27 |
) |
(890 |
) |
||
|
Net increase in cumulative unrealized net gain related to changes in fair value of financial
liabilities attributable to own creditworthiness, net of tax
|
(61 |
) |
(12 |
) |
||
Net increase in defined benefit pension plan net assets |
(90 |
) |
(43 |
) |
||
|
Net decrease in DTAs arising from net operating loss, foreign tax credit and general
business credit carry-forwards
|
388 |
1,427 |
||||
|
Net decrease in regulatory capital deduction applied to Common Equity Tier 1 Capital
due to insufficient Additional Tier 1 Capital to cover deductions
|
(210 |
) |
(2,682 |
) |
||
Other |
— |
(6 |
) |
|||
Net change in Additional Tier 1 Capital |
$ |
— |
$ |
— |
||
Tier 1 Capital Balance, end of period |
$ |
166,425 |
$ |
166,425 |
||
Tier 2 Capital |
||||||
Balance, beginning of period(1)
|
$ |
18,194 |
$ |
19,275 |
||
Net increase in qualifying subordinated debt |
376 |
391 |
||||
Net decrease in qualifying trust preferred securities |
— |
(1,242 |
) |
|||
Net decrease in excess of eligible credit reserves over expected credit losses |
(188 |
) |
(36 |
) |
||
Other |
— |
(6 |
) |
|||
Net change in Tier 2 Capital |
$ |
188 |
$ |
(893 |
) |
|
Tier 2 Capital Balance, end of period |
$ |
18,382 |
$ |
18,382 |
||
Total Capital (Tier 1 Capital + Tier 2 Capital) |
$ |
184,807 |
$ |
184,807 |
||
(1) |
Pro forma presentation based on application of the Final Basel III Rules consistent with current period presentation. |
(2) |
Primarily represents an increase in additional paid-in capital related to employee benefit plans. |
(3) |
Citi issued approximately $2.23 billion of qualifying perpetual preferred stock during the nine months ended September 30, 2014, which was partially offset by the netting of issuance costs of $24 million.
|
(4) |
Presented net of impact of transition arrangements for regulatory capital adjustments and deductions under the Final Basel III Rules. |
In millions of dollars |
Three Months Ended September 30, 2014 |
Nine Months Ended September 30, 2014(1) |
||||
Total Risk-Weighted Assets, beginning of period(2)
|
$ |
1,264,066 |
$ |
1,103,045 |
||
Impact of adoption of Basel III Advanced Approaches(3)
|
— |
74,691 |
||||
Changes in Credit Risk-Weighted Assets |
||||||
Net decrease in retail exposures |
(8,088 |
) |
(35,042 |
) |
||
Net increase in wholesale exposures |
29,943 |
41,014 |
||||
Net change in repo-style transactions |
(1,959 |
) |
4,927 |
|||
Net increase in securitization exposures |
1,078 |
2,636 |
||||
Net decrease in equity exposures |
(1,421 |
) |
(712 |
) |
||
Net increase in over-the-counter (OTC) derivatives |
4,189 |
19,306 |
||||
Net change in derivatives CVA |
(2,338 |
) |
2,710 |
|||
Net change in other (4)
|
(5,735 |
) |
10,710 |
|||
Net increase in supervisory 6% multiplier (5)
|
1,080 |
2,570 |
||||
Net increase in Credit Risk-Weighted Assets |
$ |
16,749 |
$ |
48,119 |
||
Changes in Market Risk-Weighted Assets |
||||||
Net decrease in risk levels |
$ |
(9,264 |
) |
$ |
(18,453 |
) |
Net change due to model and methodology updates |
(1,065 |
) |
7,084 |
|||
Net decrease in Market Risk-Weighted Assets |
$ |
(10,329 |
) |
$ |
(11,369 |
) |
Net increase in Operational Risk-Weighted Assets (6)
|
$ |
12,500 |
$ |
68,500 |
||
Total Risk-Weighted Assets, end of period |
$ |
1,282,986 |
$ |
1,282,986 |
||
(1) |
Total risk-weighted assets as of December 31, 2013 presented on a pro forma basis to reflect application of the Final Basel III Rules related to the effect of transition arrangements on regulatory capital components, consistent with current period presentation. |
(4) |
Other includes cleared transactions, unsettled transactions, assets other than those reportable in specific exposure categories and non-material portfolios of exposures. |
(5) |
Supervisory 6% multiplier does not apply to derivatives CVA. |
September 30, 2014 |
December 31, 2013(1)
|
||||||||||||
In millions of dollars, except ratios |
Advanced Approaches |
Standardized Approach(2)
|
Advanced Approaches |
Standardized Approach(2)
|
|||||||||
Common Equity Tier 1 Capital |
$ |
128,112 |
$ |
128,112 |
$ |
128,317 |
$ |
128,317 |
|||||
Tier 1 Capital |
128,112 |
128,112 |
128,317 |
128,317 |
|||||||||
Total Capital (Tier 1 Capital + Tier 2 Capital) (3)
|
136,430 |
146,435 |
137,277 |
146,267 |
|||||||||
Risk-Weighted Assets |
944,227 |
932,572 |
893,390 |
910,553 |
|||||||||
Quarterly Adjusted Average Total Assets (4)
|
1,354,441 |
1,354,441 |
1,321,440 |
1,321,440 |
|||||||||
Common Equity Tier 1 Capital ratio (5)
|
13.57 |
% |
13.74 |
% |
14.36 |
% |
14.09 |
% |
|||||
Tier 1 Capital ratio (5)
|
13.57 |
13.74 |
14.36 |
14.09 |
|||||||||
Total Capital ratio (5)
|
14.45 |
15.70 |
15.37 |
16.06 |
|||||||||
Tier 1 Leverage ratio |
9.46 |
9.46 |
9.71 |
9.71 |
|||||||||
(1) |
Pro forma presentation based on application of the Final Basel III Rules consistent with current period presentation. |
(2) |
Basel III 2014 Standardized Approach which reflects the application of the Basel I credit risk and Basel II.5 market risk capital rules. |
(3) |
Under the Advanced Approaches framework eligible credit reserves that exceed expected credit losses are eligible for inclusion in Tier 2 Capital to the extent the excess reserves do not exceed 0.6% of credit risk-weighted assets, which differs from the Standardized Approach in which the allowance for credit losses is includable in Tier 2 Capital up to 1.25% of credit risk-weighted assets, with any excess allowance for credit losses being deducted in arriving at credit risk-weighted assets. |
(4) |
Tier 1 Leverage ratio denominator. |
(5) |
As of September 30, 2014, Citibank, N.A.’s reportable Common Equity Tier 1 Capital, Tier 1 Capital, and Total Capital ratios were the lower derived under the Basel III Advanced Approaches. As of December 31, 2013, Citibank, N.A.’s reportable Common Equity Tier 1 Capital and Tier 1 Capital ratios were the lower derived under the Basel III 2014 Standardized Approach (Basel I credit risk and Basel II.5 market risk capital rules), whereas the reportable Total Capital ratio was the lower derived under the Advanced Approaches framework.
|
|
Common Equity
Tier 1 Capital ratio
|
Tier 1 Capital ratio |
Total Capital ratio |
Tier 1 Leverage ratio |
|||||
|
Impact of
$100 million
change in
Common Equity
Tier 1 Capital
|
Impact of
$1 billion
change in risk-
weighted assets
|
Impact of
$100 million
change in
Tier 1
Capital
|
Impact of
$1 billion
change in risk-
weighted assets
|
Impact of
$100 million
change in
Total
Capital
|
Impact of
$1 billion
change in risk-
weighted assets
|
Impact of
$100 million
change in
Tier 1
Capital
|
Impact of
$1 billion
change in
quarterly adjusted
average total
assets
|
|
Citigroup |
||||||||
Advanced Approaches |
0.8 bps |
1.0 bps |
0.8 bps |
1.0 bps |
0.8 bps |
1.1 bps |
0.5 bps |
0.5 bps |
Standardized Approach (1)
|
0.9 bps |
1.4 bps |
0.9 bps |
1.4 bps |
0.9 bps |
1.6 bps |
0.5 bps |
0.5 bps |
Citibank, N.A. |
||||||||
Advanced Approaches |
1.1 bps |
1.4 bps |
1.1 bps |
1.4 bps |
1.1 bps |
1.5 bps |
0.7 bps |
0.7 bps |
Standardized Approach (1)
|
1.1 bps |
1.5 bps |
1.1 bps |
1.5 bps |
1.1 bps |
1.7 bps |
0.7 bps |
0.7 bps |
September 30, 2014 |
December 31, 2013 |
||||||||||||
In millions of dollars, except ratios |
Advanced Approaches |
Standardized Approach(1)
|
Advanced Approaches |
Standardized Approach(1)
|
|||||||||
Common Equity Tier 1 Capital |
$ |
138,762 |
$ |
138,762 |
$ |
125,597 |
$ |
125,597 |
|||||
Tier 1 Capital |
148,772 |
148,772 |
133,412 |
133,412 |
|||||||||
Total Capital (Tier 1 Capital + Tier 2 Capital)(2)
|
166,254 |
179,056 |
150,049 |
161,782 |
|||||||||
Risk-Weighted Assets |
1,302,000 |
1,252,000 |
1,186,000 |
1,177,000 |
|||||||||
Quarterly Adjusted Average Total Assets(3)
|
1,829,524 |
1,829,524 |
1,814,368 |
1,814,368 |
|||||||||
Common Equity Tier 1 Capital ratio(4)(5)
|
10.66 |
% |
11.08 |
% |
10.59 |
% |
10.67 |
% |
|||||
Tier 1 Capital ratio(4)(5)
|
11.43 |
11.88 |
11.25 |
11.34 |
|||||||||
Total Capital ratio(4)(5)
|
12.77 |
14.30 |
12.65 |
13.75 |
|||||||||
Tier 1 Leverage ratio(5)
|
8.13 |
8.13 |
7.35 |
7.35 |
|||||||||
(2) |
Under the Advanced Approaches framework eligible credit reserves that exceed expected credit losses are eligible for inclusion in Tier 2 Capital to the extent the excess reserves do not exceed 0.6% of credit risk-weighted assets, which differs from the Standardized Approach in which the allowance for credit losses is includable in Tier 2 Capital up to 1.25% of credit risk-weighted assets, with any excess allowance for credit losses being deducted in arriving at credit risk-weighted assets. |
In millions of dollars |
September 30, 2014 |
December 31, 2013 |
||||
Common Equity Tier 1 Capital |
||||||
Citigroup common stockholders’ equity (1)
|
$ |
203,421 |
$ |
197,694 |
||
Add: Qualifying noncontrolling interests |
172 |
182 |
||||
Regulatory Capital Adjustments and Deductions: |
||||||
Less: Accumulated net unrealized losses on cash flow hedges, net of tax (2)
|
(979 |
) |
(1,245 |
) |
||
|
Less: Cumulative unrealized net gain related to changes in fair value of financial liabilities
attributable to own creditworthiness, net of tax (3)
|
193 |
177 |
||||
Less: Intangible assets: |
||||||
Goodwill, net of related deferred tax liabilities (DTLs) (4)
|
23,678 |
24,518 |
||||
Identifiable intangible assets other than mortgage servicing rights (MSRs), net of related DTLs |
4,307 |
4,950 |
||||
Less: Defined benefit pension plan net assets |
1,179 |
1,125 |
||||
|
Less: Deferred tax assets (DTAs) arising from net operating loss, foreign tax credit and general
business credit carry-forwards (5)
|
24,655 |
26,439 |
||||
|
Less: Excess over 10%/15% limitations for other DTAs, certain common stock investments,
and MSRs (5)(6)
|
11,798 |
16,315 |
||||
Total Common Equity Tier 1 Capital |
$ |
138,762 |
$ |
125,597 |
||
Additional Tier 1 Capital |
||||||
Qualifying perpetual preferred stock (1)
|
8,851 |
6,645 |
||||
Qualifying trust preferred securities (7)
|
1,370 |
1,374 |
||||
Qualifying noncontrolling interests |
37 |
39 |
||||
Regulatory Capital Deduction: |
||||||
Less: Minimum regulatory capital requirements of insurance underwriting subsidiaries(8)
|
248 |
243 |
||||
Total Additional Tier 1 Capital |
$ |
10,010 |
$ |
7,815 |
||
Total Tier 1 Capital (Common Equity Tier 1 Capital + Additional Tier 1 Capital) |
$ |
148,772 |
$ |
133,412 |
||
Tier 2 Capital |
||||||
Qualifying subordinated debt (9)
|
15,693 |
14,414 |
||||
Qualifying trust preferred securities (10)
|
356 |
745 |
||||
Qualifying noncontrolling interests |
48 |
52 |
||||
Excess of eligible credit reserves over expected credit losses(11)
|
1,633 |
1,669 |
||||
Regulatory Capital Deduction: |
||||||
Less: Minimum regulatory capital requirements of insurance underwriting subsidiaries(8)
|
248 |
243 |
||||
Total Tier 2 Capital |
$ |
17,482 |
$ |
16,637 |
||
Total Capital (Tier 1 Capital + Tier 2 Capital) (12)
|
$ |
166,254 |
$ |
150,049 |
||
(1) |
Issuance costs of $117 million and $93 million related to preferred stock outstanding at September 30, 2014 and December 31, 2013, respectively, are excluded from common stockholders’ equity and netted against preferred stock in accordance with Federal Reserve Board regulatory reporting requirements, which differ from those under U.S. GAAP.
|
(2) |
Common Equity Tier 1 Capital is adjusted for accumulated net unrealized gains (losses) on cash flow hedges included in AOCI that relate to the hedging of items not recognized at fair value on the balance sheet. |
(3) |
The cumulative impact of changes in Citigroup’s own creditworthiness in valuing liabilities for which the fair value option has been elected and own-credit valuation adjustments on derivatives are excluded from Common Equity Tier 1 Capital, in accordance with the Final Basel III Rules. |
(4) |
Includes goodwill “embedded” in the valuation of significant common stock investments in unconsolidated financial institutions. |
(5) |
Of Citi’s approximately $49.9 billion of net DTAs at September 30, 2014, approximately $15.1 billion of such assets were includable in regulatory capital pursuant to the Final Basel III Rules, while approximately $34.8 billion of such assets were excluded in arriving at Common Equity Tier 1 Capital. Comprising the excluded net DTAs was an aggregate of approximately $36.3 billion of net DTAs arising from net operating loss, foreign tax credit and general business credit carry-forwards as well as temporary differences that were deducted from Common Equity Tier 1 Capital. In addition, approximately $1.5 billion of net DTLs, primarily consisting of DTLs associated with goodwill and certain other intangible assets, partially offset by DTAs related to cash flow hedges, are permitted to be excluded prior to deriving the amount of net DTAs subject to deduction under these rules. Separately, under the Final Basel III Rules, goodwill and these other intangible assets are deducted net of associated DTLs in arriving at Common Equity Tier 1 Capital, while Citi’s current cash flow hedges and the related deferred tax effects are not required to be reflected in regulatory capital.
|
(6) |
Aside from MSRs, reflects DTAs arising from temporary differences and significant common stock investments in unconsolidated financial institutions. |
(7) |
Represents Citigroup Capital XIII trust preferred securities, which are permanently grandfathered as Tier 1 Capital under the Final Basel III Rules. |
(8) |
50% of the minimum regulatory capital requirements of insurance underwriting subsidiaries must be deducted from each of Tier 1 Capital and Tier 2 Capital. |
(9) |
Non-qualifying subordinated debt issuances which consist of those with a fixed-to-floating rate step-up feature where the call/step-up date has not passed are excluded from Tier 2 Capital. |
(10) |
Represents the amount of non-grandfathered trust preferred securities eligible for inclusion in Tier 2 Capital under the Final Basel III Rules at September 30, 2014, which will be fully phased-out of Tier 2 Capital by January 1, 2022.
|
(11) |
Advanced Approaches banking organizations are permitted to include in Tier 2 Capital eligible credit reserves that exceed expected credit losses to the extent that the excess reserves do not exceed 0.6% of credit risk-weighted assets. |
(12) |
Total Capital as calculated under Advanced Approaches, which differs from the Standardized Approach in the treatment of the amount of eligible credit reserves includable in Tier 2 Capital. |
In millions of dollars |
Three Months Ended September 30, 2014 |
Nine Months Ended September 30, 2014 |
||||
Common Equity Tier 1 Capital |
||||||
Balance, beginning of period |
$ |
135,567 |
$ |
125,597 |
||
Net income |
2,839 |
6,963 |
||||
Dividends declared |
(159 |
) |
(443 |
) |
||
Net increase in treasury stock |
(111 |
) |
(973 |
) |
||
Net increase in additional paid-in capital(1)(2)
|
170 |
670 |
||||
Net increase in foreign currency translation adjustment net of hedges, net of tax |
(1,721 |
) |
(2,230 |
) |
||
Net change in unrealized losses on securities AFS, net of tax |
(207 |
) |
1,227 |
|||
Net change in defined benefit plans liability adjustment, net of tax |
71 |
(106 |
) |
|||
|
Net increase in cumulative unrealized net gain related to changes in fair value of financial
liabilities attributable to own creditworthiness, net of tax
|
(77 |
) |
(16 |
) |
||
Net decrease in goodwill, net of related deferred tax liabilities (DTLs) |
787 |
840 |
||||
|
Net decrease in other intangible assets other than mortgage servicing rights (MSRs),
net of related DTLs
|
199 |
643 |
||||
Net increase in defined benefit pension plan net assets |
(113 |
) |
(54 |
) |
||
Net decrease in deferred tax assets (DTAs) arising from net operating loss, foreign tax credit and general business credit carry-forwards |
485 |
1,784 |
||||
|
Net decrease in excess over 10%/15% limitations for other DTAs, certain common stock
investments and MSRs
|
1,043 |
4,517 |
||||
Other |
(11 |
) |
343 |
|||
Net increase in Common Equity Tier 1 Capital |
$ |
3,195 |
$ |
13,165 |
||
Common Equity Tier 1 Capital Balance, end of period |
$ |
138,762 |
$ |
138,762 |
||
Additional Tier 1 Capital |
||||||
Balance, beginning of period |
$ |
10,012 |
$ |
7,815 |
||
Net increase in qualifying perpetual preferred stock(2)
|
— |
2,206 |
||||
Net decrease in qualifying trust preferred securities |
(1 |
) |
(4 |
) |
||
Other |
(1 |
) |
(7 |
) |
||
Net change in Additional Tier 1 Capital |
$ |
(2 |
) |
$ |
2,195 |
|
Tier 1 Capital Balance, end of period |
$ |
148,772 |
$ |
148,772 |
||
Tier 2 Capital |
||||||
Balance, beginning of period |
$ |
17,322 |
$ |
16,637 |
||
Net increase in qualifying subordinated debt |
376 |
1,279 |
||||
Net decrease in excess of eligible credit reserves over expected credit losses |
(188 |
) |
(36 |
) |
||
Other |
(28 |
) |
(398 |
) |
||
Net increase in Tier 2 Capital |
$ |
160 |
$ |
845 |
||
Tier 2 Capital Balance, end of period |
$ |
17,482 |
$ |
17,482 |
||
Total Capital (Tier 1 Capital + Tier 2 Capital) |
$ |
166,254 |
$ |
166,254 |
||
(1) |
Primarily represents an increase in additional paid-in capital related to employee benefit plans. |
(2) |
Citi issued approximately $2.23 billion of qualifying perpetual preferred stock during the nine months ended September 30, 2014, which was partially offset by the netting of issuance costs of $24 million.
|
Advanced Approaches |
Standardized Approach |
||||||||||||||||||
In millions of dollars |
Citicorp |
Citi Holdings |
Total |
Citicorp |
Citi Holdings |
Total |
|||||||||||||
Credit Risk |
$ |
773,000 |
$ |
128,000 |
$ |
901,000 |
$ |
1,051,000 |
$ |
100,000 |
$ |
1,151,000 |
|||||||
Market Risk |
96,000 |
5,000 |
$ |
101,000 |
96,000 |
5,000 |
101,000 |
||||||||||||
Operational Risk (2)
|
246,000 |
54,000 |
$ |
300,000 |
— |
— |
— |
||||||||||||
Total Risk-Weighted Assets |
$ |
1,115,000 |
$ |
187,000 |
$ |
1,302,000 |
$ |
1,147,000 |
$ |
105,000 |
$ |
1,252,000 |
|||||||
Advanced Approaches |
Standardized Approach |
||||||||||||||||||
In millions of dollars |
Citicorp |
Citi Holdings |
Total |
Citicorp |
Citi Holdings |
Total |
|||||||||||||
Credit Risk |
$ |
693,000 |
$ |
149,000 |
$ |
842,000 |
$ |
963,000 |
$ |
102,000 |
$ |
1,065,000 |
|||||||
Market Risk |
107,000 |
5,000 |
112,000 |
107,000 |
5,000 |
112,000 |
|||||||||||||
Operational Risk |
160,000 |
72,000 |
232,000 |
— |
— |
— |
|||||||||||||
Total Risk-Weighted Assets |
$ |
960,000 |
$ |
226,000 |
$ |
1,186,000 |
$ |
1,070,000 |
$ |
107,000 |
$ |
1,177,000 |
|||||||
In millions of dollars |
Three Months Ended September 30, 2014(1) |
Nine Months Ended September 30, 2014(1) |
||||
Total Risk-Weighted Assets, beginning of period |
$ |
1,281,000 |
$ |
1,186,000 |
||
Changes in Credit Risk-Weighted Assets |
||||||
Net decrease in retail exposures |
(9,000 |
) |
(35,000 |
) |
||
Net increase in wholesale exposures |
30,000 |
41,000 |
||||
Net change in repo-style transactions |
(2,000 |
) |
5,000 |
|||
Net increase in securitization exposures |
1,000 |
3,000 |
||||
Net decrease in equity exposures |
(1,000 |
) |
(2,000 |
) |
||
Net increase in over-the-counter (OTC) derivatives |
4,000 |
19,000 |
||||
Net change in derivatives CVA |
(2,000 |
) |
3,000 |
|||
Net change in other (2)
|
(4,000 |
) |
18,000 |
|||
Net increase in supervisory 6% multiplier (3)
|
1,000 |
6,000 |
||||
Net increase in Credit Risk-Weighted Assets |
$ |
18,000 |
$ |
58,000 |
||
Changes in Market Risk-Weighted Assets |
||||||
Net decrease in risk levels |
$ |
(9,000 |
) |
$ |
(18,000 |
) |
Net change due to model and methodology updates |
(1,000 |
) |
7,000 |
|||
Net decrease in Market Risk-Weighted Assets |
$ |
(10,000 |
) |
$ |
(11,000 |
) |
Net increase in Operational Risk-Weighted Assets (4)
|
$ |
13,000 |
$ |
69,000 |
||
Total Risk-Weighted Assets, end of period |
$ |
1,302,000 |
$ |
1,302,000 |
||
(1) |
Calculated based on the Final Basel III Rules. |
(3) |
Supervisory 6% multiplier does not apply to derivatives CVA. |
In millions of dollars, except ratios |
September 30, 2014 |
December 31, 2013(2)
|
||||
Tier 1 Capital |
$ |
148,772 |
$ |
133,412 |
||
Total Leverage Exposure (TLE) |
||||||
On-balance sheet assets(3)
|
$ |
1,895,389 |
$ |
1,886,613 |
||
Certain off-balance sheet exposures:(4)
|
||||||
Potential future exposure (PFE) on derivative contracts |
251,022 |
240,534 |
||||
Effective notional of sold credit derivatives, net(5)
|
93,350 |
102,061 |
||||
Counterparty credit risk for repo-style transactions(6)
|
25,588 |
26,035 |
||||
Unconditionally cancellable commitments |
62,870 |
63,782 |
||||
Other off-balance sheet exposures |
222,600 |
210,571 |
||||
Total of certain off-balance sheet exposures |
655,430 |
642,983 |
||||
Less: Tier 1 Capital deductions |
65,865 |
73,590 |
||||
Total Leverage Exposure |
$ |
2,484,954 |
$ |
2,456,006 |
||
Supplementary Leverage ratio |
5.99 |
% |
5.43 |
% |
||
(1) |
Citi’s estimated Basel III Supplementary Leverage ratio and certain related components are non-GAAP financial measures. Citi believes this ratio and its components provide useful information to investors and others by measuring Citigroup’s progress against future regulatory capital standards. |
(2) |
Pro forma presentation based on application of the Revised Final Basel III Rules consistent with current period presentation. |
(3) |
Represents the daily average of on-balance sheet assets for the quarter. |
(4) |
Represents the average of certain off-balance sheet exposures calculated as of the last day of each month in the quarter. |
(5) |
Under the Revised Final Basel III Rules, banking organizations are required to include in TLE the effective notional amount of sold credit derivatives, with netting of exposures permitted if certain conditions are met. |
(6) |
Repo-style transactions include repurchase or reverse repurchase transactions and securities borrowing or securities lending transactions. |
In millions of dollars or shares, except per share amounts |
September 30, 2014 |
December 31, 2013 |
||||
Total Citigroup stockholders’ equity |
$ |
212,272 |
$ |
204,339 |
||
Less: Preferred stock |
8,968 |
6,738 |
||||
Common equity |
$ |
203,304 |
$ |
197,601 |
||
Less: Intangible assets: |
||||||
Goodwill |
24,500 |
25,009 |
||||
Other intangible assets (other than MSRs) |
4,525 |
5,056 |
||||
Tangible common equity (TCE) |
$ |
174,279 |
$ |
167,536 |
||
Common shares outstanding (CSO) |
3,029.5 |
3,029.2 |
||||
Tangible book value per share (TCE/CSO) |
$ |
57.53 |
$ |
55.31 |
||
Book value per share (common equity/CSO) |
$ |
67.11 |
$ |
65.23 |
||
Page |
|||
CREDIT RISK (1)
|
|||
Loans Outstanding |
|||
Details of Credit Loss Experience |
|||
Allowance for Loan Losses |
51 |
||
Non-Accrual Loans and Assets and Renegotiated Loans |
|||
North America Consumer Mortgage Lending
|
|||
Consumer Loan Details |
|||
Corporate Credit Details |
|||
MARKET RISK(1)
|
|||
Funding and Liquidity Risk |
|||
Overview |
|||
High Quality Liquid Assets |
|||
Deposits |
68 |
||
Long-Term Debt |
69 |
||
Secured Funding Transactions and Short-Term Borrowings |
71 |
||
Liquidity Management, Measurement and Stress Testing |
71 |
||
Credit Ratings |
72 |
||
Price Risk |
|||
Price Risk—Non-Trading Portfolios (including Interest Rate Exposure) |
|||
Price Risk—Trading Portfolios (including VAR) |
|||
COUNTRY AND CROSS-BORDER RISK |
|||
Country Risk |
|||
Cross-Border Risk |
|||
(1) |
For additional information regarding certain credit risk, market risk and other quantitative and qualitative information, refer to Citi’s Basel III Advanced Approaches Disclosures, as required by the rules of the Federal Reserve Board, on Citi’s Investor Relations website. |
3rd Qtr. |
2nd Qtr. |
1st Qtr. |
4th Qtr. |
3rd Qtr. |
|||||||||||
In millions of dollars |
2014 |
2014 |
2013 |
2013 |
2013 |
||||||||||
Consumer loans |
|||||||||||||||
In U.S. offices |
|||||||||||||||
Mortgage and real estate(1)
|
$ |
101,583 |
$ |
103,905 |
$ |
106,904 |
$ |
108,453 |
$ |
110,813 |
|||||
Installment, revolving credit, and other |
13,350 |
13,192 |
12,951 |
13,398 |
13,265 |
||||||||||
Cards |
108,314 |
109,138 |
107,947 |
115,651 |
110,734 |
||||||||||
Commercial and industrial |
6,870 |
6,972 |
6,884 |
6,592 |
6,349 |
||||||||||
Lease financing |
— |
— |
— |
— |
— |
||||||||||
$ |
230,117 |
$ |
233,207 |
$ |
234,686 |
$ |
244,094 |
$ |
241,161 |
||||||
In offices outside the U.S. |
|||||||||||||||
Mortgage and real estate(1)
|
$ |
56,099 |
$ |
57,291 |
$ |
56,118 |
$ |
55,511 |
$ |
54,428 |
|||||
Installment, revolving credit, and other |
34,270 |
34,560 |
33,409 |
33,182 |
32,306 |
||||||||||
Cards |
32,410 |
34,252 |
35,683 |
36,740 |
35,966 |
||||||||||
Commercial and industrial |
23,393 |
24,916 |
24,575 |
24,107 |
23,741 |
||||||||||
Lease financing |
678 |
735 |
736 |
769 |
743 |
||||||||||
$ |
146,850 |
$ |
151,754 |
$ |
150,521 |
$ |
150,309 |
$ |
147,184 |
||||||
Total Consumer loans |
$ |
376,967 |
$ |
384,961 |
$ |
385,207 |
$ |
394,403 |
$ |
388,345 |
|||||
Unearned income |
(649 |
) |
(616 |
) |
(546 |
) |
(572 |
) |
(523 |
) |
|||||
Consumer loans, net of unearned income |
$ |
376,318 |
$ |
384,345 |
$ |
384,661 |
$ |
393,831 |
$ |
387,822 |
|||||
Corporate loans |
|||||||||||||||
In U.S. offices |
|||||||||||||||
Commercial and industrial |
$ |
36,516 |
$ |
36,293 |
$ |
36,120 |
$ |
32,704 |
$ |
33,936 |
|||||
Loans to financial institutions |
31,916 |
29,195 |
27,888 |
25,102 |
22,813 |
||||||||||
Mortgage and real estate(1)
|
32,285 |
31,417 |
29,888 |
29,425 |
29,168 |
||||||||||
Installment, revolving credit, and other |
30,378 |
32,646 |
34,219 |
34,434 |
31,084 |
||||||||||
Lease financing |
1,737 |
1,668 |
1,662 |
1,647 |
1,493 |
||||||||||
$ |
132,832 |
$ |
131,219 |
$ |
129,777 |
$ |
123,312 |
$ |
118,494 |
||||||
In offices outside the U.S. |
|||||||||||||||
Commercial and industrial |
$ |
80,304 |
$ |
82,945 |
$ |
83,134 |
$ |
82,663 |
$ |
86,012 |
|||||
Loans to financial institutions |
35,854 |
40,541 |
39,543 |
38,372 |
40,403 |
||||||||||
Mortgage and real estate(1)
|
6,243 |
6,309 |
6,301 |
6,274 |
6,392 |
||||||||||
Installment, revolving credit, and other |
20,151 |
20,095 |
18,655 |
18,714 |
16,783 |
||||||||||
Lease financing |
396 |
430 |
454 |
527 |
538 |
||||||||||
Governments and official institutions |
2,264 |
2,176 |
2,256 |
2,341 |
1,655 |
||||||||||
$ |
145,212 |
$ |
152,496 |
$ |
150,343 |
$ |
148,891 |
$ |
151,783 |
||||||
Total Corporate loans |
$ |
278,044 |
$ |
283,715 |
$ |
280,120 |
$ |
272,203 |
$ |
270,277 |
|||||
Unearned income |
(536 |
) |
(556 |
) |
(560 |
) |
(562 |
) |
(548 |
) |
|||||
Corporate loans, net of unearned income |
$ |
277,508 |
$ |
283,159 |
$ |
279,560 |
$ |
271,641 |
$ |
269,729 |
|||||
Total loans—net of unearned income |
$ |
653,826 |
$ |
667,504 |
$ |
664,221 |
$ |
665,472 |
$ |
657,551 |
|||||
Allowance for loan losses—on drawn exposures |
(16,915 |
) |
(17,890 |
) |
(18,923 |
) |
(19,648 |
) |
(20,605 |
) |
|||||
Total loans—net of unearned income and allowance for credit losses |
$ |
636,911 |
$ |
649,614 |
$ |
645,298 |
$ |
645,824 |
$ |
636,946 |
|||||
Allowance for loan losses as a percentage of total loans—net of unearned income(2)
|
2.60 |
% |
2.70 |
% |
2.87 |
% |
2.97 |
% |
3.16 |
% |
|||||
Allowance for Consumer loan losses as a percentage of total Consumer loans—net of unearned income(2)
|
3.87 |
% |
4.04 |
% |
4.29 |
% |
4.34 |
% |
4.63 |
% |
|||||
Allowance for Corporate loan losses as a percentage of total Corporate loans—net of unearned income(2)
|
0.86 |
% |
0.85 |
% |
0.90 |
% |
0.97 |
% |
1.01 |
% |
|||||
(1) |
Loans secured primarily by real estate. |
(2) |
All periods exclude loans that are carried at fair value. |
3rd Qtr. |
2nd Qtr. |
1st Qtr. |
4th Qtr. |
3rd Qtr. |
|||||||||||
In millions of dollars |
2014 |
2014 |
2014 |
2013 |
2013 |
||||||||||
Allowance for loan losses at beginning of period |
$ |
17,890 |
$ |
18,923 |
$ |
19,648 |
$ |
20,605 |
$ |
21,580 |
|||||
Provision for loan losses |
|||||||||||||||
Consumer |
$ |
1,605 |
$ |
1,669 |
$ |
1,759 |
$ |
2,012 |
$ |
1,583 |
|||||
Corporate |
(30 |
) |
(90 |
) |
34 |
(101 |
) |
69 |
|||||||
$ |
1,575 |
$ |
1,579 |
$ |
1,793 |
$ |
1,911 |
$ |
1,652 |
||||||
Gross credit losses |
|||||||||||||||
Consumer |
|||||||||||||||
In U.S. offices |
$ |
1,595 |
$ |
1,756 |
$ |
1,841 |
$ |
2,019 |
$ |
1,859 |
|||||
In offices outside the U.S. |
948 |
1,009 |
968 |
1,011 |
967 |
||||||||||
Corporate |
|||||||||||||||
In U.S. offices |
9 |
14 |
8 |
27 |
95 |
||||||||||
In offices outside the U.S. |
34 |
33 |
166 |
37 |
53 |
||||||||||
$ |
2,586 |
$ |
2,812 |
$ |
2,983 |
$ |
3,094 |
$ |
2,974 |
||||||
Credit recoveries (1)
|
|||||||||||||||
Consumer |
|||||||||||||||
In U.S. offices |
$ |
232 |
$ |
356 |
$ |
292 |
$ |
236 |
$ |
253 |
|||||
In offices outside the U.S. |
196 |
231 |
223 |
262 |
239 |
||||||||||
Corporate |
|||||||||||||||
In U.S offices |
18 |
22 |
18 |
22 |
39 |
||||||||||
In offices outside the U.S. |
43 |
14 |
11 |
27 |
13 |
||||||||||
$ |
489 |
$ |
623 |
$ |
544 |
$ |
547 |
$ |
544 |
||||||
Net credit losses (recoveries) |
|||||||||||||||
In U.S. offices |
$ |
1,354 |
$ |
1,392 |
$ |
1,539 |
$ |
1,788 |
$ |
1,662 |
|||||
In offices outside the U.S. |
743 |
797 |
900 |
759 |
768 |
||||||||||
Total |
$ |
2,097 |
$ |
2,189 |
$ |
2,439 |
$ |
2,547 |
$ |
2,430 |
|||||
Other - net (2)(3)(4)(5)(6)(7)
|
$ |
(453 |
) |
$ |
(423 |
) |
$ |
(79 |
) |
(321 |
) |
$ |
(197 |
) |
|
Allowance for loan losses at end of period |
$ |
16,915 |
$ |
17,890 |
$ |
18,923 |
$ |
19,648 |
$ |
20,605 |
|||||
Allowance for loan losses as a % of total loans(8)
|
2.60 |
% |
2.70 |
% |
2.87 |
% |
2.97 |
% |
3.16 |
% |
|||||
Allowance for unfunded lending commitments(9)
|
$ |
1,140 |
$ |
1,176 |
$ |
1,202 |
$ |
1,229 |
$ |
1,262 |
|||||
Total allowance for loan losses and unfunded lending commitments |
$ |
18,055 |
$ |
19,066 |
$ |
20,125 |
$ |
20,877 |
$ |
21,867 |
|||||
Net Consumer credit losses (recoveries) |
$ |
2,115 |
$ |
2,178 |
$ |
2,294 |
$ |
2,532 |
$ |
2,334 |
|||||
As a percentage of average Consumer loans |
2.21 |
% |
2.27 |
% |
2.41 |
% |
2.58 |
% |
2.41 |
% |
|||||
Net Corporate credit losses (recoveries) |
$ |
(18 |
) |
$ |
11 |
$ |
145 |
$ |
15 |
$ |
96 |
||||
As a percentage of average Corporate loans |
(0.03 |
)% |
0.02 |
% |
0.22 |
% |
0.02 |
% |
0.15 |
% |
|||||
Allowance for loan losses at end of period(10)
|
|||||||||||||||
Citicorp |
$ |
11,915 |
$ |
12,473 |
$ |
12,870 |
$ |
13,174 |
$ |
13,299 |
|||||
Citi Holdings |
5,000 |
5,417 |
6,053 |
6,474 |
7,306 |
||||||||||
Total Citigroup |
$ |
16,915 |
$ |
17,890 |
$ |
18,923 |
$ |
19,648 |
$ |
20,605 |
|||||
Allowance by type |
|||||||||||||||
Consumer |
$ |
14,575 |
$ |
15,520 |
$ |
16,451 |
$ |
17,064 |
$ |
17,912 |
|||||
Corporate |
2,340 |
2,370 |
2,472 |
2,584 |
2,693 |
||||||||||
Total Citigroup |
$ |
16,915 |
$ |
17,890 |
$ |
18,923 |
$ |
19,648 |
$ |
20,605 |
|||||
(1) |
Recoveries have been reduced by certain collection costs that are incurred only if collection efforts are successful. |
(2) |
Includes all adjustments to the allowance for credit losses, such as changes in the allowance from acquisitions, dispositions, securitizations, foreign currency translation, purchase accounting adjustments, etc. |
(3) |
The third quarter of 2014 includes a reduction of approximately $259 million related to the sale or transfers to held-for-sale (HFS) of various loan portfolios, including a reduction of $151 million related to a transfer of a real estate loan portfolio to HFS and a reduction of approximately $108 million related to the |
(4) |
The second quarter of 2014 includes a reduction of approximately $480 million related to the sale or transfers to HFS of various loan portfolios, including a reduction of approximately $204 million and $177 million related to the transfers to HFS of businesses in Greece and Spain, $29 million related to the sale of the Honduras business and $66 million related to a transfer of a real estate loan portfolio to HFS. These amounts are partially offset by FX translation on the entire allowance balance. |
(5) |
The first quarter of 2014 includes a reduction of approximately $79 million related to the sale or transfer to HFS of various loan portfolios. |
(6) |
The fourth quarter of 2013 includes a reduction of approximately $113 million related to the sale or transfer to HFS of various loan portfolios. Additionally, there was a reduction of $230 million related to a non-provision transfer of reserves associated with deferred interest to other assets which include deferred interest. |
(7) |
The third quarter of 2013 includes a reduction of approximately $214 million related to the sale or transfer to HFS of various loan portfolios. |
(8) |
September 30, 2014, June 30, 2014, December 31, 2013, June 30, 2013 and September 30, 2013 exclude $4.4 billion, $4.8 billion, $5.7 billion, $5.0 billion and $5.2 billion, respectively, of loans which are carried at fair value.
|
(9) |
Represents additional credit loss reserves for unfunded lending commitments and letters of credit recorded in Other liabilities on the Consolidated Balance Sheet.
|
(10) |
Allowance for loan losses represents management’s best estimate of probable losses inherent in the portfolio, as well as probable losses related to large individually evaluated impaired loans and troubled debt restructurings. See “Significant Accounting Policies and Significant Estimates” and Note 1 to the Consolidated Financial Statements in Citi’s 2013 Annual Report on Form 10-K. Attribution of the allowance is made for analytical purposes only and the entire allowance is available to absorb probable credit losses inherent in the overall portfolio. |
September 30, 2014 |
||||||||
In billions of dollars |
Allowance for
loan losses
|
Loans, net of
unearned income
|
Allowance as a
percentage of loans(1)
|
|||||
North America cards(2)
|
$ |
5.2 |
$ |
109.5 |
4.7 |
% |
||
North America mortgages(3)(4)
|
4.2 |
101.0 |
4.1 |
|||||
North America other
|
1.1 |
21.5 |
5.3 |
|||||
International cards |
2.0 |
32.4 |
6.2 |
|||||
International other(5)
|
2.1 |
111.9 |
1.9 |
|||||
Total Consumer |
$ |
14.6 |
$ |
376.3 |
3.9 |
% |
||
Total Corporate |
2.3 |
277.5 |
0.9 |
|||||
Total Citigroup |
$ |
16.9 |
$ |
653.8 |
2.6 |
% |
||
(1) |
Allowance as a percentage of loans excludes loans that are carried at fair value. |
(2) |
Includes both Citi-branded cards and Citi retail services. The $5.2 billion of loan loss reserves represented approximately 16 months of coincident net credit loss coverage. |
(3) |
Of the $4.2 billion, approximately $4.0 billion was allocated to North America mortgages in Citi Holdings. The $4.2 billion of loan loss reserves represented approximately 52 months of coincident net credit loss coverage (for both total North America mortgages and Citi Holdings North America mortgages).
|
(4) |
Of the $4.2 billion in loan loss reserves, approximately $1.6 billion and $2.6 billion are determined in accordance with ASC 450-20 and ASC 310-10-35 (troubled debt restructurings), respectively. Of the $101.0 billion in loans, approximately $83.8 billion and $16.9 billion of the loans are evaluated in accordance with ASC 450-20 and ASC 310-10-35 (troubled debt restructurings), respectively. For additional information, see Note 15 to the Consolidated Financial Statements. |
(5) |
Includes mortgages and other retail loans. |
December 31, 2013 |
||||||||
In billions of dollars |
Allowance for
loan losses
|
Loans, net of
unearned income
|
Allowance as a
percentage of loans(1)
|
|||||
North America cards(2)
|
$ |
6.2 |
$ |
116.8 |
5.3 |
% |
||
North America mortgages(3)(4)
|
5.1 |
107.5 |
4.8 |
|||||
North America other
|
1.2 |
21.9 |
5.4 |
|||||
International cards |
2.3 |
36.2 |
6.5 |
|||||
International other(5)
|
2.2 |
111.4 |
2.0 |
|||||
Total Consumer |
$ |
17.0 |
$ |
393.8 |
4.3 |
% |
||
Total Corporate |
2.6 |
271.7 |
1.0 |
|||||
Total Citigroup |
$ |
19.6 |
$ |
665.5 |
3.0 |
% |
||
(1) |
Allowance as a percentage of loans excludes loans that are carried at fair value. |
(2) |
Includes both Citi-branded cards and Citi retail services. The $6.2 billion of loan loss reserves represented approximately 18 months of coincident net credit loss coverage. |
(3) |
Of the $5.1 billion, approximately $4.9 billion was allocated to North America mortgages in Citi Holdings. The $5.1 billion of loan loss reserves represented approximately 26 months of coincident net credit loss coverage (for both total North America mortgages and Citi Holdings North America mortgages).
|
(4) |
Of the $5.1 billion in loan loss reserves, approximately $2.4 billion and $2.7 billion are determined in accordance with ASC 450-20 and ASC 310-10-35 (troubled debt restructurings), respectively. Of the $107.5 billion in loans, approximately $88.6 billion and $18.5 billion of the loans are evaluated in accordance with ASC 450-20 and ASC 310-10-35 (troubled debt restructurings), respectively. For additional information, see Note 15 to the Consolidated Financial Statements. |
(5) |
Includes mortgages and other retail loans. |
• |
Corporate and consumer (commercial market) non-accrual status is based on the determination that payment of interest or principal is doubtful. |
• |
Consumer non-accrual status is generally based on aging, i.e., the borrower has fallen behind in payments. |
• |
Mortgage loans discharged through Chapter 7 bankruptcy, other than Federal Housing Administration (FHA)-insured loans, are classified as non-accrual. In addition, home equity loans in regulated bank entities are classified as non-accrual if the related residential first mortgage loan is 90 days or more past due. |
• |
North America Citi-branded cards and Citi retail services are not included because under industry standards, credit card loans accrue interest until such loans are charged off, which typically occurs at 180 days contractual delinquency.
|
• |
Includes both corporate and consumer loans whose terms have been modified in a troubled debt restructuring (TDR). |
• |
Includes both accrual and non-accrual TDRs. |
Sept. 30, |
Jun. 30, |
Mar. 31, |
Dec. 31, |
Sept. 30, |
|||||||||||
In millions of dollars |
2014 |
2014 |
2014 |
2013 |
2013 |
||||||||||
Citicorp |
$ |
3,413 |
$ |
3,280 |
$ |
3,752 |
$ |
3,791 |
$ |
4,053 |
|||||
Citi Holdings |
4,209 |
4,654 |
4,896 |
5,212 |
5,365 |
||||||||||
Total non-accrual loans |
$ |
7,622 |
$ |
7,934 |
$ |
8,648 |
$ |
9,003 |
$ |
9,418 |
|||||
Corporate non-accrual loans(1)
|
|||||||||||||||
North America |
$ |
365 |
$ |
367 |
$ |
689 |
$ |
736 |
$ |
807 |
|||||
EMEA |
322 |
363 |
461 |
766 |
975 |
||||||||||
Latin America |
481 |
288 |
186 |
127 |
124 |
||||||||||
Asia |
182 |
200 |
284 |
279 |
272 |
||||||||||
Total Corporate non-accrual loans |
$ |
1,350 |
$ |
1,218 |
$ |
1,620 |
$ |
1,908 |
$ |
2,178 |
|||||
Citicorp |
$ |
1,290 |
$ |
1,150 |
$ |
1,528 |
$ |
1,580 |
$ |
1,807 |
|||||
Citi Holdings |
60 |
68 |
92 |
328 |
371 |
||||||||||
Total Corporate non-accrual loans |
$ |
1,350 |
$ |
1,218 |
$ |
1,620 |
$ |
1,908 |
$ |
2,178 |
|||||
Consumer non-accrual loans(1)
|
|||||||||||||||
North America |
$ |
4,546 |
$ |
4,915 |
$ |
5,139 |
$ |
5,238 |
$ |
5,345 |
|||||
EMEA |
37 |
101 |
131 |
138 |
147 |
||||||||||
Latin America |
1,364 |
1,386 |
1,466 |
1,426 |
1,400 |
||||||||||
Asia |
325 |
314 |
292 |
293 |
348 |
||||||||||
Total Consumer non-accrual loans |
$ |
6,272 |
$ |
6,716 |
$ |
7,028 |
$ |
7,095 |
$ |
7,240 |
|||||
Citicorp |
$ |
2,123 |
$ |
2,130 |
$ |
2,224 |
$ |
2,211 |
$ |
2,246 |
|||||
Citi Holdings |
4,149 |
4,586 |
4,804 |
4,884 |
4,994 |
||||||||||
Total Consumer non-accrual loans
|
$ |
6,272 |
$ |
6,716 |
$ |
7,028 |
$ |
7,095 |
$ |
7,240 |
|||||
(1) |
Excludes purchased distressed loans, as they are generally accreting interest. The carrying value of these loans was $493 million at September 30, 2014, $575 million at June 30, 2014, $632 million at March 31, 2014, $703 million at December 31, 2013, and $756 million at September 30, 2013.
|
Sept. 30, |
Jun. 30, |
Mar. 31, |
Dec. 31, |
Sept. 30, |
|||||||||||
In millions of dollars |
2014 |
2014 |
2014 |
2013 |
2013 |
||||||||||
OREO |
|||||||||||||||
Citicorp |
$ |
90 |
$ |
100 |
$ |
98 |
$ |
79 |
$ |
69 |
|||||
Citi Holdings |
292 |
302 |
311 |
338 |
334 |
||||||||||
Total OREO |
$ |
382 |
$ |
402 |
$ |
409 |
$ |
417 |
$ |
403 |
|||||
North America |
$ |
303 |
$ |
294 |
$ |
304 |
$ |
305 |
$ |
293 |
|||||
EMEA |
18 |
44 |
50 |
59 |
62 |
||||||||||
Latin America |
49 |
49 |
50 |
47 |
40 |
||||||||||
Asia |
12 |
15 |
5 |
6 |
8 |
||||||||||
Total OREO |
$ |
382 |
$ |
402 |
$ |
409 |
$ |
417 |
$ |
403 |
|||||
Other repossessed assets |
$ |
— |
$ |
— |
$ |
— |
$ |
— |
$ |
— |
|||||
Non-accrual assets—Total Citigroup
|
|||||||||||||||
Corporate non-accrual loans |
$ |
1,350 |
$ |
1,218 |
$ |
1,620 |
$ |
1,908 |
$ |
2,178 |
|||||
Consumer non-accrual loans |
6,272 |
6,716 |
7,028 |
7,095 |
7,240 |
||||||||||
Non-accrual loans (NAL) |
$ |
7,622 |
$ |
7,934 |
$ |
8,648 |
$ |
9,003 |
$ |
9,418 |
|||||
OREO |
382 |
402 |
409 |
417 |
403 |
||||||||||
Other repossessed assets |
— |
— |
— |
— |
— |
||||||||||
Non-accrual assets (NAA) |
$ |
8,004 |
$ |
8,336 |
$ |
9,057 |
$ |
9,420 |
$ |
9,821 |
|||||
NAL as a percentage of total loans |
1.17 |
% |
1.19 |
% |
1.30 |
% |
1.35 |
% |
1.43 |
% |
|||||
NAA as a percentage of total assets |
0.43 |
0.44 |
0.48 |
0.50 |
0.52 |
||||||||||
Allowance for loan losses as a percentage of NAL(1)
|
222 |
% |
225 |
% |
219 |
% |
218 |
% |
219 |
% |
|||||
Sept. 30, |
Jun. 30, |
Mar. 31, |
Dec. 31, |
Sept. 30, |
|||||||||||
Non-accrual assets—Total Citicorp |
2014 |
2014 |
2014 |
2013 |
2013 |
||||||||||
Non-accrual loans (NAL) |
$ |
3,413 |
$ |
3,280 |
$ |
3,752 |
$ |
3,791 |
$ |
4,053 |
|||||
OREO |
90 |
100 |
98 |
79 |
69 |
||||||||||
Other repossessed assets |
— |
— |
— |
— |
— |
||||||||||
Non-accrual assets (NAA) |
$ |
3,503 |
$ |
3,380 |
$ |
3,850 |
$ |
3,870 |
$ |
4,122 |
|||||
NAA as a percentage of total assets |
0.20 |
% |
0.19 |
% |
0.22 |
% |
0.22 |
% |
0.23 |
% |
|||||
Allowance for loan losses as a percentage of NAL(1)
|
349 |
380 |
343 |
348 |
328 |
||||||||||
Non-accrual assets—Total Citi Holdings |
|||||||||||||||
Non-accrual loans (NAL) |
$ |
4,209 |
$ |
4,654 |
$ |
4,896 |
$ |
5,212 |
$ |
5,365 |
|||||
OREO |
292 |
302 |
311 |
338 |
334 |
||||||||||
Other repossessed assets |
— |
— |
— |
— |
— |
||||||||||
Non-accrual assets (NAA) |
$ |
4,501 |
$ |
4,956 |
$ |
5,207 |
$ |
5,550 |
$ |
5,699 |
|||||
NAA as a percentage of total assets |
4.37 |
% |
4.46 |
% |
4.57 |
% |
4.74 |
% |
4.67 |
% |
|||||
Allowance for loan losses as a percentage of NAL(1)
|
119 |
116 |
124 |
124 |
136 |
||||||||||
(1) |
The allowance for loan losses includes the allowance for Citi’s credit card portfolios and purchased distressed loans, while the non-accrual loans exclude credit card balances (with the exception of certain international portfolios) and purchased distressed loans as these continue to accrue interest until charge-off. |
In millions of dollars |
Sept. 30, 2014 |
Dec. 31, 2013 |
||||
Corporate renegotiated loans(1)
|
||||||
In U.S. offices |
||||||
Commercial and industrial(2)
|
$ |
18 |
$ |
36 |
||
Mortgage and real estate(3)
|
125 |
143 |
||||
Loans to financial institutions |
— |
14 |
||||
Other |
326 |
364 |
||||
$ |
469 |
$ |
557 |
|||
In offices outside the U.S. |
||||||
Commercial and industrial(2)
|
$ |
143 |
$ |
161 |
||
Mortgage and real estate(3)
|
— |
18 |
||||
Other |
— |
58 |
||||
$ |
143 |
$ |
237 |
|||
Total Corporate renegotiated loans |
$ |
612 |
$ |
794 |
||
Consumer renegotiated loans(4)(5)(6)(7)
|
||||||
In U.S. offices |
||||||
Mortgage and real estate (8)
|
$ |
17,224 |
$ |
18,922 |
||
Cards |
1,875 |
2,510 |
||||
Installment and other |
573 |
626 |
||||
$ |
19,672 |
$ |
22,058 |
|||
In offices outside the U.S. |
||||||
Mortgage and real estate |
$ |
644 |
$ |
641 |
||
Cards |
709 |
830 |
||||
Installment and other |
704 |
834 |
||||
$ |
2,057 |
$ |
2,305 |
|||
Total Consumer renegotiated loans |
$ |
21,729 |
$ |
24,363 |
||
(1) |
Includes $167 million and $312 million of non-accrual loans included in the non-accrual assets table above at September 30, 2014 and December 31, 2013, respectively. The remaining loans are accruing interest.
|
(2) |
In addition to modifications reflected as TDRs at September 30, 2014, Citi also modified $15 million and $79 million of commercial loans risk rated “Substandard Non-Performing” or worse (asset category defined by banking regulators) in offices inside and outside the U.S., respectively. These modifications were not considered TDRs because the modifications did not involve a concession (a required element of a TDR for accounting purposes).
|
(3) |
In addition to modifications reflected as TDRs at September 30, 2014, Citi also modified $22 million of commercial real estate loans risk rated “Substandard Non-Performing” or worse (asset category defined by banking regulators) in offices inside the U.S. These modifications were not considered TDRs because the modifications did not involve a concession (a required element of a TDR for accounting purposes).
|
(4) |
Includes $3,239 million and $3,637 million of non-accrual loans included in the non-accrual assets table above at September 30, 2014 and December 31, 2013, respectively. The remaining loans are accruing interest.
|
(5) |
Includes $49 million and $29 million of commercial real estate loans at September 30, 2014 and December 31, 2013, respectively.
|
(6) |
Includes $270 million and $295 million of other commercial loans at September 30, 2014 and December 31, 2013, respectively.
|
(7) |
Smaller-balance homogeneous loans were derived from Citi’s risk management systems. |
(8) |
Reduction in the third quarter of 2014 includes $1,325 million related to TDRs sold or transferred to held-for-sale. |
|
North America Residential First Mortgage - EOP Loans
In billions of dollars
|

|
North America Residential First Mortgage - Net Credit Losses(1)
In millions of dollars
|

(1) |
Includes the following charge-offs related to Citi’s fulfillment of its obligations under the national mortgage and independent foreclosure review settlements: 3Q’13, $8 million; and 4Q’13, $6 million. For further information, see “Managed Global Risk-Credit Risk-National Mortgage Settlement and Independent Foreclosure Review Settlement” |
(2) |
4Q’13 excludes approximately $84 million of net credit losses consisting of (i) approximately $69 million of charge-offs related to a change in the charge-off policy for mortgages originated in CitiFinancial to more closely align to policies used in the CitiMortgage business, and (ii) approximately $15 million of charge-offs related to a change in the estimate of net credit losses related to collateral dependent loans to borrowers that have gone through Chapter 7 bankruptcy. |
(3) |
2Q’14 excludes a recovery of approximately $58 million in CitiMortgage. |
(4) |
Year-over-year change in the S&P/Case-Shiller U.S. National Home Price Index. |
(5) |
Year-over-year change as of July 2014. |
|
North America Residential First Mortgage Delinquencies-Citi Holdings
In billions of dollars
|

In billions of dollars |
September 30, 2014 |
June 30, 2014 |
||||||||||||||||||||
State (1)
|
ENR (2)
|
ENR
Distribution
|
90+DPD
%
|
%
LTV >
100%
|
Refreshed
FICO
|
ENR (2)
|
ENR
Distribution
|
90+DPD
%
|
%
LTV >
100%
|
Refreshed
FICO
|
||||||||||||
CA |
$ |
19.2 |
30 |
% |
0.7 |
% |
2 |
% |
744 |
$ |
19.3 |
30 |
% |
1.0 |
% |
2 |
% |
741 |
||||
NY/NJ/CT(3)(4)
|
12.6 |
20 |
2.1 |
2 |
739 |
12.2 |
19 |
2.6 |
3 |
737 |
||||||||||||
FL(3)
|
3.0 |
5 |
3.3 |
15 |
697 |
3.0 |
5 |
4.3 |
18 |
692 |
||||||||||||
IN/OH/MI(3)
|
2.8 |
4 |
3.0 |
12 |
667 |
2.9 |
5 |
4.2 |
18 |
663 |
||||||||||||
IL(3)
|
2.7 |
4 |
2.8 |
8 |
712 |
2.7 |
4 |
3.4 |
14 |
709 |
||||||||||||
AZ/NV |
1.4 |
2 |
2.2 |
18 |
714 |
1.4 |
2 |
2.7 |
21 |
711 |
||||||||||||
Other |
21.5 |
35 |
3.4 |
5 |
679 |
22.4 |
35 |
4.1 |
7 |
675 |
||||||||||||
Total |
$ |
63.2 |
100 |
% |
2.2 |
% |
5 |
% |
713 |
$ |
63.9 |
100 |
% |
2.8 |
% |
6 |
% |
709 |
||||
(1) |
Certain of the states are included as part of a region based on Citi’s view of similar HPI within the region. |
(2) |
Ending net receivables. Excludes loans in Canada and Puerto Rico, loans guaranteed by U.S. government agencies, loans recorded at fair value and loans subject to LTSCs. Excludes balances for which FICO or LTV data are unavailable. |
(3) |
New York, New Jersey, Connecticut, Indiana, Ohio, Florida and Illinois are judicial states. |
(4) |
Increase in ENR was due to originations in Citicorp. |
|
North America Home Equity Lines of Credit Amortization – Citigroup
Total ENR by Reset Year
In billions of dollars as of September 30, 2014
|

|
North America Home Equity - EOP Loans
In billions of dollars
|

|
North America Home Equity - Net Credit Losses(1)
In millions of dollars
|
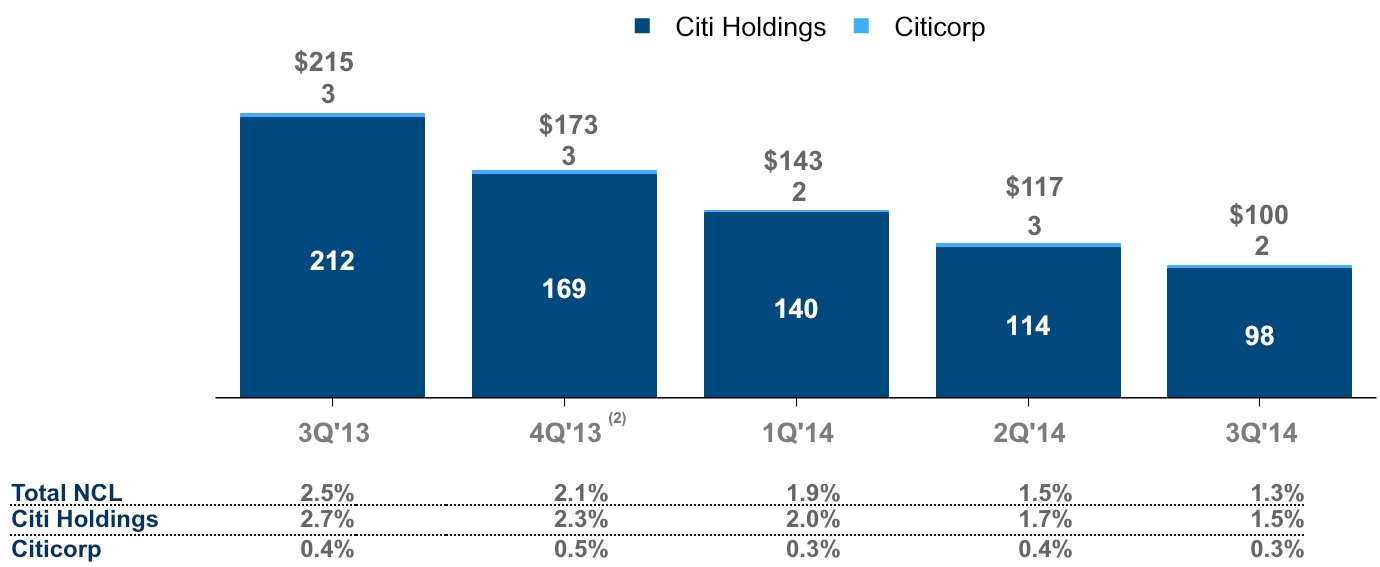
(1) |
Includes the following amounts of charge-offs related to Citi’s fulfillment of its obligations under the national mortgage and independent foreclosure review settlements: 3Q’13, $14 million; and 4Q’13, $15 million. For further information, see “Managed Global Risk-Credit Risk-National Mortgage Settlement and Independent Foreclosure Review Settlement” in Citi’s 2013 Annual Report on Form 10-K and Citi’s First Quarter of 2014 Form 10-Q. |
(2) |
4Q’13 excludes approximately $100 million of net credit losses consisting of (i) approximately $64 million for the acceleration of |
|
North America Home Equity Loan Delinquencies - Citi Holdings
In billions of dollars
|
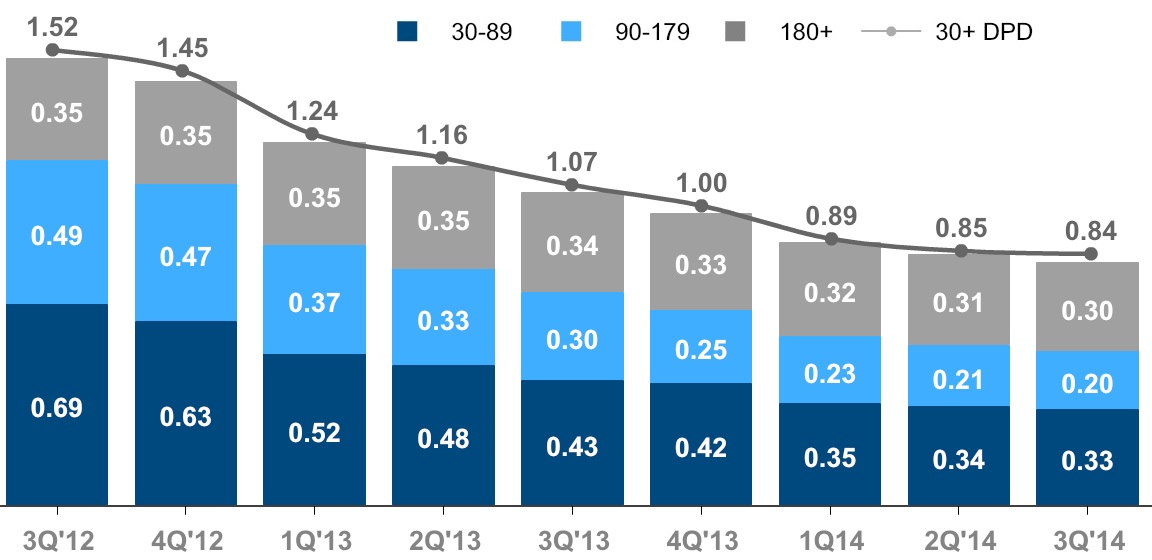
In billions of dollars |
September 30, 2014 |
June 30, 2014 |
||||||||||||||||||||
State (1)
|
ENR (2)
|
ENR
Distribution
|
90+DPD
%
|
%
CLTV >
100% (3)
|
Refreshed
FICO
|
ENR (2)
|
ENR
Distribution
|
90+DPD
%
|
%
CLTV >
100% (3)
|
Refreshed
FICO
|
||||||||||||
CA |
$ |
7.6 |
28 |
% |
1.4 |
% |
10 |
% |
728 |
$ |
7.8 |
28 |
% |
1.4 |
% |
12 |
% |
727 |
||||
NY/NJ/CT(4)
|
6.8 |
25 |
2.4 |
11 |
721 |
7.0 |
25 |
2.3 |
14 |
719 |
||||||||||||
FL(4)
|
1.9 |
7 |
2.2 |
35 |
707 |
1.9 |
7 |
2.2 |
38 |
706 |
||||||||||||
IL(4)
|
1.1 |
4 |
1.5 |
33 |
716 |
1.2 |
4 |
1.3 |
42 |
715 |
||||||||||||
IN/OH/MI(4)
|
0.9 |
3 |
1.5 |
34 |
688 |
0.9 |
3 |
1.5 |
48 |
688 |
||||||||||||
AZ/NV |
0.6 |
2 |
1.9 |
46 |
717 |
0.7 |
2 |
2.1 |
49 |
714 |
||||||||||||
Other |
8.5 |
31 |
1.7 |
17 |
702 |
8.7 |
31 |
1.7 |
23 |
701 |
||||||||||||
Total |
$ |
27.4 |
100 |
% |
1.8 |
% |
17 |
% |
715 |
$ |
28.2 |
100 |
% |
1.8 |
% |
21 |
% |
714 |
||||
(1) |
Certain of the states are included as part of a region based on Citi’s view of similar HPI within the region. |
(2) |
Ending net receivables. Excludes loans in Canada and Puerto Rico and loans subject to LTSCs. Excludes balances for which FICO or LTV data are unavailable. |
(3) |
Represents combined loan-to-value (CLTV) for both residential first mortgages and home equity loans. |
(4) |
New York, New Jersey, Connecticut, Indiana, Ohio, Florida and Illinois are judicial states. |
|
Total
loans(1)
|
90+ days past due(2)
|
30-89 days past due(2)
|
|||||||||||||||||||
In millions of dollars, except EOP loan amounts in billions |
September 30, 2014 |
September 30, 2014 |
June 30, 2014 |
September 30, 2013 |
September 30, 2014 |
June 30, 2014 |
September 30, 2013 |
||||||||||||||
Citicorp(3)(4)
|
|||||||||||||||||||||
Total |
$ |
299.1 |
$ |
2,754 |
$ |
2,805 |
$ |
2,699 |
$ |
2,949 |
$ |
2,972 |
$ |
3,215 |
|||||||
Ratio |
0.92 |
% |
0.93 |
% |
0.93 |
% |
0.99 |
% |
0.99 |
% |
1.10 |
% |
|||||||||
Retail banking |
|||||||||||||||||||||
Total |
$ |
157.2 |
$ |
990 |
$ |
1,015 |
$ |
872 |
$ |
969 |
$ |
1,032 |
$ |
1,109 |
|||||||
Ratio |
0.63 |
% |
0.64 |
% |
0.59 |
% |
0.62 |
% |
0.66 |
% |
0.76 |
% |
|||||||||
North America |
47.5 |
229 |
227 |
277 |
213 |
203 |
209 |
||||||||||||||
Ratio |
0.49 |
% |
0.50 |
% |
0.66 |
% |
0.46 |
% |
0.45 |
% |
0.50 |
% |
|||||||||
EMEA |
5.7 |
21 |
26 |
38 |
50 |
50 |
57 |
||||||||||||||
Ratio |
0.37 |
% |
0.43 |
% |
0.69 |
% |
0.88 |
% |
0.83 |
% |
1.04 |
% |
|||||||||
Latin America |
29.8 |
527 |
552 |
347 |
329 |
373 |
445 |
||||||||||||||
Ratio |
1.77 |
% |
1.79 |
% |
1.20 |
% |
1.10 |
% |
1.21 |
% |
1.53 |
% |
|||||||||
Asia |
74.2 |
213 |
210 |
210 |
377 |
406 |
398 |
||||||||||||||
Ratio |
0.29 |
% |
0.28 |
% |
0.30 |
% |
0.51 |
% |
0.54 |
% |
0.57 |
% |
|||||||||
Cards |
|||||||||||||||||||||
Total |
$ |
141.9 |
$ |
1,764 |
$ |
1,790 |
$ |
1,827 |
$ |
1,980 |
$ |
1,940 |
$ |
2,106 |
|||||||
Ratio |
1.24 |
% |
1.24 |
% |
1.26 |
% |
1.40 |
% |
1.35 |
% |
1.46 |
% |
|||||||||
North America—Citi-branded |
66.5 |
559 |
583 |
628 |
566 |
540 |
650 |
||||||||||||||
Ratio |
0.84 |
% |
0.87 |
% |
0.91 |
% |
0.85 |
% |
0.80 |
% |
0.94 |
% |
|||||||||
North America—Citi retail services |
43.0 |
630 |
606 |
650 |
729 |
683 |
799 |
||||||||||||||
Ratio |
1.47 |
% |
1.41 |
% |
1.51 |
% |
1.70 |
% |
1.58 |
% |
1.86 |
% |
|||||||||
EMEA |
2.4 |
33 |
31 |
34 |
40 |
40 |
44 |
||||||||||||||
Ratio |
1.38 |
% |
1.24 |
% |
1.42 |
% |
1.67 |
% |
1.60 |
% |
1.83 |
% |
|||||||||
Latin America |
11.5 |
354 |
364 |
326 |
389 |
396 |
346 |
||||||||||||||
Ratio |
3.08 |
% |
3.11 |
% |
2.76 |
% |
3.38 |
% |
3.38 |
% |
2.93 |
% |
|||||||||
Asia |
18.5 |
188 |
206 |
189 |
256 |
281 |
267 |
||||||||||||||
Ratio |
1.02 |
% |
1.07 |
% |
1.01 |
% |
1.38 |
% |
1.46 |
% |
1.43 |
% |
|||||||||
Citi Holdings(5)(6)
|
|||||||||||||||||||||
Total |
$ |
76.9 |
$ |
2,104 |
$ |
2,536 |
$ |
2,969 |
$ |
2,013 |
$ |
2,260 |
$ |
2,845 |
|||||||
Ratio |
2.93 |
% |
3.32 |
% |
3.42 |
% |
2.80 |
% |
2.96 |
% |
3.28 |
% |
|||||||||
International |
2.0 |
11 |
66 |
177 |
35 |
86 |
184 |
||||||||||||||
Ratio |
0.55 |
% |
2.13 |
% |
2.95 |
% |
1.75 |
% |
2.77 |
% |
3.07 |
% |
|||||||||
North America |
74.9 |
2,093 |
2,470 |
2,792 |
1,978 |
2,174 |
2,661 |
||||||||||||||
Ratio |
2.99 |
% |
3.37 |
% |
3.46 |
% |
2.83 |
% |
2.97 |
% |
3.30 |
% |
|||||||||
Other (7)
|
0.3 |
||||||||||||||||||||
Total Citigroup |
$ |
376.3 |
$ |
4,858 |
$ |
5,341 |
$ |
5,668 |
$ |
4,962 |
$ |
5,232 |
$ |
6,060 |
|||||||
Ratio |
1.31 |
% |
1.41 |
% |
1.50 |
% |
1.34 |
% |
1.39 |
% |
1.61 |
% |
|||||||||
(1) |
Total loans include interest and fees on credit cards. |
(2) |
The ratios of 90+ days past due and 30-89 days past due are calculated based on end-of-period (EOP) loans, net of unearned income. |
(3) |
The 90+ days past due balances for North America—Citi-branded and North America—Citi retail services are generally still accruing interest. Citigroup’s policy is generally to accrue interest on credit card loans until 180 days past due, unless notification of bankruptcy filing has been received earlier.
|
(4) |
The 90+ days and 30-89 days past due and related ratios for Citicorp North America exclude U.S. mortgage loans that are guaranteed by U.S. government-sponsored entities since the potential loss predominantly resides within the U.S. government-sponsored entities. The amounts excluded for loans 90+ days past due and (EOP loans) were $604 million ($1.1 billion), $668 million ($1.2 billion), and $733 million ($1.3 billion) at September 30, 2014, June 30, 2014 and September 30, 2013, respectively. The amounts excluded for loans 30-89 days past due (EOP loans have the same adjustment as above) were $126 million, $125 million, and $146 million, at September 30, 2014, June 30, 2014 and September 30, 2013, respectively.
|
(5) |
The 90+ days and 30-89 days past due and related ratios for Citi Holdings North America exclude U.S. mortgage loans that are guaranteed by U.S. government-sponsored entities since the potential loss predominantly resides within the U.S. entities. The amounts excluded for loans 90+ days past due (and EOP loans) for each period were $2.6 billion ($5.0 billion), $2.8 billion ($5.2 billion), and $3.4 billion ($6.5 billion) at September 30, 2014, June 30, 2014 and September 30, 2013, respectively. The amounts excluded for loans 30-89 days past due (EOP loans have the same adjustment as above) for each period were $0.7 billion, $0.7 billion, and $1.1 billion, at September 30, 2014, June 30, 2014 and September 30, 2013, respectively.
|
(6) |
The September 30, 2014, June 30, 2014 and September 30, 2013 loans 90+ days past due and 30-89 days past due and related ratios for North America exclude $15 million, $17 million and $1.0 billion, respectively, of loans that are carried at fair value.
|
(7) |
Represents loans classified as Consumer loans on the Consolidated Balance Sheet that are not included in the Citi Holdings consumer credit metrics.
|
|
Average
loans(1)
|
Net credit losses(2)
|
|||||||||||
In millions of dollars, except average loan amounts in billions |
3Q14 |
3Q14 |
2Q14 |
3Q13 |
||||||||
Citicorp |
||||||||||||
Total |
$ |
299.4 |
$ |
1,738 |
$ |
1,781 |
$ |
1,730 |
||||
Ratio |
2.30 |
% |
2.39 |
% |
2.41 |
% |
||||||
Retail banking |
||||||||||||
Total |
$ |
157.7 |
$ |
348 |
$ |
340 |
$ |
336 |
||||
Ratio |
0.88 |
% |
0.87 |
% |
0.91 |
% |
||||||
North America |
46.9 |
34 |
35 |
38 |
||||||||
Ratio |
0.29 |
% |
0.31 |
% |
0.35 |
% |
||||||
EMEA |
5.9 |
14 |
8 |
11 |
||||||||
Ratio |
0.94 |
% |
0.54 |
% |
0.81 |
% |
||||||
Latin America |
30.0 |
222 |
222 |
209 |
||||||||
Ratio |
2.94 |
% |
2.91 |
% |
2.84 |
% |
||||||
Asia |
74.9 |
78 |
75 |
78 |
||||||||
Ratio |
0.41 |
% |
0.40 |
% |
0.45 |
% |
||||||
Cards |
||||||||||||
Total |
$ |
141.7 |
$ |
1,390 |
$ |
1,441 |
$ |
1,394 |
||||
Ratio |
3.89 |
% |
4.07 |
% |
3.99 |
% |
||||||
North America—Citi-branded |
66.1 |
526 |
570 |
610 |
||||||||
Ratio |
3.16 |
% |
3.44 |
% |
3.54 |
% |
||||||
North America—Retail services |
42.9 |
457 |
465 |
435 |
||||||||
Ratio |
4.23 |
% |
4.40 |
% |
4.57 |
% |
||||||
EMEA |
2.4 |
11 |
12 |
10 |
||||||||
Ratio |
1.82 |
% |
2.01 |
% |
1.72 |
% |
||||||
Latin America |
11.5 |
281 |
271 |
225 |
||||||||
Ratio |
9.69 |
% |
9.13 |
% |
7.70 |
% |
||||||
Asia |
18.8 |
115 |
123 |
114 |
||||||||
Ratio |
2.43 |
% |
2.61 |
% |
2.46 |
% |
||||||
Citi Holdings |
||||||||||||
Total |
$ |
79.6 |
$ |
375 |
$ |
395 |
$ |
602 |
||||
Ratio |
1.87 |
% |
1.83 |
% |
2.47 |
% |
||||||
International |
2.5 |
6 |
39 |
46 |
||||||||
Ratio |
0.95 |
% |
2.79 |
% |
2.99 |
% |
||||||
North America |
77.1 |
369 |
356 |
556 |
||||||||
Ratio |
1.90 |
% |
1.77 |
% |
2.43 |
% |
||||||
Other (3)
|
— |
2 |
2 |
2 |
||||||||
Total Citigroup |
$ |
379.0 |
$ |
2,115 |
$ |
2,178 |
$ |
2,334 |
||||
Ratio |
2.21 |
% |
2.27 |
% |
2.42 |
% |
||||||
(1) |
Average loans include interest and fees on credit cards. |
(2) |
The ratios of net credit losses are calculated based on average loans, net of unearned income. |
(3) |
Represents NCLs on loans classified as Consumer loans on the Consolidated Balance Sheet that are not included in the Citi Holdings consumer credit metrics.
|
At September 30, 2014 |
At December 31, 2013 |
|||||||||||||||||||||||
In billions of dollars |
Due
within
1 year
|
Greater
than 1 year
but within
5 years
|
Greater
than
5 years
|
Total
Exposure
|
Due
within
1 year
|
Greater
than 1 year
but within
5 years
|
Greater
than
5 years
|
Total
exposure
|
||||||||||||||||
Direct outstandings |
$ |
103 |
$ |
80 |
$ |
32 |
$ |
215 |
$ |
108 |
$ |
80 |
$ |
29 |
$ |
217 |
||||||||
Unfunded lending commitments |
102 |
212 |
32 |
346 |
87 |
204 |
21 |
312 |
||||||||||||||||
Total |
$ |
205 |
$ |
292 |
$ |
64 |
$ |
561 |
$ |
195 |
$ |
284 |
$ |
50 |
$ |
529 |
||||||||
September 30, 2014 |
December 31, 2013 |
|||
North America |
53 |
% |
51 |
% |
EMEA |
26 |
27 |
||
Asia |
14 |
14 |
||
Latin America |
7 |
8 |
||
Total |
100 |
% |
100 |
% |
|
Direct outstandings and
unfunded lending commitments
|
||||
September 30, 2014 |
December 31, 2013 |
|||
AAA/AA/A |
47 |
% |
52 |
% |
BBB |
32 |
30 |
||
BB/B |
18 |
16 |
||
CCC or below |
2 |
2 |
||
Unrated |
1 |
— |
||
Total |
100 |
% |
100 |
% |
|
Direct outstandings and
unfunded lending commitments
|
||||
September 30, 2014 |
December 31, 2013 |
|||
Transportation and industrial |
21 |
% |
22 |
% |
Petroleum, energy, chemical and metal |
21 |
20 |
||
Consumer retail and health |
17 |
15 |
||
Banks/broker-dealers |
10 |
10 |
||
Technology, media and telecom |
8 |
10 |
||
Public sector |
6 |
6 |
||
Insurance and special purpose entities |
5 |
5 |
||
Real estate |
5 |
5 |
||
Hedge funds |
5 |
4 |
||
Other industries |
2 |
3 |
||
Total |
100 |
% |
100 |
% |
September 30, 2014 |
December 31, 2013 |
|||
AAA/AA/A |
27 |
% |
26 |
% |
BBB |
38 |
36 |
||
BB/B |
28 |
29 |
||
CCC or below |
7 |
9 |
||
Total |
100 |
% |
100 |
% |
September 30, 2014 |
December 31, 2013 |
|||
Transportation and industrial |
30 |
% |
31 |
% |
Petroleum, energy, chemical and metal |
23 |
23 |
||
Technology, media and telecom |
15 |
14 |
||
Consumer retail and health |
11 |
9 |
||
Banks/broker-dealers |
7 |
8 |
||
Insurance and special purpose entities |
6 |
7 |
||
Public Sector |
5 |
6 |
||
Other industries |
3 |
2 |
||
Total |
100 |
% |
100 |
% |
• |
the parent entity, which includes the parent holding company (Citigroup) and Citi’s broker-dealer subsidiaries that are consolidated into Citigroup (collectively referred to in this section as “parent”); |
• |
Citi’s significant Citibank entities, which consist of Citibank, N.A. units domiciled in the U.S., Western |
• |
other Citibank and Banamex entities. |
September 30, 2014 |
||||||||||||
In billions of dollars |
Parent |
Significant Citibank Entities |
Other Citibank and Banamex Entities |
Total |
||||||||
Available cash |
$ |
27.3 |
$ |
77.8 |
$ |
8.5 |
$ |
113.6 |
||||
Unencumbered liquid securities |
31.8 |
197.5 |
73.6 |
$ |
302.9 |
|||||||
Total |
$ |
59.1 |
$ |
275.3 |
$ |
82.1 |
$ |
416.4 |
||||
In billions of dollars |
Sept. 30, 2014 |
||
Available cash |
$ |
113.6 |
|
U.S. Treasuries |
117.1 |
||
U.S. Agencies/Agency MBS |
60.7 |
||
Foreign government(1)
|
121.6 |
||
Other investment grade |
3.4 |
||
Total |
$ |
416.4 |
|
(1) |
Foreign government includes securities issued or guaranteed by foreign sovereigns, agencies and multilateral development banks. Foreign government securities are held largely to support local liquidity requirements and Citi’s local franchises and principally included government bonds from Brazil, China, Hong Kong, Japan, Korea, Poland, Singapore and Taiwan. |
In billions of dollars |
Sept. 30, 2014 |
Jun. 30, 2014 |
Sept. 30, 2013 |
||||||
Global Consumer Banking |
|||||||||
North America |
$ |
171.7 |
$ |
170.6 |
$ |
168.6 |
|||
EMEA |
13.0 |
13.8 |
12.5 |
||||||
Latin America |
45.9 |
48.3 |
46.6 |
||||||
Asia |
101.3 |
105.0 |
101.6 |
||||||
Total |
$ |
331.9 |
$ |
337.7 |
$ |
329.3 |
|||
ICG |
|||||||||
North America |
$ |
180.5 |
$ |
182.5 |
$ |
173.2 |
|||
EMEA |
179.8 |
185.1 |
181.1 |
||||||
Latin America |
62.4 |
64.6 |
62.8 |
||||||
Asia |
144.7 |
145.0 |
149.2 |
||||||
Total |
$ |
567.4 |
$ |
577.2 |
$ |
566.3 |
|||
Corporate/Other |
29.0 |
31.3 |
18.1 |
||||||
Total Citicorp |
$ |
928.3 |
$ |
946.2 |
$ |
913.7 |
|||
Total Citi Holdings(1)
|
14.4 |
19.5 |
41.8 |
||||||
Total Citigroup Deposits (EOP) |
$ |
942.7 |
$ |
965.7 |
$ |
955.5 |
|||
Total Citigroup Deposits (AVG) |
$ |
954.2 |
$ |
959.5 |
$ |
922.1 |
|||
(1) |
Included within Citi’s end-of-period deposit balance as of September 30, 2014 were approximately $13 billion of deposits related to Morgan Stanley Smith Barney (MSSB) customers that, as previously disclosed, will be transferred to Morgan Stanley by MSSB, with remaining balances transferred in the amount of approximately $5 billion per quarter through the end of the second quarter of 2015.
|
In billions of dollars |
Sept. 30, 2014 |
Jun. 30, 2014 |
Sept. 30, 2013 |
||||||
Parent |
$ |
155.9 |
$ |
163.0 |
$ |
168.6 |
|||
Benchmark Debt: |
|||||||||
Senior debt |
96.3 |
97.8 |
100.4 |
||||||
Subordinated debt |
24.2 |
28.1 |
28.0 |
||||||
Trust preferred |
1.7 |
1.8 |
4.3 |
||||||
Customer-Related Debt: |
|||||||||
Structured debt |
22.3 |
22.5 |
22.0 |
||||||
Non-structured debt |
6.4 |
8.0 |
9.2 |
||||||
Local Country and Other(1)(2)
|
5.0 |
4.8 |
4.7 |
||||||
Bank |
$ |
67.9 |
$ |
64.0 |
$ |
53.0 |
|||
FHLB Borrowings |
23.3 |
19.1 |
14.3 |
||||||
Securitizations(3)
|
38.2 |
38.1 |
30.3 |
||||||
Local Country and Other(2)
|
6.4 |
6.8 |
8.4 |
||||||
Total long-term debt |
$ |
223.8 |
$ |
227.0 |
$ |
221.6 |
|||
(1) |
Includes securitizations of $2.0 billion for the third quarter of 2014, $0.9 billion for the second quarter of 2014, and $0.2 billion for the third quarter of 2013.
|
(2) |
Local country debt includes debt issued by Citi’s affiliates in support of their local operations. |
(3) |
Of the bank securitizations at September 30, 2014, approximately $38.0 billion related to credit card securitizations (compared to $37.8 billion as of June 30, 2014).
|
3Q14 |
2Q14 |
3Q13 |
||||||||||||||||
In billions of dollars |
Maturities |
Issuances |
Maturities |
Issuances |
Maturities |
Issuances |
||||||||||||
Parent |
$ |
11.5 |
$ |
9.8 |
$ |
11.1 |
$ |
10.0 |
$ |
14.6 |
$ |
10.4 |
||||||
Benchmark Debt: |
||||||||||||||||||
Senior debt |
4.2 |
5.0 |
4.7 |
5.6 |
8.6 |
5.7 |
||||||||||||
Subordinated debt |
4.0 |
0.7 |
1.0 |
1.0 |
— |
2.4 |
||||||||||||
Trust preferred |
— |
— |
2.1 |
— |
3.2 |
— |
||||||||||||
Customer-Related Debt: |
||||||||||||||||||
Structured debt |
2.1 |
2.7 |
2.2 |
2.2 |
1.9 |
2.0 |
||||||||||||
Non-structured debt |
0.9 |
0.1 |
0.3 |
0.4 |
0.9 |
0.3 |
||||||||||||
Local Country and Other |
0.3 |
1.3 |
0.8 |
0.8 |
— |
— |
||||||||||||
Bank |
$ |
4.5 |
$ |
9.0 |
$ |
4.2 |
$ |
8.7 |
$ |
7.9 |
$ |
12.4 |
||||||
FHLB borrowings |
1.0 |
5.3 |
1.0 |
6.1 |
7.0 |
6.8 |
||||||||||||
Securitizations |
2.9 |
3.0 |
1.4 |
2.4 |
0.1 |
4.9 |
||||||||||||
Local Country and Other |
0.6 |
0.7 |
1.8 |
0.2 |
0.8 |
0.7 |
||||||||||||
Total |
$ |
16.0 |
$ |
18.8 |
$ |
15.3 |
$ |
18.7 |
$ |
22.5 |
$ |
22.8 |
||||||
|
Maturities
YTD'14
|
Expected Long-Term Debt Maturities as of September 30, 2014 |
||||||||||||||||||||||||||
In billions of dollars |
2014 |
2015 |
2016 |
2017 |
2018 |
2019 |
Thereafter |
Total |
|||||||||||||||||||
Parent |
$ |
30.3 |
$ |
5.7 |
$ |
17.5 |
$ |
21.9 |
$ |
24.5 |
$ |
13.0 |
$ |
17.6 |
$ |
55.7 |
$ |
155.9 |
|||||||||
Benchmark Debt: |
|||||||||||||||||||||||||||
Senior debt |
13.8 |
4.1 |
10.6 |
15.0 |
18.1 |
9.6 |
13.6 |
25.3 |
96.3 |
||||||||||||||||||
Subordinated debt |
5.0 |
— |
0.7 |
1.5 |
3.2 |
1.2 |
1.5 |
16.1 |
24.2 |
||||||||||||||||||
Trust preferred |
2.1 |
— |
— |
— |
— |
— |
— |
1.7 |
1.7 |
||||||||||||||||||
Customer-Related Debt: |
|||||||||||||||||||||||||||
Structured debt |
5.7 |
0.8 |
3.8 |
4.0 |
2.7 |
1.7 |
1.2 |
8.1 |
22.3 |
||||||||||||||||||
Non-structured debt |
2.0 |
0.3 |
2.0 |
1.0 |
0.5 |
0.4 |
0.3 |
1.9 |
6.4 |
||||||||||||||||||
Local Country and Other |
1.7 |
0.5 |
0.4 |
0.4 |
— |
0.1 |
1.0 |
2.6 |
5.0 |
||||||||||||||||||
Bank |
$ |
10.6 |
$ |
9.6 |
$ |
13.0 |
$ |
18.1 |
$ |
13.0 |
$ |
9.0 |
$ |
1.5 |
$ |
3.7 |
$ |
67.9 |
|||||||||
FHLB borrowings |
2.5 |
5.5 |
3.5 |
7.6 |
6.2 |
0.5 |
— |
— |
23.3 |
||||||||||||||||||
Securitizations |
5.1 |
3.8 |
7.5 |
9.0 |
5.1 |
8.2 |
1.3 |
3.3 |
38.2 |
||||||||||||||||||
Local Country and Other |
3.0 |
0.3 |
2.0 |
1.5 |
1.7 |
0.3 |
0.2 |
0.4 |
6.4 |
||||||||||||||||||
Total long-term debt |
$ |
40.9 |
$ |
15.3 |
$ |
30.5 |
$ |
40.0 |
$ |
37.5 |
$ |
22.0 |
$ |
19.1 |
$ |
59.4 |
$ |
223.8 |
|||||||||
In billions of dollars |
Sept. 30, 2014 |
Jun. 30, 2014 |
Sept. 30, 2013 |
||||||
Commercial paper |
|||||||||
Parent |
$ |
0.2 |
$ |
0.2 |
$ |
0.3 |
|||
Significant Citibank entities |
17.6 |
14.7 |
17.6 |
||||||
Total |
$ |
17.8 |
$ |
14.9 |
$ |
17.9 |
|||
• |
a narrower definition of HQLA, particularly the exclusion of municipal securities, covered bonds and residential mortgage-backed securities as compared to the Basel Committee’s final LCR rules; |
• |
a requirement to calculate and hold additional liquidity against the highest individual day’s mismatch between contractual and certain non-defined maturity inflows and outflows (known as the “peak day” requirement); and |
• |
more stringent definitions regarding deposit classification related to the nature of the deposit balance or counterparty |
in billions of dollars |
Sept. 30, 2014 |
||
High quality liquid assets |
$ |
416.4 |
|
Estimated net outflows |
$ |
374.5 |
|
Liquidity coverage ratio |
111 |
% |
|
HQLA in excess of estimated net outflows |
$ |
42.0 |
|
Citigroup Inc. |
Citibank, N.A. |
|||||
|
Senior
debt
|
Commercial
paper
|
Outlook |
Long-
term
|
Short-
term
|
Outlook |
|
Fitch Ratings (Fitch) |
A |
F1 |
Stable |
A |
F1 |
Stable |
Moody’s Investors Service (Moody’s) |
Baa2 |
P-2 |
Stable |
A2 |
P-1 |
Stable |
Standard & Poor’s (S&P) |
A- |
A-2 |
Negative |
A |
A-1 |
Stable |
In millions of dollars (unless otherwise noted) |
Sept. 30, 2014 |
Jun. 30, 2014 |
Sept. 30, 2013 |
||||||
Estimated annualized impact to net interest revenue |
|||||||||
U.S. dollar(1)
|
$ |
1,159 |
$ |
1,255 |
$ |
1,197 |
|||
All other currencies |
713 |
681 |
569 |
||||||
Total |
$ |
1,872 |
$ |
1,936 |
$ |
1,766 |
|||
As a % of average interest-earning assets |
0.11 |
% |
0.11 |
% |
0.11 |
% |
|||
Estimated initial impact to OCI (after-tax)(2)
|
$ |
(3,621 |
) |
$ |
(3,395 |
) |
$ |
(2,462 |
) |
Estimated initial impact on Common Equity Tier 1 Capital ratio (bps)(3)
|
(41 |
) |
(38 |
) |
(35 |
) |
|||
(1) |
Certain trading-oriented businesses within Citi have accrual-accounted positions that are excluded from the estimated impact to net interest revenue in the table since these exposures are economically managed in combination with marked-to-market positions. The U.S. dollar interest rate exposure associated with these businesses was $(170) million for a 100 basis point instantaneous increase in interest rates as of September 30, 2014.
|
(2) |
Includes the effect of changes in interest rates on OCI related to investment securities, cash flow hedges and pension liability adjustments. |
(3) |
The estimated initial impact to the Common Equity Tier 1 Capital ratio considers the effect of Citi’s deferred tax asset position and is based on only the estimated initial OCI impact above. |
In millions of dollars (unless otherwise noted) |
Scenario 1 |
Scenario 2 |
Scenario 3 |
Scenario 4 |
||||||||
Overnight rate change (bps) |
100 |
100 |
— |
— |
||||||||
10-year rate change (bps) |
100 |
— |
100 |
(100 |
) |
|||||||
Estimated annualized impact to net interest revenue
|
||||||||||||
U.S. dollar |
$ |
1,159 |
$ |
1,120 |
$ |
85 |
$ |
(109 |
) |
|||
All other currencies |
713 |
667 |
41 |
(41 |
) |
|||||||
Total |
$ |
1,872 |
$ |
1,787 |
$ |
126 |
$ |
(150 |
) |
|||
Estimated initial impact to OCI (after-tax)(1)
|
$ |
(3,621 |
) |
$ |
(2,310 |
) |
$ |
(1,483 |
) |
$ |
1,224 |
|
Estimated initial impact to Common Equity Tier 1 Capital ratio (bps)(2)
|
(41 |
) |
(25 |
) |
(17 |
) |
14 |
|||||
(1) |
Includes the effect of changes in interest rates on OCI related to investment securities, cash flow hedges and pension liability adjustments. |
(2) |
The estimated initial impact to the Common Equity Tier 1 Capital ratio considers the effect of Citi’s deferred tax asset position and is based on only the estimated OCI impact above. |
For the quarter ended |
|||||||||
In millions of dollars |
Sept. 30, 2014 |
Jun. 30, 2014 |
Sept. 30, 2013 |
||||||
Change in FX spot rate(1)
|
(4.4 |
)% |
1.2 |
% |
1.3 |
% |
|||
Change in TCE due to foreign currency translation, net of hedges |
$ |
(1,182 |
) |
$ |
(170 |
) |
$ |
383 |
|
As a % of Tangible Common Equity |
(0.7 |
)% |
(0.1 |
)% |
0.2 |
% |
|||
Estimated impact to Common Equity Tier 1 Capital ratio (on a fully implemented basis) due to changes in foreign currency translation, net of hedges (bps) |
3 |
(3 |
) |
(1 |
) |
||||
(1) |
FX spot rate change is a weighted average based upon Citi’s quarterly average GAAP capital exposure to foreign countries. |
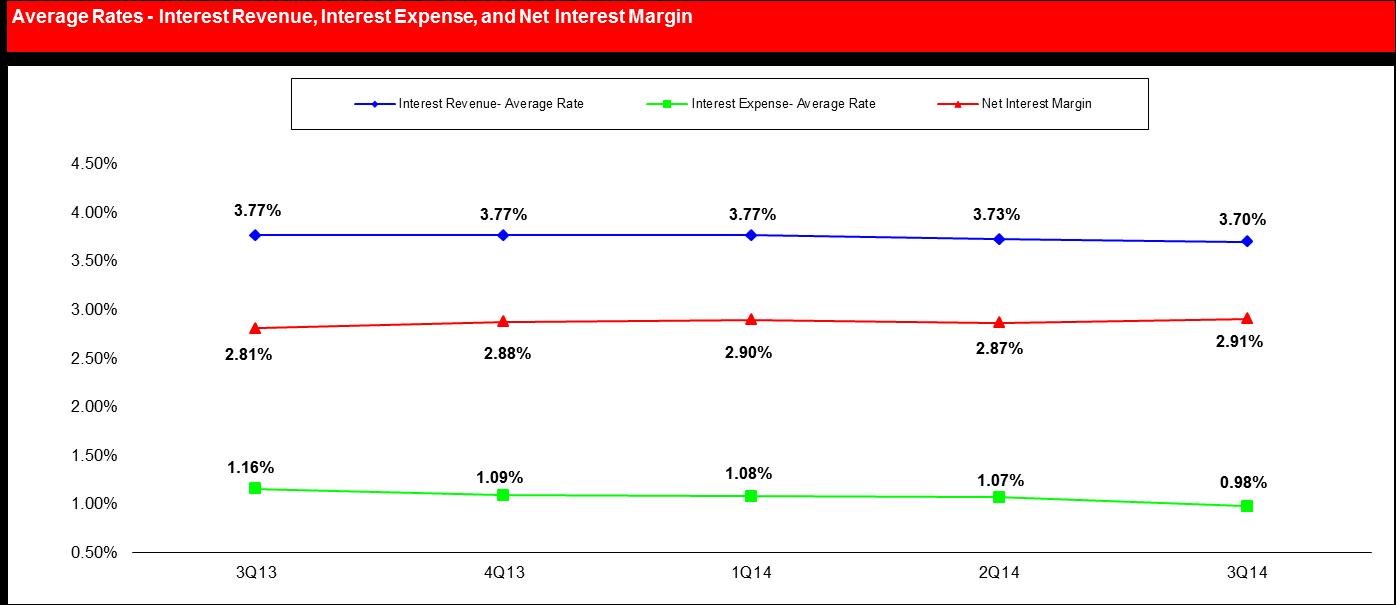
3rd Qtr. |
2nd Qtr. |
3rd Qtr. |
Change |
||||||||||||
In millions of dollars, except as otherwise noted |
2014 |
2014 |
2013 |
3Q14 vs. 3Q13 |
|||||||||||
Interest revenue(1)
|
$ |
15,636 |
$ |
15,682 |
$ |
15,588 |
— |
% |
|||||||
Interest expense |
3,325 |
3,615 |
3,952 |
(16 |
)% |
||||||||||
Net interest revenue(1)(2)(3)
|
$ |
12,311 |
$ |
12,067 |
$ |
11,636 |
6 |
% |
|||||||
Interest revenue—average rate |
3.70 |
% |
3.73 |
% |
3.77 |
% |
(7 |
) |
bps |
||||||
Interest expense—average rate |
0.98 |
1.07 |
1.16 |
(18 |
) |
bps |
|||||||||
Net interest margin |
2.91 |
% |
2.87 |
% |
2.81 |
% |
10 |
bps |
|||||||
Interest-rate benchmarks |
|||||||||||||||
Two-year U.S. Treasury note—average rate |
0.52 |
% |
0.42 |
% |
0.37 |
% |
15 |
bps |
|||||||
10-year U.S. Treasury note—average rate |
2.50 |
2.62 |
2.71 |
(21 |
) |
bps |
|||||||||
10-year vs. two-year spread |
198 |
bps |
220 |
bps |
234 |
bps |
|||||||||
(1) |
Net interest revenue includes the taxable equivalent adjustments (based on the U.S. federal statutory tax rate of 35%) of $124 million, $121 million and $125 million for the three months ended September 30, 2014, June 30, 2014 and September 30, 2013.
|
(2) |
Excludes expenses associated with certain hybrid financial instruments, which are classified as Long-term debt and accounted for at fair value with changes recorded in Principal transactions.
|
(3) |
Interest revenue, expense, rates and volumes exclude Credicard (Discontinued operations) for all periods presented. See Note 2 to the Consolidated Financial Statements.
|
Average volume |
Interest revenue |
% Average rate |
||||||||||||||||||||||
3rd Qtr. |
2nd Qtr. |
3rd Qtr. |
3rd Qtr. |
2nd Qtr. |
3rd Qtr. |
3rd Qtr. |
2nd Qtr. |
3rd Qtr. |
||||||||||||||||
In millions of dollars, except rates |
2014 |
2014 |
2013 |
2014 |
2014 |
2013 |
2014 |
2014 |
2013 |
|||||||||||||||
Assets |
||||||||||||||||||||||||
Deposits with banks(5)
|
$ |
159,432 |
$ |
160,555 |
$ |
151,533 |
$ |
235 |
$ |
250 |
$ |
255 |
0.58 |
% |
0.62 |
% |
0.67 |
% |
||||||
Federal funds sold and securities borrowed or purchased under agreements to resell(6)
|
||||||||||||||||||||||||
In U.S. offices |
147,640 |
159,178 |
155,370 |
$ |
256 |
$ |
257 |
$ |
260 |
0.69 |
% |
0.65 |
% |
0.66 |
% |
|||||||||
In offices outside the U.S.(5)
|
100,434 |
106,245 |
108,998 |
311 |
335 |
357 |
1.23 |
% |
1.26 |
% |
1.30 |
% |
||||||||||||
Total |
$ |
248,074 |
$ |
265,423 |
$ |
264,368 |
$ |
567 |
$ |
592 |
$ |
617 |
0.91 |
% |
0.89 |
% |
0.93 |
% |
||||||
Trading account assets(7)(8)
|
||||||||||||||||||||||||
In U.S. offices |
$ |
116,659 |
$ |
111,204 |
$ |
124,762 |
$ |
878 |
$ |
804 |
$ |
950 |
2.99 |
% |
2.90 |
% |
3.02 |
% |
||||||
In offices outside the U.S.(5)
|
121,183 |
123,015 |
121,493 |
637 |
683 |
575 |
2.09 |
% |
2.23 |
% |
1.88 |
% |
||||||||||||
Total |
$ |
237,842 |
$ |
234,219 |
$ |
246,255 |
$ |
1,515 |
$ |
1,487 |
$ |
1,525 |
2.53 |
% |
2.55 |
% |
2.46 |
% |
||||||
Investments |
||||||||||||||||||||||||
In U.S. offices |
||||||||||||||||||||||||
Taxable |
$ |
201,032 |
$ |
190,622 |
$ |
87,796 |
$ |
868 |
$ |
783 |
$ |
665 |
1.71 |
% |
1.65 |
% |
3.01 |
% |
||||||
Exempt from U.S. income tax |
12,771 |
18,072 |
99,511 |
158 |
173 |
198 |
4.91 |
% |
3.84 |
% |
0.79 |
% |
||||||||||||
In offices outside the U.S.(5)
|
113,987 |
114,575 |
113,918 |
885 |
933 |
915 |
3.08 |
% |
3.27 |
% |
3.19 |
% |
||||||||||||
Total |
$ |
327,790 |
$ |
323,269 |
$ |
301,225 |
$ |
1,911 |
$ |
1,889 |
$ |
1,778 |
2.31 |
% |
2.34 |
% |
2.34 |
% |
||||||
Loans (net of unearned income)(9)
|
||||||||||||||||||||||||
In U.S. offices |
$ |
360,917 |
$ |
361,875 |
$ |
354,537 |
$ |
6,544 |
$ |
6,475 |
$ |
6,472 |
7.19 |
% |
7.18 |
% |
7.24 |
% |
||||||
In offices outside the U.S.(5)
|
298,185 |
303,196 |
290,917 |
4,649 |
4,892 |
4,838 |
6.19 |
% |
6.47 |
% |
6.60 |
% |
||||||||||||
Total |
$ |
659,102 |
$ |
665,071 |
$ |
645,454 |
$ |
11,193 |
$ |
11,367 |
$ |
11,310 |
6.74 |
% |
6.86 |
% |
6.95 |
% |
||||||
Other interest-earning assets(10)
|
$ |
43,703 |
$ |
39,088 |
$ |
33,740 |
$ |
215 |
$ |
97 |
$ |
103 |
1.95 |
% |
1.00 |
% |
1.21 |
% |
||||||
Total interest-earning assets |
$ |
1,675,943 |
$ |
1,687,625 |
$ |
1,642,575 |
$ |
15,636 |
$ |
15,682 |
$ |
15,588 |
3.70 |
% |
3.73 |
% |
3.77 |
% |
||||||
Non-interest-earning assets(7)
|
$ |
219,446 |
$ |
215,443 |
$ |
213,913 |
||||||||||||||||||
Total assets from discontinued operations |
— |
— |
3,032 |
|||||||||||||||||||||
Total assets |
$ |
1,895,389 |
$ |
1,903,068 |
$ |
1,859,520 |
||||||||||||||||||
(1) |
Net interest revenue includes the taxable equivalent adjustments (based on the U.S. federal statutory tax rate of 35%) of $124 million, $121 million and $125 million for the three months ended September 30, 2014, June 30, 2014 and September 30, 2013, respectively.
|
(2) |
Interest rates and amounts include the effects of risk management activities associated with the respective asset and liability categories. |
(3) |
Monthly or quarterly averages have been used by certain subsidiaries where daily averages are unavailable. |
(4) |
Detailed average volume, Interest revenue and Interest expense exclude Discontinued operations. See Note 2 to the Consolidated Financial Statements.
|
(5) |
Average rates reflect prevailing local interest rates, including inflationary effects and monetary corrections in certain countries. |
(6) |
Average volumes of securities borrowed or purchased under agreements to resell are reported net pursuant to FIN 41 (ASC 210-20-45). However, Interest revenue excludes the impact of FIN 41 (ASC 210-20-45).
|
(7) |
The fair value carrying amounts of derivative contracts are reported net, pursuant to FIN 39 (ASC 815-10-45), in Non-interest-earning assets and Other non-interest-bearing liabilities.
|
(8) |
Interest expense on Trading account liabilities of ICG is reported as a reduction of Interest revenue. Interest revenue and Interest expense on cash collateral positions are reported in interest on Trading account assets and Trading account liabilities, respectively.
|
(9) |
Includes cash-basis loans. |
(10) |
Includes brokerage receivables. |
Average volume |
Interest expense |
% Average rate |
||||||||||||||||||||||
3rd Qtr. |
2nd Qtr. |
3rd Qtr. |
3rd Qtr. |
2nd Qtr. |
3rd Qtr. |
3rd Qtr. |
2nd Qtr. |
3rd Qtr. |
||||||||||||||||
In millions of dollars, except rates |
2014 |
2014 |
2013 |
2014 |
2014 |
2013 |
2014 |
2014 |
2013 |
|||||||||||||||
Liabilities |
||||||||||||||||||||||||
Deposits |
||||||||||||||||||||||||
In U.S. offices(5)
|
$ |
293,927 |
$ |
293,480 |
$ |
258,550 |
$ |
329 |
$ |
356 |
$ |
404 |
0.44 |
% |
0.49 |
% |
0.62 |
% |
||||||
In offices outside the U.S.(6)
|
459,656 |
472,654 |
478,865 |
1,088 |
1,113 |
1,086 |
0.94 |
% |
0.94 |
% |
0.90 |
% |
||||||||||||
Total |
$ |
753,583 |
$ |
766,134 |
$ |
737,415 |
$ |
1,417 |
$ |
1,469 |
$ |
1,490 |
0.75 |
% |
0.77 |
% |
0.80 |
% |
||||||
Federal funds purchased and securities loaned or sold under agreements to repurchase(7)
|
||||||||||||||||||||||||
In U.S. offices |
$ |
98,735 |
$ |
99,617 |
$ |
122,714 |
$ |
136 |
$ |
198 |
$ |
139 |
0.55 |
% |
0.80 |
% |
0.45 |
% |
||||||
In offices outside the U.S.(6)
|
83,474 |
93,685 |
102,236 |
275 |
339 |
422 |
1.31 |
% |
1.45 |
% |
1.64 |
% |
||||||||||||
Total |
$ |
182,209 |
$ |
193,302 |
$ |
224,950 |
$ |
411 |
$ |
537 |
$ |
561 |
0.89 |
% |
1.11 |
% |
0.99 |
% |
||||||
Trading account liabilities(8)(9)
|
||||||||||||||||||||||||
In U.S. offices |
$ |
31,773 |
$ |
31,403 |
$ |
24,079 |
$ |
14 |
$ |
23 |
$ |
29 |
0.17 |
% |
0.29 |
% |
0.48 |
% |
||||||
In offices outside the U.S.(6)
|
43,629 |
50,927 |
47,212 |
24 |
25 |
17 |
0.22 |
% |
0.20 |
% |
0.14 |
% |
||||||||||||
Total |
$ |
75,402 |
$ |
82,330 |
$ |
71,291 |
$ |
38 |
$ |
48 |
$ |
46 |
0.20 |
% |
0.23 |
% |
0.26 |
% |
||||||
Short-term borrowings(10)
|
||||||||||||||||||||||||
In U.S. offices |
$ |
80,829 |
$ |
76,824 |
$ |
81,992 |
$ |
41 |
$ |
52 |
$ |
55 |
0.20 |
% |
0.27 |
% |
0.27 |
% |
||||||
In offices outside the U.S.(6)
|
44,164 |
38,336 |
34,183 |
100 |
110 |
95 |
0.90 |
% |
1.15 |
% |
1.10 |
% |
||||||||||||
Total |
$ |
124,993 |
$ |
115,160 |
$ |
116,175 |
$ |
141 |
$ |
162 |
$ |
150 |
0.45 |
% |
0.56 |
% |
0.51 |
% |
||||||
Long-term debt(11)
|
||||||||||||||||||||||||
In U.S. offices |
$ |
196,972 |
$ |
195,397 |
$ |
187,591 |
$ |
1,259 |
$ |
1,323 |
$ |
1,613 |
2.54 |
% |
2.72 |
% |
3.41 |
% |
||||||
In offices outside the U.S.(6)
|
7,028 |
8,671 |
9,847 |
59 |
76 |
92 |
3.33 |
% |
3.52 |
% |
3.71 |
% |
||||||||||||
Total |
$ |
204,000 |
$ |
204,068 |
$ |
197,438 |
$ |
1,318 |
$ |
1,399 |
$ |
1,705 |
2.56 |
% |
2.75 |
% |
3.43 |
% |
||||||
Total interest-bearing liabilities |
$ |
1,340,187 |
$ |
1,360,994 |
$ |
1,347,269 |
$ |
3,325 |
$ |
3,615 |
$ |
3,952 |
0.98 |
% |
1.07 |
% |
1.16 |
% |
||||||
Demand deposits in U.S. offices |
$ |
25,209 |
$ |
27,796 |
$ |
24,815 |
||||||||||||||||||
Other non-interest-bearing liabilities(8)
|
315,871 |
301,148 |
287,826 |
|||||||||||||||||||||
Total liabilities from discontinued operations |
— |
— |
— |
|||||||||||||||||||||
Total liabilities |
$ |
1,681,267 |
$ |
1,689,938 |
$ |
1,659,910 |
||||||||||||||||||
Citigroup stockholders’ equity(12)
|
$ |
212,513 |
$ |
211,400 |
$ |
197,722 |
||||||||||||||||||
Noncontrolling interest |
1,609 |
1,730 |
1,888 |
|||||||||||||||||||||
Total equity(12)
|
$ |
214,122 |
$ |
213,130 |
$ |
199,610 |
||||||||||||||||||
Total liabilities and stockholders’ equity |
$ |
1,895,389 |
$ |
1,903,068 |
$ |
1,859,520 |
||||||||||||||||||
Net interest revenue as a percentage of average interest-earning assets(13)
|
||||||||||||||||||||||||
In U.S. offices |
$ |
957,803 |
$ |
950,037 |
$ |
921,835 |
$ |
7,041 |
$ |
6,640 |
$ |
6,417 |
2.92 |
% |
2.80 |
% |
2.76 |
% |
||||||
In offices outside the U.S.(6)
|
718,140 |
737,588 |
720,740 |
5,270 |
5,427 |
5,219 |
2.91 |
2.95 |
2.87 |
|||||||||||||||
Total |
$ |
1,675,943 |
$ |
1,687,625 |
$ |
1,642,575 |
$ |
12,311 |
$ |
12,067 |
$ |
11,636 |
2.91 |
% |
2.87 |
% |
2.81 |
% |
||||||
(1) |
Net interest revenue includes the taxable equivalent adjustments (based on the U.S. federal statutory tax rate of 35%) of $124 million, $121 million and $125 million for the three months ended September 30, 2014, June 30, 2014 and September 30, 2013, respectively.
|
(2) |
Interest rates and amounts include the effects of risk management activities associated with the respective asset and liability categories. |
(3) |
Monthly or quarterly averages have been used by certain subsidiaries where daily averages are unavailable. |
(4) |
Detailed average volume, Interest revenue and Interest expense exclude Discontinued operations. See Note 2 to the Consolidated Financial Statements.
|
(5) |
Consists of other time deposits and savings deposits. Savings deposits are made up of insured money market accounts, NOW accounts, and other savings deposits. The interest expense on savings deposits includes FDIC deposit insurance fees and charges. |
(6) |
Average rates reflect prevailing local interest rates, including inflationary effects and monetary corrections in certain countries. |
(7) |
Average volumes of securities loaned or sold under agreements to repurchase are reported net pursuant to FIN 41 (ASC 210-20-45). However, Interest expense excludes the impact of FIN 41 (ASC 210-20-45).
|
(8) |
The fair value carrying amounts of derivative contracts are reported net, pursuant to FIN 39 (ASC 815-10-45), in Non-interest-earning assets and Other non-interest-bearing liabilities.
|
(9) |
Interest expense on Trading account liabilities of ICG is reported as a reduction of Interest revenue. Interest revenue and Interest expense on cash collateral positions are reported in interest on Trading account assets and Trading account liabilities, respectively.
|
(10) |
Includes Brokerage payables. |
(11) |
Excludes hybrid financial instruments and beneficial interests in consolidated VIEs that are classified as Long-term debt, as these obligations are accounted for in changes in fair value recorded in Principal transactions.
|
(12) |
Includes stockholders’ equity from discontinued operations. |
(13) |
Includes allocations for capital and funding costs based on the location of the asset. |
Average volume |
Interest revenue |
% Average rate |
||||||||||||||
Nine Months |
Nine Months |
Nine Months |
Nine Months |
Nine Months |
Nine Months |
|||||||||||
In millions of dollars, except rates |
2014 |
2013 |
2014 |
2013 |
2014 |
2013 |
||||||||||
Assets |
||||||||||||||||
Deposits with banks(5)
|
$ |
164,968 |
$ |
135,412 |
$ |
737 |
$ |
763 |
0.60 |
% |
0.75 |
% |
||||
Federal funds sold and securities borrowed or purchased under agreements to resell(6)
|
||||||||||||||||
In U.S. offices |
$ |
153,228 |
$ |
159,293 |
$ |
762 |
$ |
866 |
0.66 |
% |
0.73 |
% |
||||
In offices outside the U.S.(5)
|
103,002 |
111,434 |
991 |
1,141 |
1.29 |
% |
1.37 |
% |
||||||||
Total |
$ |
256,230 |
$ |
270,727 |
$ |
1,753 |
$ |
2,007 |
0.91 |
% |
0.99 |
% |
||||
Trading account assets(7)(8)
|
||||||||||||||||
In U.S. offices |
$ |
113,797 |
$ |
128,845 |
$ |
2,561 |
$ |
2,851 |
3.01 |
% |
2.96 |
% |
||||
In offices outside the U.S.(5)
|
121,695 |
129,302 |
1,960 |
2,043 |
2.15 |
% |
2.11 |
% |
||||||||
Total |
$ |
235,492 |
$ |
258,147 |
$ |
4,521 |
$ |
4,894 |
2.57 |
% |
2.53 |
% |
||||
Investments |
||||||||||||||||
In U.S. offices |
||||||||||||||||
Taxable |
$ |
188,826 |
$ |
147,911 |
$ |
2,384 |
$ |
2,027 |
1.69 |
% |
1.83 |
% |
||||
Exempt from U.S. income tax |
16,440 |
45,488 |
529 |
612 |
4.30 |
% |
1.80 |
% |
||||||||
In offices outside the U.S.(5)
|
114,333 |
112,219 |
2,734 |
2,815 |
3.20 |
% |
3.35 |
% |
||||||||
Total |
$ |
319,599 |
$ |
305,618 |
$ |
5,647 |
$ |
5,454 |
2.36 |
% |
2.39 |
% |
||||
Loans (net of unearned income)(9)
|
||||||||||||||||
In U.S. offices |
$ |
361,750 |
$ |
352,826 |
$ |
19,507 |
$ |
19,285 |
7.21 |
% |
7.31 |
% |
||||
In offices outside the U.S.(5)
|
299,210 |
290,803 |
14,239 |
14,762 |
6.36 |
% |
6.79 |
% |
||||||||
Total |
$ |
660,960 |
$ |
643,629 |
$ |
33,746 |
$ |
34,047 |
6.83 |
% |
7.07 |
% |
||||
Other interest-earning assets(10)
|
$ |
38,894 |
$ |
40,858 |
$ |
392 |
$ |
492 |
1.35 |
% |
1.61 |
% |
||||
Total interest-earning assets |
$ |
1,676,143 |
$ |
1,654,391 |
$ |
46,796 |
$ |
47,657 |
3.73 |
% |
3.85 |
% |
||||
Non-interest-earning assets(7)
|
$ |
219,754 |
$ |
224,154 |
||||||||||||
Total assets from discontinued operations |
— |
3,182 |
||||||||||||||
Total assets |
$ |
1,895,897 |
$ |
1,881,727 |
||||||||||||
(1) |
Net interest revenue includes the taxable equivalent adjustments (based on the U.S. federal statutory tax rate of 35%) of $124 million, $121 million and $125 million ended September 30, 2014, June 30, 2014 and September 30, 2013, respectively.
|
(2) |
Interest rates and amounts include the effects of risk management activities associated with the respective asset and liability categories. |
(3) |
Monthly or quarterly averages have been used by certain subsidiaries where daily averages are unavailable. |
(4) |
Detailed average volume, Interest revenue and Interest expense exclude Discontinued operations. See Note 2 to the Consolidated Financial Statements.
|
(5) |
Average rates reflect prevailing local interest rates, including inflationary effects and monetary corrections in certain countries. |
(6) |
Average volumes of securities borrowed or purchased under agreements to resell are reported net pursuant to FIN 41 (ASC 210-20-45). However, Interest revenue excludes the impact of FIN 41 (ASC 210-20-45).
|
(7) |
The fair value carrying amounts of derivative contracts are reported in Non-interest-earning assets and Other non-interest-bearing liabilities.
|
(8) |
Interest expense on Trading account liabilities of ICG is reported as a reduction of Interest revenue. Interest revenue and Interest expense on cash collateral positions are reported in interest on Trading account assets and Trading account liabilities, respectively.
|
(9) |
Includes cash-basis loans. |
Average volume |
Interest expense |
% Average rate |
||||||||||||||
Nine Months |
Nine Months |
Nine Months |
Nine Months |
Nine Months |
Nine Months |
|||||||||||
In millions of dollars, except rates |
2014 |
2013 |
2014 |
2013 |
2014 |
2013 |
||||||||||
Liabilities |
||||||||||||||||
Deposits |
||||||||||||||||
In U.S. offices(5)
|
$ |
289,555 |
$ |
258,222 |
$ |
1,087 |
$ |
1,348 |
0.50 |
% |
0.70 |
% |
||||
In offices outside the U.S.(6)
|
470,658 |
478,856 |
3,248 |
3,401 |
0.92 |
% |
0.95 |
% |
||||||||
Total |
$ |
760,213 |
$ |
737,078 |
$ |
4,335 |
$ |
4,749 |
0.76 |
% |
0.86 |
% |
||||
Federal funds purchased and securities loaned or sold under agreements to repurchase(7)
|
||||||||||||||||
In U.S. offices |
$ |
100,643 |
$ |
129,615 |
$ |
490 |
$ |
524 |
0.65 |
% |
0.54 |
% |
||||
In offices outside the U.S.(6)
|
90,243 |
104,176 |
983 |
1,276 |
1.46 |
% |
1.64 |
% |
||||||||
Total |
$ |
190,886 |
$ |
233,791 |
$ |
1,473 |
$ |
1,800 |
1.03 |
% |
1.03 |
% |
||||
Trading account liabilities(8)(9)
|
||||||||||||||||
In U.S. offices |
$ |
30,280 |
$ |
25,652 |
$ |
58 |
$ |
72 |
0.26 |
% |
0.38 |
% |
||||
In offices outside the U.S.(6)
|
46,577 |
49,337 |
69 |
59 |
0.20 |
% |
0.16 |
% |
||||||||
Total |
$ |
76,857 |
$ |
74,989 |
$ |
127 |
$ |
131 |
0.22 |
% |
0.23 |
% |
||||
Short-term borrowings(10)
|
||||||||||||||||
In U.S. offices |
$ |
79,008 |
$ |
76,323 |
$ |
130 |
$ |
144 |
0.22 |
% |
0.25 |
% |
||||
In offices outside the U.S.(6)
|
39,311 |
35,915 |
310 |
317 |
1.05 |
% |
1.18 |
% |
||||||||
Total |
$ |
118,319 |
$ |
112,238 |
$ |
440 |
$ |
461 |
0.50 |
% |
0.55 |
% |
||||
Long-term debt(11)
|
||||||||||||||||
In U.S. offices |
$ |
193,970 |
$ |
195,761 |
$ |
3,942 |
$ |
5,156 |
2.72 |
% |
3.52 |
% |
||||
In offices outside the U.S.(6)
|
8,211 |
10,358 |
214 |
143 |
3.48 |
% |
1.85 |
% |
||||||||
Total |
$ |
202,181 |
$ |
206,119 |
$ |
4,156 |
$ |
5,299 |
2.75 |
% |
3.44 |
% |
||||
Total interest-bearing liabilities |
$ |
1,348,456 |
$ |
1,364,215 |
$ |
10,531 |
$ |
12,440 |
1.04 |
% |
1.22 |
% |
||||
Demand deposits in U.S. offices |
$ |
26,978 |
$ |
20,405 |
||||||||||||
Other non-interest-bearing liabilities(8)
|
308,658 |
299,978 |
||||||||||||||
Total liabilities from discontinued operations |
— |
386 |
||||||||||||||
Total liabilities |
$ |
1,684,092 |
$ |
1,684,984 |
||||||||||||
Citigroup stockholders’ equity(12)
|
$ |
210,066 |
$ |
194,781 |
||||||||||||
Noncontrolling interest |
1,739 |
1,962 |
||||||||||||||
Total equity(12)
|
$ |
211,805 |
$ |
196,743 |
||||||||||||
Total liabilities and stockholders’ equity |
$ |
1,895,897 |
$ |
1,881,727 |
||||||||||||
Net interest revenue as a percentage of average interest-earning assets(13)
|
||||||||||||||||
In U.S. offices |
$ |
950,484 |
$ |
921,081 |
$ |
20,357 |
$ |
18,840 |
2.86 |
% |
2.73 |
% |
||||
In offices outside the U.S.(6)
|
725,659 |
733,310 |
15,908 |
16,377 |
2.93 |
2.99 |
% |
|||||||||
Total |
$ |
1,676,143 |
$ |
1,654,391 |
$ |
36,265 |
$ |
35,217 |
2.89 |
% |
2.85 |
% |
||||
(1) |
Net interest revenue includes the taxable equivalent adjustments (based on the U.S. federal statutory tax rate of 35%) of $124 million, $121 million and $125 million for the three months ended September 30, 2014, June 30, 2014 and September 30, 2013, respectively.
|
(2) |
Interest rates and amounts include the effects of risk management activities associated with the respective asset and liability categories. |
(3) |
Monthly or quarterly averages have been used by certain subsidiaries where daily averages are unavailable. |
(4) |
Detailed average volume, Interest revenue and Interest expense exclude Discontinued operations. See Note 2 to the Consolidated Financial Statements.
|
(5) |
Consists of other time deposits and savings deposits. Savings deposits are made up of insured money market accounts, NOW accounts, and other savings deposits. The interest expense on savings deposits includes FDIC deposit insurance fees and charges. |
(6) |
Average rates reflect prevailing local interest rates, including inflationary effects and monetary corrections in certain countries. |
(7) |
Average volumes of securities loaned or sold under agreements to repurchase are reported net pursuant to FIN 41 (ASC 210-20-45). However, Interest expense excludes the impact of FIN 41 (ASC 210-20-45).
|
(8) |
The fair value carrying amounts of derivative contracts are reported in Non-interest-earning assets and Other non-interest-bearing liabilities.
|
(9) |
Interest expense on Trading account liabilities of ICG is reported as a reduction of Interest revenue. Interest revenue and Interest expense on cash collateral positions are reported in interest on Trading account assets and Trading account liabilities, respectively.
|
(10) |
Excludes hybrid financial instruments and beneficial interests in consolidated VIEs that are classified as Long-term debt, as these obligations are accounted for in changes in fair value recorded in Principal transactions.
|
(11) |
Includes stockholders' equity from discontinued operations. |
(12) |
Includes allocations for capital and funding costs based on the location of the asset. |
3rd Qtr. 2014 vs. 2nd Qtr. 2014 |
3rd Qtr. 2014 vs. 3rd Qtr. 2013 |
|||||||||||||||||
|
Increase (decrease)
due to change in:
|
Increase (decrease)
due to change in:
|
|||||||||||||||||
In millions of dollars |
Average
volume
|
Average
rate
|
Net
change
|
Average
volume
|
Average
rate
|
Net
change
|
||||||||||||
Deposits with banks(4)
|
$ |
(2 |
) |
$ |
(13 |
) |
$ |
(15 |
) |
$ |
13 |
$ |
(33 |
) |
$ |
(20 |
) |
|
|
Federal funds sold and securities borrowed or
purchased under agreements to resell
|
||||||||||||||||||
In U.S. offices |
$ |
(19 |
) |
$ |
18 |
$ |
(1 |
) |
$ |
(13 |
) |
$ |
9 |
$ |
(4 |
) |
||
In offices outside the U.S.(4)
|
(18 |
) |
(6 |
) |
(24 |
) |
(27 |
) |
(19 |
) |
(46 |
) |
||||||
Total |
$ |
(37 |
) |
$ |
12 |
$ |
(25 |
) |
$ |
(40 |
) |
$ |
(10 |
) |
$ |
(50 |
) |
|
Trading account assets(5)
|
||||||||||||||||||
In U.S. offices |
$ |
40 |
$ |
34 |
$ |
74 |
$ |
(61 |
) |
$ |
(11 |
) |
$ |
(72 |
) |
|||
In offices outside the U.S.(4)
|
(10 |
) |
(36 |
) |
(46 |
) |
(1 |
) |
63 |
62 |
||||||||
Total |
$ |
30 |
$ |
(2 |
) |
$ |
28 |
$ |
(62 |
) |
$ |
52 |
$ |
(10 |
) |
|||
Investments(1)
|
||||||||||||||||||
In U.S. offices |
$ |
24 |
$ |
46 |
$ |
70 |
$ |
126 |
$ |
37 |
$ |
163 |
||||||
In offices outside the U.S.(4)
|
(5 |
) |
(43 |
) |
(48 |
) |
1 |
(31 |
) |
(30 |
) |
|||||||
Total |
$ |
19 |
$ |
3 |
$ |
22 |
$ |
127 |
$ |
6 |
$ |
133 |
||||||
Loans (net of unearned income)(6)
|
||||||||||||||||||
In U.S. offices |
$ |
(17 |
) |
$ |
86 |
$ |
69 |
$ |
116 |
$ |
(44 |
) |
$ |
72 |
||||
In offices outside the U.S.(4)
|
(80 |
) |
(163 |
) |
(243 |
) |
119 |
(308 |
) |
(189 |
) |
|||||||
Total |
$ |
(97 |
) |
$ |
(77 |
) |
$ |
(174 |
) |
$ |
235 |
$ |
(352 |
) |
$ |
(117 |
) |
|
Other interest-earning assets(7)
|
$ |
13 |
$ |
105 |
$ |
118 |
$ |
36 |
$ |
76 |
$ |
112 |
||||||
Total interest revenue |
$ |
(74 |
) |
$ |
28 |
$ |
(46 |
) |
$ |
309 |
$ |
(261 |
) |
$ |
48 |
|||
(1) |
The taxable equivalent adjustment is based on the U.S. federal statutory tax rate of 35% and is included in this presentation. |
(2) |
Rate/volume variance is allocated based on the percentage relationship of changes in volume and changes in rate to the total net change. |
(3) |
Detailed average volume, Interest revenue and Interest expense exclude Discontinued operations. See Note 2 to the Consolidated Financial Statements.
|
(4) |
Changes in average rates reflect changes in prevailing local interest rates, including inflationary effects and monetary corrections in certain countries. |
(5) |
Interest expense on Trading account liabilities of ICG is reported as a reduction of Interest revenue. Interest revenue and Interest expense on cash collateral positions are reported in interest on Trading account assets and Trading account liabilities, respectively.
|
(6) |
Includes cash-basis loans. |
(7) |
Includes brokerage receivables. |
3rd Qtr. 2014 vs. 2nd Qtr. 2014 |
3rd Qtr. 2014 vs. 3rd Qtr. 2013 |
|||||||||||||||||
|
Increase (decrease)
due to change in:
|
Increase (decrease)
due to change in:
|
|||||||||||||||||
In millions of dollars |
Average
volume
|
Average
rate
|
Net
change
|
Average
volume
|
Average
rate
|
Net
change
|
||||||||||||
Deposits |
||||||||||||||||||
In U.S. offices |
$ |
1 |
$ |
(28 |
) |
$ |
(27 |
) |
$ |
50 |
$ |
(125 |
) |
$ |
(75 |
) |
||
In offices outside the U.S.(4)
|
(31 |
) |
6 |
(25 |
) |
(44 |
) |
46 |
2 |
|||||||||
Total |
$ |
(30 |
) |
$ |
(22 |
) |
$ |
(52 |
) |
$ |
6 |
$ |
(79 |
) |
$ |
(73 |
) |
|
Federal funds purchased and securities loaned or sold under agreements to repurchase |
||||||||||||||||||
In U.S. offices |
$ |
(2 |
) |
$ |
(60 |
) |
$ |
(62 |
) |
$ |
(30 |
) |
$ |
27 |
$ |
(3 |
) |
|
In offices outside the U.S.(4)
|
(35 |
) |
(29 |
) |
(64 |
) |
(70 |
) |
(77 |
) |
(147 |
) |
||||||
Total |
$ |
(37 |
) |
$ |
(89 |
) |
$ |
(126 |
) |
$ |
(100 |
) |
$ |
(50 |
) |
$ |
(150 |
) |
Trading account liabilities(5)
|
||||||||||||||||||
In U.S. offices |
$ |
— |
$ |
(9 |
) |
$ |
(9 |
) |
$ |
7 |
$ |
(22 |
) |
$ |
(15 |
) |
||
In offices outside the U.S.(4)
|
(4 |
) |
3 |
(1 |
) |
(1 |
) |
8 |
7 |
|||||||||
Total |
$ |
(4 |
) |
$ |
(6 |
) |
$ |
(10 |
) |
$ |
6 |
$ |
(14 |
) |
$ |
(8 |
) |
|
Short-term borrowings(6)
|
||||||||||||||||||
In U.S. offices |
$ |
3 |
$ |
(14 |
) |
$ |
(11 |
) |
$ |
(1 |
) |
$ |
(13 |
) |
$ |
(14 |
) |
|
In offices outside the U.S.(4)
|
15 |
(25 |
) |
(10 |
) |
25 |
(20 |
) |
5 |
|||||||||
Total |
$ |
18 |
$ |
(39 |
) |
$ |
(21 |
) |
$ |
24 |
$ |
(33 |
) |
$ |
(9 |
) |
||
Long-term debt |
||||||||||||||||||
In U.S. offices |
$ |
11 |
$ |
(75 |
) |
$ |
(64 |
) |
$ |
77 |
$ |
(431 |
) |
$ |
(354 |
) |
||
In offices outside the U.S.(4)
|
(14 |
) |
(3 |
) |
(17 |
) |
(24 |
) |
(9 |
) |
(33 |
) |
||||||
Total |
$ |
(3 |
) |
$ |
(78 |
) |
$ |
(81 |
) |
$ |
53 |
$ |
(440 |
) |
$ |
(387 |
) |
|
Total interest expense |
$ |
(56 |
) |
$ |
(234 |
) |
$ |
(290 |
) |
$ |
(11 |
) |
$ |
(616 |
) |
$ |
(627 |
) |
Net interest revenue |
$ |
(18 |
) |
$ |
262 |
$ |
244 |
$ |
320 |
$ |
355 |
$ |
675 |
|||||
(1) |
The taxable equivalent adjustment is based on the U.S. federal statutory tax rate of 35% and is included in this presentation. |
(2) |
Rate/volume variance is allocated based on the percentage relationship of changes in volume and changes in rate to the total net change. |
(3) |
Detailed average volume, Interest revenue and Interest expense exclude Discontinued operations. See Note 2 to the Consolidated Financial Statements.
|
(4) |
Changes in average rates reflect changes in prevailing local interest rates, including inflationary effects and monetary corrections in certain countries. |
(5) |
Interest expense on Trading account liabilities of ICG is reported as a reduction of Interest revenue. Interest revenue and Interest expense on cash collateral positions are reported in interest on Trading account assets and Trading account liabilities, respectively.
|
(6) |
Includes brokerage payables. |
Nine Months 2014 vs. Nine Months 2013 |
|||||||||
|
Increase (decrease)
due to change in:
|
|||||||||
In millions of dollars |
Average
volume
|
Average
rate
|
Net
change(2)
|
||||||
Deposits at interest with banks(4)
|
$ |
149 |
$ |
(175 |
) |
$ |
(26 |
) |
|
Federal funds sold and securities borrowed or purchased under agreements to resell |
|||||||||
In U.S. offices |
$ |
(32 |
) |
$ |
(72 |
) |
$ |
(104 |
) |
In offices outside the U.S.(4)
|
(83 |
) |
(67 |
) |
(150 |
) |
|||
Total |
$ |
(115 |
) |
$ |
(139 |
) |
$ |
(254 |
) |
Trading account assets(5)
|
|||||||||
In U.S. offices |
$ |
(338 |
) |
$ |
48 |
$ |
(290 |
) |
|
In offices outside the U.S.(4)
|
(122 |
) |
39 |
(83 |
) |
||||
Total |
$ |
(460 |
) |
$ |
87 |
$ |
(373 |
) |
|
Investments(1)
|
0 |
||||||||
In U.S. offices |
$ |
166 |
$ |
108 |
$ |
274 |
|||
In offices outside the U.S.(4)
|
52 |
(133 |
) |
(81 |
) |
||||
Total |
$ |
218 |
$ |
(25 |
) |
$ |
193 |
||
Loans (net of unearned income)(6)
|
|||||||||
In U.S. offices |
$ |
483 |
$ |
(261 |
) |
$ |
222 |
||
In offices outside the U.S.(4)
|
418 |
(941 |
) |
(523 |
) |
||||
Total |
$ |
901 |
$ |
(1,202 |
) |
$ |
(301 |
) |
|
Other interest-earning assets |
$ |
(23 |
) |
$ |
(77 |
) |
$ |
(100 |
) |
Total interest revenue |
$ |
670 |
$ |
(1,531 |
) |
$ |
(861 |
) |
|
Deposits (7)
|
|||||||||
In U.S. offices |
$ |
150 |
$ |
(411 |
) |
$ |
(261 |
) |
|
In offices outside the U.S.(4)
|
(58 |
) |
(95 |
) |
(153 |
) |
|||
Total |
$ |
92 |
$ |
(506 |
) |
$ |
(414 |
) |
|
Federal funds purchased and securities loaned or sold under agreements to repurchase |
|||||||||
In U.S. offices |
$ |
(130 |
) |
$ |
96 |
$ |
(34 |
) |
|
In offices outside the U.S.(4)
|
(160 |
) |
(133 |
) |
(293 |
) |
|||
Total |
$ |
(290 |
) |
$ |
(37 |
) |
$ |
(327 |
) |
Trading account liabilities(5)
|
|||||||||
In U.S. offices |
$ |
11 |
$ |
(25 |
) |
$ |
(14 |
) |
|
In offices outside the U.S.(4)
|
(3 |
) |
13 |
10 |
|||||
Total |
$ |
8 |
$ |
(12 |
) |
$ |
(4 |
) |
|
Short-term borrowings |
|||||||||
In U.S. offices |
$ |
5 |
$ |
(19 |
) |
$ |
(14 |
) |
|
In offices outside the U.S.(4)
|
28 |
(35 |
) |
(7 |
) |
||||
Total |
$ |
33 |
$ |
(54 |
) |
$ |
(21 |
) |
|
Long-term debt |
|||||||||
In U.S. offices |
$ |
(47 |
) |
$ |
(1,167 |
) |
$ |
(1,214 |
) |
In offices outside the U.S.(4)
|
(35 |
) |
106 |
71 |
|||||
Total |
$ |
(82 |
) |
$ |
(1,061 |
) |
$ |
(1,143 |
) |
Total interest expense |
$ |
(239 |
) |
$ |
(1,670 |
) |
$ |
(1,909 |
) |
Net interest revenue |
$ |
909 |
$ |
139 |
$ |
1,048 |
|||
(1) |
The taxable equivalent adjustment is based on the U.S. Federal statutory tax rate of 35% and is included in this presentation. |
(2) |
Rate/volume variance is allocated based on the percentage relationship of changes in volume and changes in rate to the total net change. |
(3) |
Detailed average volume, Interest revenue and Interest expense exclude Discontinued operations.
|
(4) |
Changes in average rates reflect changes in prevailing local interest rates, including inflationary effects and monetary corrections in certain countries. |
(5) |
Interest expense on Trading account liabilities of ICG is reported as a reduction of Interest revenue. Interest revenue and Interest expense on cash collateral positions are reported in Trading account assets and Trading account liabilities, respectively.
|
(6) |
Includes cash-basis loans. |
(7) |
The interest expense on deposits includes the FDIC assessment and deposit insurance fees and charges of $766 million and $855 million for the nine months ended September 30, 2014 and 2013, respectively.
|
Third Quarter |
Second Quarter |
Third Quarter |
||||||||||||||||
In millions of dollars |
September 30, 2014 |
2014 Average |
June 30, 2014 |
2014 Average |
September 30, 2013 |
2013 Average |
||||||||||||
Interest rate |
$ |
79 |
$ |
80 |
$ |
81 |
$ |
85 |
N/A |
N/A |
||||||||
Credit spread |
66 |
70 |
72 |
73 |
N/A |
N/A |
||||||||||||
Covariance adjustment(1)
|
(37 |
) |
(41 |
) |
(41 |
) |
(43 |
) |
N/A |
N/A |
||||||||
Fully diversified interest rate and credit spread |
108 |
109 |
112 |
115 |
105 |
112 |
||||||||||||
Foreign exchange |
29 |
32 |
26 |
34 |
27 |
32 |
||||||||||||
Equity |
22 |
22 |
24 |
26 |
26 |
26 |
||||||||||||
Commodity |
14 |
15 |
13 |
15 |
11 |
13 |
||||||||||||
Covariance adjustment(1)
|
(70 |
) |
(73 |
) |
(72 |
) |
(79 |
) |
(62 |
) |
(73 |
) |
||||||
Total Trading VAR—all market risk factors, including general and specific risk (excluding credit portfolios)(2)
|
$ |
103 |
$ |
105 |
$ |
103 |
$ |
111 |
$ |
107 |
$ |
110 |
||||||
Specific risk-only component(3)
|
$ |
6 |
$ |
9 |
$ |
9 |
$ |
12 |
$ |
19 |
$ |
16 |
||||||
Total Trading VAR—general market risk factors only (excluding credit portfolios)(2)
|
$ |
97 |
$ |
96 |
$ |
94 |
$ |
99 |
$ |
88 |
$ |
94 |
||||||
Incremental Impact of the Credit Portfolio(4)
|
24 |
16 |
$ |
14 |
$ |
24 |
$ |
10 |
$ |
7 |
||||||||
Total Trading and Credit Portfolios VAR |
$ |
127 |
$ |
121 |
$ |
117 |
$ |
135 |
$ |
117 |
$ |
117 |
||||||
(1) |
Covariance adjustment (also known as diversification benefit) equals the difference between the total VAR and the sum of the VARs tied to each individual risk type. The benefit reflects the fact that the risks within each and across risk types are not perfectly correlated and, consequently, the total VAR on a given day will be lower than the sum of the VARs relating to each individual risk type. The determination of the primary drivers of changes to the covariance adjustment is made by an examination of the impact of both model parameter and position changes. |
(3) |
The specific risk-only component represents the level of equity and fixed income issuer-specific risk embedded in VAR. |
(4) |
The credit portfolio is composed of mark-to-market positions associated with non-trading business units including Citi Treasury, the CVA relating to derivative counterparties and all associated CVA hedges. FVA and DVA are not included. The credit portfolio also includes hedges to the loan portfolio, fair value option loans and hedges to the leveraged finance pipeline within capital markets origination within ICG.
|
Third Quarter |
Second Quarter |
Third Quarter |
||||||||||||||
2014 |
2014 |
2013 |
||||||||||||||
In millions of dollars |
Low |
High |
Low |
High |
Low |
High |
||||||||||
Interest rate |
$ |
52 |
$ |
105 |
$ |
65 |
$ |
101 |
N/A |
N/A |
||||||
Credit spread |
64 |
78 |
68 |
82 |
N/A |
N/A |
||||||||||
Fully diversified interest rate and credit spread |
89 |
130 |
101 |
129 |
96 |
134 |
||||||||||
Foreign exchange |
23 |
44 |
23 |
59 |
23 |
45 |
||||||||||
Equity |
16 |
31 |
18 |
44 |
18 |
47 |
||||||||||
Commodity |
11 |
21 |
11 |
20 |
8 |
24 |
||||||||||
Covariance adjustment(1)
|
N/A |
N/A |
N/A |
N/A |
N/A |
N/A |
||||||||||
Total Trading |
84 |
124 |
96 |
139 |
93 |
128 |
||||||||||
Total Trading and Credit Portfolio |
96 |
142 |
111 |
172 |
103 |
131 |
||||||||||
(1) |
No covariance adjustment can be inferred from the above table as the High and Low for each market factor will be from different close of business dates. |
In millions of dollars |
Sept. 30, 2014 |
||
Total—all market risk factors, including general and specific risk |
$ |
100 |
|
Average—during quarter |
$ |
102 |
|
High—during quarter |
121 |
||
Low—during quarter |
82 |
||
As of Jun. 30, 2014 |
As of September 30, 2014 |
GCB NCL Rate
|
||||||||||||||||||||
In billions of dollars |
Aggregate(1)
|
Aggregate(1)
|
Trading Account Assets(2)
|
Investment Securities(3)
|
ICG Loans(4)(5)
|
GCB Loans(4)
|
3Q'14 |
2Q'14 |
||||||||||||||
Mexico |
$ |
70.5 |
$ |
67.6 |
$ |
6.1 |
$ |
21.3 |
$ |
9.8 |
$ |
30.4 |
4.9 |
% |
4.7 |
% |
||||||
Korea |
42.1 |
39.0 |
(0.2 |
) |
11.3 |
3.8 |
24.1 |
0.9 |
0.9 |
|||||||||||||
Singapore |
30.7 |
31.4 |
0.3 |
6.4 |
9.9 |
14.9 |
0.2 |
0.3 |
||||||||||||||
Brazil |
29.4 |
27.4 |
3.2 |
4.7 |
15.4 |
3.9 |
5.5 |
5.5 |
||||||||||||||
Hong Kong |
27.4 |
27.1 |
1.4 |
4.3 |
10.9 |
10.5 |
0.6 |
0.4 |
||||||||||||||
India |
25.7 |
25.2 |
2.2 |
7.8 |
9.2 |
6.1 |
0.8 |
1.0 |
||||||||||||||
China |
22.8 |
22.3 |
2.3 |
3.9 |
11.1 |
5.0 |
0.3 |
0.8 |
||||||||||||||
Taiwan |
14.8 |
14.1 |
1.4 |
1.1 |
4.4 |
7.2 |
0.1 |
(0.1 |
) |
|||||||||||||
Poland |
9.8 |
11.2 |
1.1 |
5.2 |
1.9 |
3.0 |
0.2 |
0.2 |
||||||||||||||
Malaysia |
9.2 |
9.4 |
1.7 |
0.2 |
1.7 |
5.8 |
0.6 |
0.7 |
||||||||||||||
Russia(6)
|
8.9 |
8.8 |
0.7 |
0.8 |
5.8 |
1.6 |
2.8 |
2.4 |
||||||||||||||
Indonesia |
7.3 |
7.1 |
0.7 |
0.9 |
4.2 |
1.3 |
2.2 |
2.3 |
||||||||||||||
Turkey(7)
|
5.7 |
5.4 |
0.4 |
1.6 |
2.7 |
0.7 |
(0.1 |
) |
(0.1 |
) |
||||||||||||
Colombia |
5.0 |
5.2 |
0.1 |
0.5 |
2.1 |
2.4 |
3.5 |
3.5 |
||||||||||||||
Thailand |
4.9 |
4.9 |
0.6 |
1.3 |
1.0 |
2.0 |
2.6 |
2.2 |
||||||||||||||
UAE |
4.3 |
4.3 |
(0.1 |
) |
— |
2.9 |
1.5 |
2.6 |
1.9 |
|||||||||||||
Philippines |
3.0 |
3.2 |
0.3 |
0.3 |
1.6 |
1.0 |
4.2 |
4.2 |
||||||||||||||
South Africa |
2.8 |
3.0 |
0.4 |
0.5 |
2.1 |
— |
— |
— |
||||||||||||||
Argentina(6)
|
2.7 |
2.7 |
0.2 |
0.1 |
1.5 |
1.0 |
1.0 |
0.7 |
||||||||||||||
Nigeria |
2.4 |
2.7 |
0.2 |
0.5 |
1.9 |
— |
— |
— |
||||||||||||||
(1) |
Aggregate of Trading account assets, Investment securities, ICG loans and GCB loans.
|
(2) |
Trading account assets are shown on a net basis. Citi’s trading account assets will vary as it maintains inventory consistent with customer needs. |
(3) |
Investment securities include securities available-for-sale, recorded at fair market value, and securities held-to-maturity, recorded at historical cost. |
(4) |
Reflects funded loans, net of unearned income. In addition to the funded loans disclosed in the table above, through its ICG businesses, Citi had unfunded commitments to corporate customers in the emerging markets of approximately $34 billion as of September 30, 2014 (compared to $33 billion as of June 30, 2014); no country accounted for more than $4 billion of this amount.
|
(5) |
As of September 30, 2014, non-accrual loans represented 0.6% of total ICG loans in the emerging markets. For the countries in the table above, non-accrual loan ratios as of September 30, 2014 ranged from 0.0% to 0.4%, other than in Hong Kong and Brazil. In Hong Kong, the non-accrual loan ratio was 1.5% as of September 30, 2014 (compared to 1.3% as of June 30, 2014), primarily reflecting the impact of one counterparty. In Brazil, the non-accrual loan ratio was 1.6% as of September 30, 2014 (compared to 0.3% as of June 30, 2014), primarily reflecting the impact of one counterparty.
|
(6) |
For additional information on Citi’s cross-border risk relating to Russia and Argentina, see “Cross-Border Risk” below. |
(7) |
Investment securities in Turkey include Citi’s remaining $1.5 billion investment in Akbank T.A.S. For additional information, see Note 14 to the Consolidated Financial Statements in Citi’s 2013 Annual Report on Form 10-K. |
• |
Liquidity adjustments are applied to items in Level 2 or |
• |
Credit valuation adjustments (CVA) and, effective in the third quarter of 2014, funding valuation adjustments (FVA), are applied to over-the-counter (OTC) derivative instruments in which the base valuation generally discounts expected cash flows using the relevant base interest rate curve for the currency of the derivative (e.g., LIBOR for uncollateralized U.S. dollar derivatives). As not all counterparties have the same credit risk as that implied by the relevant base curve, a CVA is necessary to incorporate the market view of both counterparty credit risk and Citi’s own credit risk in the valuation. FVA reflects a market funding risk premium inherent in the uncollateralized portion of derivative portfolios, and in collateralized derivatives where the terms of the agreement do not permit the reuse of the collateral received. |
|
Credit and funding valuation adjustments
contra-liability (contra-asset)
|
||||||
In millions of dollars |
September 30, 2014 |
December 31, 2013 |
||||
Counterparty CVA |
$ |
(1,498 |
) |
$ |
(1,733 |
) |
Asset FVA |
(480 |
) |
— |
|||
Citigroup (own-credit) CVA |
555 |
651 |
||||
Liability FVA |
6 |
— |
||||
Total CVA—derivative instruments (1)
|
$ |
(1,417 |
) |
$ |
(1,082 |
) |
(1) |
FVA is included with CVA for presentation purposes. |
|
Credit/funding/debt valuation
adjustments gain (loss)
|
||||||||||||
Three Months Ended September 30, |
Nine Months Ended September 30, |
|||||||||||
In millions of dollars |
2014 |
2013 |
2014 |
2013 |
||||||||
Counterparty CVA |
$ |
(24 |
) |
$ |
(48 |
) |
$ |
46 |
$ |
175 |
||
Asset FVA |
(480 |
) |
— |
(480 |
) |
— |
||||||
Own-credit CVA |
15 |
(47 |
) |
(71 |
) |
(104 |
) |
|||||
Liability FVA |
6 |
— |
6 |
— |
||||||||
Total CVA—derivative instruments |
$ |
(483 |
) |
$ |
(95 |
) |
$ |
(499 |
) |
$ |
71 |
|
DVA related to own FVO liabilities |
$ |
112 |
$ |
(241 |
) |
$ |
102 |
$ |
(249 |
) |
||
Total CVA and DVA (1)
|
$ |
(371 |
) |
$ |
(336 |
) |
$ |
(397 |
) |
$ |
(178 |
) |
(1) |
FVA is included with CVA for presentation purposes. |
Fair values |
Notionals |
|||||||||||
In millions of dollars |
Receivable(1)
|
Payable(2)
|
Protection
purchased
|
Protection
sold
|
||||||||
By industry/counterparty |
||||||||||||
Banks |
$ |
23,873 |
$ |
22,466 |
$ |
653,487 |
$ |
668,108 |
||||
Broker-dealers |
7,568 |
8,475 |
222,820 |
213,263 |
||||||||
Non-financial |
210 |
224 |
7,440 |
5,720 |
||||||||
Insurance and other financial institutions |
9,304 |
10,278 |
332,932 |
274,895 |
||||||||
Total by industry/counterparty |
$ |
40,955 |
$ |
41,443 |
$ |
1,216,679 |
$ |
1,161,986 |
||||
By instrument |
||||||||||||
Credit default swaps and options |
$ |
40,656 |
$ |
39,973 |
$ |
1,195,756 |
$ |
1,155,278 |
||||
Total return swaps and other |
299 |
1,470 |
20,923 |
6,708 |
||||||||
Total by instrument |
$ |
40,955 |
$ |
41,443 |
$ |
1,216,679 |
$ |
1,161,986 |
||||
By rating |
||||||||||||
Investment grade |
$ |
16,559 |
$ |
16,465 |
$ |
903,015 |
$ |
867,548 |
||||
Non-investment grade |
24,396 |
24,978 |
313,664 |
294,438 |
||||||||
Total by rating |
$ |
40,955 |
$ |
41,443 |
$ |
1,216,679 |
$ |
1,161,986 |
||||
By maturity |
||||||||||||
Within 1 year |
$ |
3,038 |
$ |
3,347 |
$ |
273,173 |
$ |
249,306 |
||||
From 1 to 5 years |
33,191 |
33,639 |
859,538 |
842,025 |
||||||||
After 5 years |
4,726 |
4,457 |
83,968 |
70,655 |
||||||||
Total by maturity |
$ |
40,955 |
$ |
41,443 |
$ |
1,216,679 |
$ |
1,161,986 |
||||
(1) |
The fair value amount receivable is comprised of $14,522 million under protection purchased and $26,433 million under protection sold. |
(2) |
The fair value amount payable is comprised of $28,172 million under protection purchased and $13,271 million under protection sold. |
Fair values |
Notionals |
|||||||||||
In millions of dollars |
Receivable(1)
|
Payable(2)
|
Protection
purchased
|
Protection
sold
|
||||||||
By industry/counterparty |
||||||||||||
Banks |
$ |
24,992 |
$ |
23,455 |
$ |
739,646 |
$ |
727,748 |
||||
Broker-dealers |
8,840 |
9,820 |
254,250 |
224,073 |
||||||||
Non-financial |
138 |
162 |
4,930 |
2,820 |
||||||||
Insurance and other financial institutions |
6,447 |
7,922 |
216,236 |
188,722 |
||||||||
Total by industry/counterparty |
$ |
40,417 |
$ |
41,359 |
$ |
1,215,062 |
$ |
1,143,363 |
||||
By instrument |
||||||||||||
Credit default swaps and options |
$ |
40,233 |
$ |
39,930 |
$ |
1,201,716 |
$ |
1,141,864 |
||||
Total return swaps and other |
184 |
1,429 |
13,346 |
1,499 |
||||||||
Total by instrument |
$ |
40,417 |
$ |
41,359 |
$ |
1,215,062 |
$ |
1,143,363 |
||||
By rating |
||||||||||||
Investment grade |
$ |
17,150 |
$ |
17,174 |
$ |
812,918 |
$ |
752,640 |
||||
Non-investment grade |
23,267 |
24,185 |
402,144 |
390,723 |
||||||||
Total by rating |
$ |
40,417 |
$ |
41,359 |
$ |
1,215,062 |
$ |
1,143,363 |
||||
By maturity |
||||||||||||
Within 1 year |
$ |
2,901 |
$ |
3,262 |
$ |
254,305 |
$ |
221,562 |
||||
From 1 to 5 years |
31,674 |
32,349 |
883,879 |
853,391 |
||||||||
After 5 years |
5,842 |
5,748 |
76,878 |
68,410 |
||||||||
Total by maturity |
$ |
40,417 |
$ |
41,359 |
$ |
1,215,062 |
$ |
1,143,363 |
||||
(1) |
The fair value amount receivable is comprised of $13,744 million under protection purchased and $26,673 million under protection sold. |
(2) |
The fair value amount payable is comprised of $28,723 million under protection purchased and $12,636 million under protection sold. |
Jurisdiction/Component |
DTAs balance |
|||||
In billions of dollars |
September 30, 2014 |
December 31, 2013 |
||||
Total U.S. |
$ |
47.0 |
$ |
49.3 |
||
Total foreign |
2.9 |
3.5 |
||||
Total (1)
|
$ |
49.9 |
$ |
52.8 |
||
(1) |
Approximately $15.2 billion of the net DTAs was not deducted in calculating regulatory capital pursuant to full Basel III implementation standards as of September 30, 2014.
|
• |
ongoing legislative and regulatory changes and uncertainties faced by Citi in the U.S. and non-U.S. jurisdictions in which it operates, including in Mexico, and the potential impact these changes and uncertainties could have on economic conditions as well as Citi’s business planning, compliance risks and costs and overall results of operations; |
• |
continued uncertainty arising from numerous aspects of the regulatory capital requirements applicable to Citi, including those resulting from Citi’s continued implementation of the final U.S. Basel III rules, including the revised final U.S. Supplementary Leverage ratio, as well as any potential additional requirements, such as risk-based capital surcharges for U.S. “globally systemically important banks” (G-SIBs), and the ongoing regulatory review and approval of Citi’s credit, market and operational risk models, and the potential impact these uncertainties could have on Citi’s total risk-weighted assets, leverage assets and ability to meet its capital requirements as it projects or as required; |
• |
the potential impact of U.S. and international derivatives regulation, including as a result of any requirement to post margin for non-cleared swaps, on Citi’s competitiveness, compliance costs and regulatory and reputational risks and results of operations; |
• |
ongoing implementation of proprietary trading restrictions under the “Volcker Rule” and similar international proposals and the potential impact of these reforms and regulatory guidance on Citi’s global market-making businesses, results of operations and compliance risks and |
• |
the ongoing uncertainty and potential impact to Citi’s businesses, results of operations and capital and funding structure as a result of regulatory requirements in the U.S. and in non-U.S. jurisdictions to facilitate the future orderly resolution of large financial institutions, including Citi’s ability to revise its “living will” in order to meet regulatory requirements and/or implementation and maintenance of any minimum long-term debt requirements or “total loss absorbing capacity;” |
• |
additional regulations with respect to securitizations and the potential impact to Citi and its businesses, including with respect to any risk retention requirements; |
• |
continued uncertainty relating to the sustainability and pace of economic recovery and growth in the U.S. and globally and the potential impact fiscal and monetary actions taken by U.S. and non-U.S. authorities may have on economic recovery and growth, global trading markets and the emerging markets, as well as Citi’s businesses and results of operations, including net credit losses and loan loss reserves; |
• |
any significant global economic downturn or disruption, including a significant decline in global trade volumes, on Citi’s businesses, results of operations and financial condition, particularly as compared to Citi’s competitors; |
• |
uncertainty arising from the level of U.S. government debt or a potential U.S. government default or downgrade of the U.S. government credit rating on Citi’s businesses, results of operations, capital, funding and liquidity; |
• |
risks arising from Citi’s extensive operations outside of the U.S., including in the emerging markets such as in Mexico, Argentina, Venezuela and the Middle East, including as a result of mandatory loan loss or other reserve requirements, foreign exchange controls, sovereign debt defaults, limitations on foreign investments, sociopolitical instability, fraud, nationalization or loss of licenses, sanctions, criminal charges, closure of branches or subsidiaries and confiscation of assets, as well as increased compliance and regulatory risks and costs; |
• |
the potential impact on Citi’s businesses, financial condition or results of operations, including cost of credit, arising from ongoing instability in Russia and Ukraine, including actions by Citi to mitigate its exposures or risks or the imposition of additional sanctions, such as asset freezes, involving Russia or against Russian entities, business sectors, individuals or otherwise; |
• |
ongoing economic and fiscal issues in the Eurozone and the potential outcomes that could occur, including the exit of one or more countries from the European Monetary Union and any resulting redenomination/revaluation, and the potential impact, directly or indirectly, on Citi’s businesses, results of operations or financial condition; |
• |
continued uncertainty arising from numerous aspects of the regulatory liquidity requirements applicable to Citi and the potential impact these requirements could have on Citi’s liquidity ratios, planning, management and funding, |
• |
the potential impact to Citi’s businesses, results of operations and capital and funding structure due to regulatory proposals or changes to address perceived short-term wholesale funding risks, including as a result of the Net Stable Funding Ratio or margin requirements applicable to securities financing transactions; |
• |
potential impacts on Citi’s liquidity and/or costs of funding as a result of external factors, such as market disruptions, governmental fiscal and monetary policies and changes in Citi’s credit spreads; |
• |
reductions in Citi’s or its more significant subsidiaries’ credit ratings, including as a result of changes in assumptions relating to government support, and the potential impact on Citi’s funding and liquidity, as well as the results of operations for certain of its businesses; |
• |
the potential impact on Citi’s businesses, business practices, reputation, financial condition or results of operations that could result from the extensive legal and regulatory proceedings, investigations and inquiries to which Citi is or may be subject, including those related to Citi’s contribution to, or trading in products linked to, various rates, currencies or benchmarks and its anti-money laundering programs and activities, including any fines, penalties, criminal actions or other potential resolutions or sanctions; |
• |
the potential impact to Citi’s delinquency rates, loan loss reserves and net credit losses as Citi’s revolving home equity lines of credit continue to “reset,” and Citi’s ability to reduce or mitigate this reset risk going forward, including as a result of increasing interest rates or loans with higher loan-to-value ratios; |
• |
the results of the 2014 Comprehensive Capital Analysis and Review (CCAR) process, including Citi’s ability to address the Federal Reserve Board’s concerns regarding its capital planning process, and the impacts on Citi’s ability to return capital to shareholders and market perceptions of Citi; |
• |
Citi’s ability to successfully execute on and achieve its ongoing execution priorities and the potential impact its inability to do so, including as a result of factors it cannot control, could have on the achievement of its 2015 financial targets; |
• |
Citi’s ability to continue to utilize its deferred tax assets (DTAs), including the foreign tax credit component of its DTAs, and thus utilize the regulatory capital supporting its DTAs for more productive purposes; |
• |
the impact on the value of Citi’s DTAs if corporate tax rates in the U.S. or certain state or foreign jurisdictions decline, or if other changes are made to the U.S. tax system, such as changes to the tax treatment of foreign business income; |
• |
the possibility that Citi’s interpretation or application of the extensive tax laws to which it is subject, such as with respect to withholding tax obligations and stamp and other transactional taxes, could differ from that of the relevant governmental taxing authorities; |
• |
Citi’s failure to maintain its contractual relationships with various third-party retailers and merchants within its U.S. credit card businesses in North America GCB, and the potential impact any such failure could have on the results of operations or financial condition of those businesses;
|
• |
the potential impact to Citi from continually evolving and increasing cybersecurity and other technological risks and attacks, including data breaches, account fraud, additional costs, reputational damage, loss of customers, regulatory penalties and financial losses; |
• |
the potential impact on Citi’s performance, including its competitive position and ability to execute its strategy, if Citi is unable to hire or retain qualified employees; |
• |
incorrect assumptions or estimates in Citi’s financial statements, and the potential impact of regulatory or other changes to financial accounting and reporting standards on how Citi records and reports its financial condition and results of operations; |
• |
changes in the administration of or method for determining LIBOR on the value of any LIBOR-linked securities and other financial obligations held or issued by Citi; |
• |
the effectiveness of Citi’s risk management and mitigation processes and strategies, including the effectiveness of its risk models; and |
• |
Citi’s ability to successfully execute on its repositioning actions as well as its ongoing efficiency initiatives, including as a result of the strategic actions announced in the fourth quarter of 2014 to exit Citi’s consumer businesses in 11 markets plus its consumer finance business in Korea. |
CONSOLIDATED FINANCIAL STATEMENTS |
|
Consolidated Statement of Income (Unaudited)—For the Three and Nine Months Ended September 30, 2014 and 2013 |
|
Consolidated Statement of Comprehensive Income (Unaudited)—For the Three and Nine Months Ended September 30, 2014 and 2013 |
|
Consolidated Balance Sheet—September 30, 2014 (Unaudited) and December 31, 2013 |
|
Consolidated Statement of Changes in Stockholders’ Equity (Unaudited)—For the Nine Months Ended September 30, 2014 and 2013 |
|
Consolidated Statement of Cash Flows (Unaudited)—For the Nine Months Ended September 30, 2014 and 2013 |
|
NOTES TO CONSOLIDATED FINANCIAL STATEMENTS |
|
Note 1—Basis of Presentation |
|
Note 2—Discontinued Operations and Significant Disposals |
|
Note 3—Business Segments |
|
Note 4—Interest Revenue and Expense |
|
Note 5—Commissions and Fees |
|
Note 6—Principal Transactions |
|
Note 7—Incentive Plans |
|
Note 8—Retirement Benefits |
|
Note 9—Earnings per Share |
|
|
Note 10—Federal Funds, Securities Borrowed, Loaned and
Subject to Repurchase Agreements
|
|
Note 11—Brokerage Receivables and Brokerage Payables |
|
Note 12—Trading Account Assets and Liabilities |
|
Note 13—Investments |
|
Note 14—Loans |
|
Note 15—Allowance for Credit Losses |
|
Note 16—Goodwill and Intangible Assets |
|
Note 17—Debt |
|
|
Note 18—Changes in Accumulated Other Comprehensive
Income (Loss)
|
|
Note 19—Preferred Stock |
|
Note 20—Securitizations and Variable Interest Entities |
|
Note 21—Derivatives Activities |
|
Note 22—Fair Value Measurement |
|
Note 23—Fair Value Elections |
|
Note 24—Guarantees and Commitments |
|
Note 25—Contingencies |
|
Note 26—Subsequent Event |
|
Three Months Ended September 30, |
Nine Months Ended September 30, |
|||||||||||
In millions of dollars, except per share amounts |
2014 |
2013 |
2014 |
2013 |
||||||||
Revenues (1)
|
||||||||||||
Interest revenue |
$ |
15,512 |
$ |
15,463 |
$ |
46,423 |
$ |
47,263 |
||||
Interest expense |
3,325 |
3,952 |
10,531 |
12,440 |
||||||||
Net interest revenue |
$ |
12,187 |
$ |
11,511 |
$ |
35,892 |
$ |
34,823 |
||||
Commissions and fees |
$ |
3,280 |
$ |
3,061 |
$ |
9,905 |
$ |
9,789 |
||||
Principal transactions |
1,549 |
1,149 |
6,280 |
6,337 |
||||||||
Administration and other fiduciary fees |
1,029 |
968 |
3,067 |
3,119 |
||||||||
Realized gains on sales of investments, net |
136 |
63 |
348 |
764 |
||||||||
Other-than-temporary impairment losses on investments |
||||||||||||
Gross impairment losses |
(99 |
) |
(66 |
) |
(337 |
) |
(500 |
) |
||||
Less: Impairments recognized in AOCI |
8 |
27 |
8 |
38 |
||||||||
Net impairment losses recognized in earnings |
$ |
(91 |
) |
$ |
(39 |
) |
$ |
(329 |
) |
$ |
(462 |
) |
Insurance premiums |
$ |
530 |
$ |
556 |
$ |
1,613 |
$ |
1,728 |
||||
Other revenue |
984 |
635 |
2,294 |
2,542 |
||||||||
Total non-interest revenues |
$ |
7,417 |
$ |
6,393 |
$ |
23,178 |
$ |
23,817 |
||||
Total revenues, net of interest expense |
$ |
19,604 |
$ |
17,904 |
$ |
59,070 |
$ |
58,640 |
||||
Provisions for credit losses and for benefits and claims |
||||||||||||
Provision for loan losses |
$ |
1,575 |
$ |
1,652 |
$ |
4,947 |
$ |
5,693 |
||||
Policyholder benefits and claims |
205 |
204 |
595 |
635 |
||||||||
Provision (release) for unfunded lending commitments |
(30 |
) |
103 |
(88 |
) |
114 |
||||||
Total provisions for credit losses and for benefits and claims |
$ |
1,750 |
$ |
1,959 |
$ |
5,454 |
$ |
6,442 |
||||
Operating expenses (1)
|
||||||||||||
Compensation and benefits |
$ |
6,114 |
$ |
5,828 |
$ |
18,152 |
$ |
18,238 |
||||
Premises and equipment |
804 |
763 |
2,428 |
2,369 |
||||||||
Technology/communication |
1,630 |
1,568 |
4,779 |
4,584 |
||||||||
Advertising and marketing |
442 |
458 |
1,360 |
1,387 |
||||||||
Other operating |
3,965 |
3,062 |
13,906 |
9,538 |
||||||||
Total operating expenses |
$ |
12,955 |
$ |
11,679 |
$ |
40,625 |
$ |
36,116 |
||||
Income from continuing operations before income taxes |
$ |
4,899 |
$ |
4,266 |
$ |
12,991 |
$ |
16,082 |
||||
Provision for income taxes |
1,985 |
1,080 |
5,873 |
4,777 |
||||||||
Income from continuing operations |
$ |
2,914 |
$ |
3,186 |
$ |
7,118 |
$ |
11,305 |
||||
Discontinued operations |
||||||||||||
Income (loss) from discontinued operations |
$ |
(25 |
) |
$ |
33 |
$ |
12 |
$ |
(19 |
) |
||
Gain on sale |
— |
6 |
— |
62 |
||||||||
Provision for income taxes |
(9 |
) |
(53 |
) |
13 |
(46 |
) |
|||||
Income (loss) from discontinued operations, net of taxes |
$ |
(16 |
) |
$ |
92 |
$ |
(1 |
) |
$ |
89 |
||
Net income before attribution of noncontrolling interests |
$ |
2,898 |
$ |
3,278 |
$ |
7,117 |
$ |
11,394 |
||||
Noncontrolling interests |
59 |
51 |
154 |
177 |
||||||||
Citigroup’s net income |
$ |
2,839 |
$ |
3,227 |
$ |
6,963 |
$ |
11,217 |
||||
Basic earnings per share(2)
|
||||||||||||
Income from continuing operations |
$ |
0.89 |
$ |
0.98 |
$ |
2.14 |
$ |
3.55 |
||||
Income (loss) from discontinued operations, net of taxes |
(0.01 |
) |
0.03 |
— |
0.03 |
|||||||
Net income |
$ |
0.88 |
$ |
1.01 |
$ |
2.14 |
$ |
3.58 |
||||
Weighted average common shares outstanding |
3,029.5 |
3,034.3 |
3,033.5 |
3,038.4 |
||||||||
Diluted earnings per share(2)
|
||||||||||||
Income from continuing operations |
$ |
0.88 |
$ |
0.98 |
$ |
2.14 |
$ |
3.55 |
||||
Income (loss) from discontinued operations, net of taxes |
(0.01 |
) |
0.03 |
— |
0.03 |
|||||||
Net income |
$ |
0.88 |
$ |
1.00 |
$ |
2.14 |
$ |
3.57 |
||||
Adjusted weighted average common shares outstanding |
3,034.8 |
3,040.9 |
3,038.8 |
3,044.0 |
||||||||
(1) |
Certain prior period revenue and expense lines and totals were reclassified to conform to the current period’s presentation. See Note 3 to Notes to Consolidated Financial Statements. |
(2) |
Due to rounding, earnings per share on continuing operations and discontinued operations may not sum to earnings per share on net income. |
Three Months Ended September 30, |
Nine Months Ended September 30, |
|||||||||||
In millions of dollars |
2014 |
2013 |
2014 |
2013 |
||||||||
Net income before attribution of noncontrolling interests |
$ |
2,898 |
$ |
3,278 |
$ |
7,117 |
$ |
11,394 |
||||
Citigroup’s other comprehensive income (loss) |
||||||||||||
Net change in unrealized gains and losses on investment securities, net of taxes |
$ |
(207 |
) |
$ |
(8 |
) |
$ |
1,227 |
$ |
(1,906 |
) |
|
Net change in cash flow hedges, net of taxes |
28 |
330 |
266 |
952 |
||||||||
Benefit plans liability adjustment, net of taxes (1)
|
71 |
298 |
(106 |
) |
953 |
|||||||
Net change in foreign currency translation adjustment, net of taxes and hedges |
(1,721 |
) |
506 |
(2,230 |
) |
(1,901 |
) |
|||||
Citigroup’s total other comprehensive income (loss) |
$ |
(1,829 |
) |
$ |
1,126 |
$ |
(843 |
) |
$ |
(1,902 |
) |
|
Other comprehensive income (loss) attributable to noncontrolling interests |
||||||||||||
Net change in unrealized gains and losses on investment securities, net of taxes |
$ |
3 |
$ |
(3 |
) |
$ |
9 |
$ |
(29 |
) |
||
Net change in foreign currency translation adjustment, net of taxes |
(58 |
) |
34 |
(66 |
) |
(15 |
) |
|||||
Total other comprehensive income (loss) attributable to noncontrolling interests |
$ |
(55 |
) |
$ |
31 |
$ |
(57 |
) |
$ |
(44 |
) |
|
Total comprehensive income before attribution of noncontrolling interests |
$ |
1,014 |
$ |
4,435 |
$ |
6,217 |
$ |
9,448 |
||||
Total net income (loss) attributable to noncontrolling interests |
59 |
51 |
154 |
177 |
||||||||
Citigroup’s comprehensive income |
$ |
955 |
$ |
4,384 |
$ |
6,063 |
$ |
9,271 |
||||
September 30, |
||||||
2014 |
December 31, |
|||||
In millions of dollars |
(Unaudited) |
2013 |
||||
Assets |
||||||
Cash and due from banks (including segregated cash and other deposits) |
$ |
35,976 |
$ |
29,885 |
||
Deposits with banks |
143,068 |
169,005 |
||||
Federal funds sold and securities borrowed or purchased under agreements to resell (including $140,913 and $144,083 as of September 30, 2014 and December 31, 2013, respectively, at fair value) |
245,462 |
257,037 |
||||
Brokerage receivables |
39,298 |
25,674 |
||||
Trading account assets (including $107,829 and $106,695 pledged to creditors at September 30, 2014 and December 31, 2013, respectively) |
290,822 |
285,928 |
||||
Investments (including $21,188 and $26,989 pledged to creditors at September 30, 2014 and December 31, 2013, respectively, and $302,182 and $291,216 as of September 30, 2014 and December 31, 2013, respectively, at fair value) |
333,047 |
308,980 |
||||
Loans: |
||||||
Consumer (including $45 and $957 as of September 30, 2014 and December 31, 2013, respectively, at fair value) |
376,318 |
393,831 |
||||
Corporate (including $4,366 and $4,072 as of September 30, 2014 and December 31, 2013, respectively, at fair value) |
277,508 |
271,641 |
||||
Loans, net of unearned income |
$ |
653,826 |
$ |
665,472 |
||
Allowance for loan losses |
(16,915 |
) |
(19,648 |
) |
||
Total loans, net |
$ |
636,911 |
$ |
645,824 |
||
Goodwill |
24,500 |
25,009 |
||||
Intangible assets (other than MSRs) |
4,525 |
5,056 |
||||
Mortgage servicing rights (MSRs) |
2,093 |
2,718 |
||||
Other assets (including $8,254 and $7,123 as of September 30, 2014 and December 31, 2013, respectively, at fair value) |
127,147 |
125,266 |
||||
Total assets |
$ |
1,882,849 |
$ |
1,880,382 |
||
September 30, |
||||||
2014 |
December 31, |
|||||
In millions of dollars |
(Unaudited) |
2013 |
||||
Assets of consolidated VIEs to be used to settle obligations of consolidated VIEs |
||||||
Cash and due from banks |
$ |
203 |
$ |
362 |
||
Trading account assets |
806 |
977 |
||||
Investments |
9,949 |
10,950 |
||||
Loans, net of unearned income |
||||||
Consumer (including $0 and $910 as of September 30, 2014 and December 31, 2013, respectively, at fair value) |
63,788 |
63,493 |
||||
Corporate (including $2 and $14 as of September 30, 2014 and December 31, 2013, respectively, at fair value) |
31,033 |
31,919 |
||||
Loans, net of unearned income |
$ |
94,821 |
$ |
95,412 |
||
Allowance for loan losses |
(2,942 |
) |
(3,502 |
) |
||
Total loans, net |
$ |
91,879 |
$ |
91,910 |
||
Other assets |
1,052 |
1,234 |
||||
Total assets of consolidated VIEs to be used to settle obligations of consolidated VIEs |
$ |
103,889 |
$ |
105,433 |
||
September 30, |
||||||
2014 |
December 31, |
|||||
In millions of dollars, except shares and per share amounts |
(Unaudited) |
2013 |
||||
Liabilities |
||||||
Non-interest-bearing deposits in U.S. offices |
$ |
128,243 |
$ |
128,399 |
||
Interest-bearing deposits in U.S. offices (including $978 and $988 as of September 30, 2014 and December 31, 2013, respectively, at fair value) |
285,604 |
284,164 |
||||
Non-interest-bearing deposits in offices outside the U.S. |
71,228 |
69,406 |
||||
Interest-bearing deposits in offices outside the U.S. (including $813 and $689 as of September 30, 2014 and December 31, 2013, respectively, at fair value) |
457,580 |
486,304 |
||||
Total deposits |
$ |
942,655 |
$ |
968,273 |
||
Federal funds purchased and securities loaned or sold under agreements to repurchase (including $44,638 and $54,147 as of September 30, 2014 and December 31, 2013, respectively, at fair value) |
175,732 |
203,512 |
||||
Brokerage payables |
59,428 |
53,707 |
||||
Trading account liabilities |
137,272 |
108,762 |
||||
Short-term borrowings (including $1,454 and $3,692 as of September 30, 2014 and December 31, 2013, respectively, at fair value) |
64,838 |
58,944 |
||||
Long-term debt (including $26,455 and $26,877 as of September 30, 2014 and December 31, 2013, respectively, at fair value) |
223,842 |
221,116 |
||||
Other liabilities (including $2,725 and $2,011 as of September 30, 2014 and December 31, 2013, respectively, at fair value) |
65,191 |
59,935 |
||||
Total liabilities |
$ |
1,668,958 |
$ |
1,674,249 |
||
Stockholders’ equity |
||||||
Preferred stock ($1.00 par value; authorized shares: 30 million), issued shares: 358,720 as of September 30, 2014 and 269,520 as of December 31, 2013, at aggregate liquidation value
|
$ |
8,968 |
$ |
6,738 |
||
Common stock ($0.01 par value; authorized shares: 6 billion), issued shares: 3,082,034,822 as of September 30, 2014 and 3,062,098,976 as of December 31, 2013
|
31 |
31 |
||||
Additional paid-in capital |
107,839 |
107,193 |
||||
Retained earnings |
118,041 |
111,168 |
||||
Treasury stock, at cost: September 30, 2014—52,546,590 shares and December 31, 2013—32,856,062 shares
|
(2,631 |
) |
(1,658 |
) |
||
Accumulated other comprehensive income (loss) |
(19,976 |
) |
(19,133 |
) |
||
Total Citigroup stockholders’ equity |
$ |
212,272 |
$ |
204,339 |
||
Noncontrolling interest |
1,619 |
1,794 |
||||
Total equity |
$ |
213,891 |
$ |
206,133 |
||
Total liabilities and equity |
$ |
1,882,849 |
$ |
1,880,382 |
||
September 30, |
||||||
2014 |
December 31, |
|||||
In millions of dollars |
(Unaudited) |
2013 |
||||
Liabilities of consolidated VIEs for which creditors or beneficial interest holders do not have recourse to the general credit of Citigroup |
||||||
Short-term borrowings |
$ |
21,705 |
$ |
21,793 |
||
Long-term debt (including $2 and $909 as of September 30, 2014 and December 31, 2013, respectively, at fair value) |
40,227 |
34,743 |
||||
Other liabilities |
953 |
999 |
||||
Total liabilities of consolidated VIEs for which creditors or beneficial interest holders do not have recourse to the general credit of Citigroup |
$ |
62,885 |
$ |
57,535 |
||
Nine Months Ended September 30, |
||||||
In millions of dollars, except shares in thousands |
2014 |
2013 |
||||
Preferred stock at aggregate liquidation value |
||||||
Balance, beginning of year |
$ |
6,738 |
$ |
2,562 |
||
Issuance of new preferred stock |
2,230 |
2,775 |
||||
Redemption of preferred stock |
— |
$ |
(94 |
) |
||
Balance, end of period |
$ |
8,968 |
$ |
5,243 |
||
Common stock and additional paid-in capital |
||||||
Balance, beginning of year |
$ |
107,224 |
$ |
106,421 |
||
Employee benefit plans |
656 |
684 |
||||
Preferred stock issuance expense |
(24 |
) |
(44 |
) |
||
Other |
14 |
— |
||||
Balance, end of period |
$ |
107,870 |
$ |
107,061 |
||
Retained earnings |
||||||
Adjusted balance, beginning of period |
$ |
111,168 |
$ |
97,809 |
||
Citigroup’s net income |
6,963 |
11,217 |
||||
Common dividends (1)
|
(91 |
) |
(91 |
) |
||
Preferred dividends |
(352 |
) |
(123 |
) |
||
Tax benefit |
353 |
— |
||||
Balance, end of period |
$ |
118,041 |
$ |
108,812 |
||
Treasury stock, at cost |
||||||
Balance, beginning of year |
$ |
(1,658 |
) |
$ |
(847 |
) |
Employee benefit plans (2)
|
(121 |
) |
(6 |
) |
||
Treasury stock acquired (3)
|
(852 |
) |
(619 |
) |
||
Balance, end of period |
$ |
(2,631 |
) |
$ |
(1,472 |
) |
Citigroup’s accumulated other comprehensive income (loss) |
||||||
Balance, beginning of year |
$ |
(19,133 |
) |
$ |
(16,896 |
) |
|
Net change in Citigroup’s Accumulated other comprehensive income
(loss)
|
(843 |
) |
(1,902 |
) |
||
Balance, end of period |
$ |
(19,976 |
) |
$ |
(18,798 |
) |
Total Citigroup common stockholders’ equity |
$ |
203,304 |
$ |
195,603 |
||
Total Citigroup stockholders’ equity |
$ |
212,272 |
$ |
200,846 |
||
Noncontrolling interests |
||||||
Balance, beginning of year |
$ |
1,794 |
$ |
1,948 |
||
Initial origination of a noncontrolling interest |
— |
6 |
||||
Transactions between noncontrolling-interest shareholders and the related consolidated subsidiary |
— |
(2 |
) |
|||
Transactions between Citigroup and the noncontrolling-interest shareholders |
(80 |
) |
23 |
|||
Net income attributable to noncontrolling-interest shareholders |
154 |
177 |
||||
Dividends paid to noncontrolling-interest shareholders |
(91 |
) |
(63 |
) |
||
Net change in Accumulated other comprehensive income (loss)
|
(57 |
) |
(44 |
) |
||
Other |
(101 |
) |
(152 |
) |
||
Net change in noncontrolling interests |
$ |
(175 |
) |
$ |
(55 |
) |
Balance, end of period |
$ |
1,619 |
$ |
1,893 |
||
Total equity |
$ |
213,891 |
$ |
202,739 |
||
(1) |
Common dividends declared were $0.01 per share in the first, second and third quarters of 2014 and 2013.
|
(2) |
Includes treasury stock related to (i) certain activity on employee stock option program exercises where the employee delivers existing shares to cover the option exercise, or (ii) under Citi’s employee restricted or deferred stock programs where shares are withheld to satisfy tax requirements. |
(3) |
For the nine months ended September 30, 2014, primarily consists of open market purchases under Citi’s Board of Directors-approved common stock repurchase program.
|
Nine Months Ended September 30, |
||||||
In millions of dollars |
2014 |
2013 |
||||
Cash flows from operating activities of continuing operations |
||||||
Net income before attribution of noncontrolling interests |
$ |
7,117 |
$ |
11,394 |
||
Net income attributable to noncontrolling interests |
154 |
177 |
||||
Citigroup’s net income |
$ |
6,963 |
$ |
11,217 |
||
Income (loss) from discontinued operations, net of taxes |
(1 |
) |
54 |
|||
Gain on sale, net of taxes |
— |
35 |
||||
Income from continuing operations—excluding noncontrolling interests |
$ |
6,964 |
$ |
11,128 |
||
Adjustments to reconcile net income to net cash provided by operating activities of continuing operations |
||||||
Depreciation and amortization |
2,673 |
3,055 |
||||
Provision for credit losses |
4,859 |
5,807 |
||||
Realized gains from sales of investments |
(348 |
) |
(764 |
) |
||
Net impairment losses recognized in earnings |
331 |
462 |
||||
Change in trading account assets |
(4,894 |
) |
29,207 |
|||
Change in trading account liabilities |
28,510 |
6,499 |
||||
Change in federal funds sold and securities borrowed or purchased under agreements to resell |
11,575 |
(12,368 |
) |
|||
Change in federal funds purchased and securities loaned or sold under agreements to repurchase |
(27,780 |
) |
5,151 |
|||
Change in brokerage receivables net of brokerage payables |
(7,903 |
) |
(2,507 |
) |
||
Change in loans held-for-sale |
(1,989 |
) |
2,621 |
|||
Change in other assets |
22 |
14,747 |
||||
Change in other liabilities |
5,256 |
(4,466 |
) |
|||
Other, net |
867 |
737 |
||||
Total adjustments |
$ |
11,179 |
$ |
48,181 |
||
Net cash provided by operating activities of continuing operations |
$ |
18,143 |
$ |
59,309 |
||
Cash flows from investing activities of continuing operations |
||||||
Change in deposits with banks |
$ |
25,937 |
$ |
(70,525 |
) |
|
Change in loans |
(709 |
) |
(17,133 |
) |
||
Proceeds from sales and securitizations of loans |
3,481 |
7,589 |
||||
Purchases of investments |
(196,943 |
) |
(170,666 |
) |
||
Proceeds from sales of investments |
105,449 |
109,405 |
||||
Proceeds from maturities of investments |
66,759 |
64,657 |
||||
Capital expenditures on premises and equipment and capitalized software |
(2,474 |
) |
(2,349 |
) |
||
Proceeds from sales of premises and equipment, subsidiaries and affiliates, and repossessed assets |
460 |
455 |
||||
Net cash provided by (used in) investing activities of continuing operations |
$ |
1,960 |
$ |
(78,567 |
) |
|
Cash flows from financing activities of continuing operations |
||||||
Dividends paid |
$ |
(443 |
) |
$ |
(214 |
) |
Issuance of preferred stock |
2,230 |
2,775 |
||||
Redemption of preferred stock |
— |
(94 |
) |
|||
Treasury stock acquired |
(852 |
) |
(619 |
) |
||
Stock tendered for payment of withholding taxes |
(505 |
) |
(451 |
) |
||
Issuance of long-term debt |
48,046 |
41,765 |
||||
Payments and redemptions of long-term debt |
(40,943 |
) |
(51,164 |
) |
||
Change in deposits |
(25,618 |
) |
24,900 |
|||
Change in short-term borrowings |
5,404 |
159 |
||||
Net cash provided by (used in) investing activities of continuing operations |
$ |
(12,681 |
) |
$ |
17,057 |
|
Effect of exchange rate changes on cash and cash equivalents |
$ |
(1,331 |
) |
$ |
(1,432 |
) |
Discontinued operations |
||||||
Net cash used in discontinued operations |
$ |
— |
$ |
(10 |
) |
|
Change in cash and due from banks |
$ |
6,091 |
$ |
(3,643 |
) |
|
Cash and due from banks at beginning of period |
29,885 |
36,453 |
||||
Cash and due from banks at end of period |
$ |
35,976 |
$ |
32,810 |
||
Supplemental disclosure of cash flow information for continuing operations |
||||||
Cash paid during the year for income taxes |
$ |
3,687 |
$ |
3,253 |
||
Cash paid during the year for interest |
9,771 |
10,519 |
||||
Non-cash investing activities |
||||||
Change in loans due to consolidation/deconsolidation of VIEs |
$ |
(374 |
) |
$ |
6,718 |
|
Transfers to loans held-for-sale from loans |
10,700 |
14,200 |
||||
Transfers to OREO and other repossessed assets |
220 |
229 |
||||
Non-cash financing activities |
||||||
Increase in short-term borrowings due to consolidation of VIEs |
$ |
500 |
$ |
6,718 |
||
Decrease in long-term debt due to deconsolidation of VIEs |
(864 |
) |
— |
|||
Three Months Ended September 30, |
Nine Months Ended September 30, |
|||||||||||
In millions of dollars |
2014 |
2013 |
2014 |
2013 |
||||||||
Total revenues, net of interest expense(1)
|
$ |
1 |
$ |
223 |
$ |
70 |
$ |
738 |
||||
Income (loss) from discontinued operations |
$ |
(4 |
) |
$ |
36 |
$ |
65 |
$ |
143 |
|||
Provision (benefit) for income taxes |
(1 |
) |
12 |
12 |
49 |
|||||||
Income (loss) from discontinued operations, net of taxes |
$ |
(3 |
) |
$ |
24 |
$ |
53 |
$ |
94 |
|||
(1) |
Total revenues include gain or loss on sale, if applicable. |
Nine Months Ended September 30, |
||||||
In millions of dollars |
2014 |
2013 |
||||
Cash flows from operating activities |
$ |
— |
$ |
197 |
||
Cash flows from investing activities |
— |
(207 |
) |
|||
Cash flows from financing activities |
— |
— |
||||
Net cash provided by discontinued operations |
$ |
— |
$ |
(10 |
) |
|
Three Months Ended September 30, |
Nine Months Ended September 30, |
||||||||||
In millions of dollars |
2014 |
2013 |
2014 |
2013 |
|||||||
Total revenues, net of interest expense(1)
|
$ |
— |
$ |
8 |
$ |
— |
73 |
||||
Income (loss) from discontinued operations |
$ |
(4 |
) |
$ |
(21 |
) |
$ |
(8 |
) |
(152 |
) |
Gain on sale |
— |
6 |
— |
62 |
|||||||
Provision (benefit) for income taxes |
(1 |
) |
(5 |
) |
(3 |
) |
(28 |
) |
|||
Income (loss) from discontinued operations, net of taxes |
$ |
(3 |
) |
$ |
(10 |
) |
$ |
(5 |
) |
(62 |
) |
(1) |
Total revenues include gain or loss on sale, if applicable. |
Nine Months Ended September 30, |
||||||
In millions of dollars |
2014 |
2013 |
||||
Cash flows from operating activities |
$ |
— |
$ |
(43 |
) |
|
Cash flows from investing activities |
— |
— |
||||
Cash flows from financing activities |
— |
43 |
||||
Net cash provided by discontinued operations |
$ |
— |
$ |
— |
||
Three Months Ended September 30, |
Nine Months Ended September 30, |
|||||||||||
In millions of dollars |
2014 |
2013 |
2014 |
2013 |
||||||||
Total revenues, net of interest expense(1)
|
$ |
1 |
$ |
— |
$ |
5 |
$ |
— |
||||
Income (loss) from discontinued operations |
$ |
(17 |
) |
$ |
(9 |
) |
$ |
(45 |
) |
$ |
(37 |
) |
Provision (benefit) for income taxes |
(7 |
) |
(3 |
) |
(16 |
) |
(13 |
) |
||||
Income (loss) from discontinued operations, net of taxes |
$ |
(10 |
) |
$ |
(6 |
) |
$ |
(29 |
) |
$ |
(24 |
) |
(1) |
Total revenues include gain or loss on sale, if applicable. |
Three Months Ended September 30, |
Nine Months Ended September 30, |
|||||||||||
In millions of dollars |
2014 |
2013 |
2014 |
2013 |
||||||||
Total revenues, net of interest expense(1)
|
$ |
2 |
$ |
231 |
$ |
75 |
$ |
811 |
||||
Income (loss) from discontinued operations |
$ |
(25 |
) |
$ |
33 |
$ |
12 |
$ |
(19 |
) |
||
Gain on sale |
— |
6 |
— |
62 |
||||||||
Provision (benefit) for income taxes |
(9 |
) |
(53 |
) |
13 |
(46 |
) |
|||||
Income (loss) from discontinued operations, net of taxes |
$ |
(16 |
) |
$ |
92 |
$ |
(1 |
) |
$ |
89 |
||
(1) |
Total revenues include gain or loss on sale, if applicable. |
Nine Months Ended September 30, |
||||||
In millions of dollars |
2014 |
2013 |
||||
Cash flows used in operating activities |
$ |
— |
$ |
154 |
||
Cash flows from investing activities |
— |
(207 |
) |
|||
Cash flows from financing activities |
— |
43 |
||||
Net cash provided by discontinued operations |
$ |
— |
$ |
(10 |
) |
|
Three Months Ended September 30, |
Nine Months Ended September 30, |
|||||||||||
In millions of dollars |
2014 |
2013 |
2014 |
2013 |
||||||||
Income before taxes |
$ |
340 |
$ |
14 |
$ |
373 |
$ |
39 |
||||
Three Months Ended September 30, |
Nine Months Ended September 30, |
|||
In millions of dollars |
2014 |
2013 |
2014 |
2013 |
Income before taxes |
$173 |
$(9) |
$133 |
$(143) |
|
Revenues,
net of interest expense (1)
|
Provision (benefits)
for income taxes
|
Income (loss) from
continuing operations (2)
|
Identifiable assets |
|||||||||||||||||||||
Three Months Ended September 30, |
||||||||||||||||||||||||
In millions of dollars, except identifiable assets in billions |
2014 |
2013 |
2014 |
2013 |
2014 |
2013 |
September 30, 2014 |
December 31, 2013 |
||||||||||||||||
Global Consumer Banking |
$ |
9,637 |
$ |
9,232 |
$ |
1,004 |
$ |
797 |
$ |
1,937 |
$ |
1,535 |
$ |
401 |
$ |
405 |
||||||||
Institutional Clients Group |
8,371 |
7,372 |
1,019 |
605 |
2,333 |
1,740 |
1,047 |
1,045 |
||||||||||||||||
Corporate/Other |
8 |
42 |
(136 |
) |
(184 |
) |
(1,598 |
) |
20 |
332 |
313 |
|||||||||||||
Total Citicorp |
$ |
18,016 |
$ |
16,646 |
$ |
1,887 |
$ |
1,218 |
$ |
2,672 |
$ |
3,295 |
$ |
1,780 |
$ |
1,763 |
||||||||
Citi Holdings |
1,588 |
1,258 |
98 |
(138 |
) |
242 |
(109 |
) |
103 |
117 |
||||||||||||||
Total |
$ |
19,604 |
$ |
17,904 |
$ |
1,985 |
$ |
1,080 |
$ |
2,914 |
$ |
3,186 |
$ |
1,883 |
$ |
1,880 |
||||||||
|
Revenues,
net of interest expense (1)
|
Provision (benefits)
for income taxes
|
Income (loss) from
continuing operations (2)
|
||||||||||||||||
Nine Months Ended September 30, |
||||||||||||||||||
In millions of dollars |
2014 |
2013 |
2014 |
2013 |
2014 |
2013 |
||||||||||||
Global Consumer Banking |
$ |
28,311 |
$ |
28,696 |
$ |
2,578 |
$ |
2,687 |
$ |
5,269 |
$ |
5,222 |
||||||
Institutional Clients Group |
26,068 |
26,523 |
3,389 |
3,430 |
7,860 |
7,946 |
||||||||||||
Corporate/Other |
184 |
162 |
(146 |
) |
(304 |
) |
(2,488 |
) |
(374 |
) |
||||||||
Total Citicorp |
$ |
54,563 |
$ |
55,381 |
$ |
5,821 |
$ |
5,813 |
$ |
10,641 |
$ |
12,794 |
||||||
Citi Holdings |
4,507 |
3,259 |
52 |
(1,036 |
) |
(3,523 |
) |
(1,489 |
) |
|||||||||
Total |
$ |
59,070 |
$ |
58,640 |
$ |
5,873 |
$ |
4,777 |
$ |
7,118 |
$ |
11,305 |
||||||
(1) |
Includes Citicorp (excluding Corporate/Other) total revenues, net of interest expense, in North America of $8.1 billion and $7.1 billion; in EMEA of $2.6 billion and $2.5 billion; in Latin America of $3.4 billion and $3.4 billion; and in Asia of $3.9 billion and $3.6 billion for the three months ended September 30, 2014 and 2013, respectively. Includes Citicorp (excluding Corporate/Other) total revenues, net of interest expense, in North America of $24.5 billion and $24.1 billion; in EMEA of $8.5 billion and $9.1 billion; in Latin America of $10.2 billion and $10.5 billion; and in Asia of $11.2 billion and $11.5 billion for the nine months ended September 30, 2014 and 2013, respectively. Regional numbers exclude Citi Holdings and Corporate/Other, which largely operate within the U.S.
|
(2) |
Includes pretax provisions (credits) for credit losses and for benefits and claims in the GCB results of $1.4 billion and $1.7 billion; in the ICG results of $(21) million and $139 million; and in Citi Holdings results of $0.4 billion and $0.1 billion for the three months ended September 30, 2014 and 2013, respectively. Includes pretax provisions (credits) for credit losses and for benefits and claims in the GCB results of $4.5 billion and $5.0 billion; in the ICG results of $(106) million and $174 million; and in Citi Holdings results of $1.0 billion and $1.3 billion for the nine months ended September 30, 2014 and 2013, respectively.
|
Three Months Ended September 30, |
Nine Months Ended September 30, |
|||||||||||
In millions of dollars |
2014 |
2013 |
2014 |
2013 |
||||||||
Interest revenue |
||||||||||||
Loan interest, including fees |
$ |
11,187 |
$ |
11,308 |
$ |
33,729 |
$ |
34,033 |
||||
Deposits with banks |
235 |
255 |
737 |
763 |
||||||||
Federal funds sold and securities borrowed or purchased under agreements to resell |
567 |
617 |
1,753 |
2,007 |
||||||||
Investments, including dividends |
1,824 |
1,689 |
5,388 |
5,178 |
||||||||
Trading account assets(1)
|
1,484 |
1,491 |
4,424 |
4,790 |
||||||||
Other interest |
215 |
103 |
392 |
492 |
||||||||
Total interest revenue |
$ |
15,512 |
$ |
15,463 |
$ |
46,423 |
$ |
47,263 |
||||
Interest expense |
||||||||||||
Deposits(2)
|
$ |
1,417 |
$ |
1,490 |
$ |
4,335 |
$ |
4,749 |
||||
Federal funds purchased and securities loaned or sold under agreements to repurchase |
411 |
561 |
1,473 |
1,800 |
||||||||
Trading account liabilities(1)
|
38 |
46 |
127 |
131 |
||||||||
Short-term borrowings |
141 |
150 |
440 |
461 |
||||||||
Long-term debt |
1,318 |
1,705 |
4,156 |
5,299 |
||||||||
Total interest expense |
$ |
3,325 |
$ |
3,952 |
$ |
10,531 |
$ |
12,440 |
||||
Net interest revenue |
$ |
12,187 |
$ |
11,511 |
$ |
35,892 |
$ |
34,823 |
||||
Provision for loan losses |
1,575 |
1,652 |
4,947 |
5,693 |
||||||||
Net interest revenue after provision for loan losses |
$ |
10,612 |
$ |
9,859 |
$ |
30,945 |
$ |
29,130 |
||||
(1) |
Interest expense on Trading account liabilities of ICG is reported as a reduction of interest revenue from Trading account assets.
|
(2) |
Includes deposit insurance fees and charges of $234 million and $267 million for the three months ended September 30, 2014 and 2013, respectively, and $766 million and $855 million for the nine months ended September 30, 2014 and 2013, respectively.
|
Three Months Ended September 30, |
Nine Months Ended September 30, |
|||||||||||
In millions of dollars |
2014 |
2013 |
2014 |
2013 |
||||||||
Investment banking |
$ |
931 |
$ |
715 |
$ |
2,848 |
$ |
2,483 |
||||
Credit cards and bank cards |
570 |
606 |
1,698 |
1,862 |
||||||||
Trading-related |
664 |
609 |
2,010 |
1,981 |
||||||||
Trade and securities services |
469 |
462 |
1,396 |
1,381 |
||||||||
Other Consumer(1)
|
237 |
208 |
679 |
666 |
||||||||
Checking-related |
138 |
132 |
408 |
410 |
||||||||
Corporate finance(2)
|
113 |
124 |
389 |
415 |
||||||||
Loan servicing |
93 |
136 |
279 |
388 |
||||||||
Other |
65 |
69 |
198 |
203 |
||||||||
Total commissions and fees |
$ |
3,280 |
$ |
3,061 |
$ |
9,905 |
$ |
9,789 |
||||
(1) |
Primarily consists of fees for investment fund administration and management, third-party collections, commercial demand deposit accounts and certain credit card services. |
(2) |
Consists primarily of fees earned from structuring and underwriting loan syndications. |
Three Months Ended September 30, |
Nine Months Ended September 30, |
|||||||||||
In millions of dollars |
2014 |
2013 |
2014 |
2013 |
||||||||
Global Consumer Banking |
$ |
221 |
$ |
209 |
$ |
605 |
$ |
663 |
||||
Institutional Clients Group |
1,395 |
863 |
5,578 |
5,787 |
||||||||
Corporate/Other |
(221 |
) |
54 |
(205 |
) |
(113 |
) |
|||||
Subtotal Citicorp |
$ |
1,395 |
$ |
1,126 |
$ |
5,978 |
$ |
6,337 |
||||
Citi Holdings |
154 |
23 |
302 |
— |
||||||||
Total Citigroup |
$ |
1,549 |
$ |
1,149 |
$ |
6,280 |
$ |
6,337 |
||||
Interest rate contracts(1)
|
$ |
911 |
$ |
474 |
$ |
3,240 |
$ |
3,649 |
||||
Foreign exchange contracts(2)
|
464 |
579 |
1,637 |
1,737 |
||||||||
Equity contracts(3)
|
(9 |
) |
27 |
37 |
407 |
|||||||
Commodity and other contracts(4)
|
164 |
18 |
486 |
230 |
||||||||
Credit derivatives(5)
|
19 |
51 |
880 |
314 |
||||||||
Total |
$ |
1,549 |
$ |
1,149 |
$ |
6,280 |
$ |
6,337 |
||||
(1) |
Includes revenues from government securities and corporate debt, municipal securities, mortgage securities and other debt instruments. Also includes spot and forward trading of currencies and exchange-traded and over-the-counter (OTC) currency options, options on fixed income securities, interest rate swaps, currency swaps, swap options, caps and floors, financial futures, OTC options and forward contracts on fixed income securities. |
(2) |
Includes revenues from foreign exchange spot, forward, option and swap contracts, as well as FX translation gains and losses. |
(3) |
Includes revenues from common, preferred and convertible preferred stock, convertible corporate debt, equity-linked notes and exchange-traded and OTC equity options and warrants. |
(4) |
Primarily includes revenues from crude oil, refined oil products, natural gas and other commodities trades. |
(5) |
Includes revenues from structured credit products. |
Three Months Ended September 30, |
|||||||||||||||||||||||||||
Pension plans |
Postretirement benefit plans |
||||||||||||||||||||||||||
U.S. plans |
Non-U.S. plans |
U.S. plans |
Non-U.S. plans |
||||||||||||||||||||||||
In millions of dollars |
2014 |
2013 |
2014 |
2013 |
2014 |
2013 |
2014 |
2013 |
|||||||||||||||||||
Qualified plans |
|||||||||||||||||||||||||||
Benefits earned during the period |
$ |
1 |
$ |
— |
$ |
43 |
$ |
51 |
$ |
— |
$ |
— |
$ |
4 |
$ |
6 |
|||||||||||
Interest cost on benefit obligation |
132 |
140 |
93 |
95 |
8 |
8 |
30 |
31 |
|||||||||||||||||||
Expected return on plan assets |
(220 |
) |
(216 |
) |
(98 |
) |
(93 |
) |
— |
1 |
(31 |
) |
(29 |
) |
|||||||||||||
Amortization of unrecognized |
|||||||||||||||||||||||||||
Prior service (benefit) cost |
(1 |
) |
(1 |
) |
— |
2 |
— |
(1 |
) |
(3 |
) |
— |
|||||||||||||||
Net actuarial loss |
29 |
23 |
20 |
24 |
— |
— |
10 |
9 |
|||||||||||||||||||
Curtailment loss (1)
|
11 |
17 |
(5 |
) |
— |
— |
— |
— |
— |
||||||||||||||||||
Settlement (gain) loss (1)
|
— |
— |
26 |
— |
— |
— |
— |
— |
|||||||||||||||||||
Special termination benefits (1)
|
— |
— |
8 |
1 |
— |
— |
— |
— |
|||||||||||||||||||
Net qualified plans (benefit) expense |
$ |
(48 |
) |
$ |
(37 |
) |
$ |
87 |
$ |
80 |
$ |
8 |
$ |
8 |
$ |
10 |
$ |
17 |
|||||||||
Nonqualified plans expense |
$ |
10 |
$ |
10 |
$ |
— |
$ |
— |
$ |
— |
$ |
— |
$ |
— |
$ |
— |
|||||||||||
Total net (benefit) expense |
$ |
(38 |
) |
$ |
(27 |
) |
$ |
87 |
$ |
80 |
$ |
8 |
$ |
8 |
$ |
10 |
$ |
17 |
|||||||||
(1) |
Losses due to curtailment, settlement and special termination benefits relate to repositioning actions in the U.S. and certain countries outside the U.S. |
Nine Months Ended September 30, |
|||||||||||||||||||||||||||
Pension plans |
Postretirement benefit plans |
||||||||||||||||||||||||||
U.S. plans |
Non-U.S. plans |
U.S. plans |
Non-U.S. plans |
||||||||||||||||||||||||
In millions of dollars |
2014 |
2013 |
2014 |
2013 |
2014 |
2013 |
2014 |
2013 |
|||||||||||||||||||
Qualified plans |
|||||||||||||||||||||||||||
Benefits earned during the period |
$ |
4 |
$ |
6 |
$ |
136 |
$ |
158 |
$ |
— |
$ |
— |
$ |
11 |
$ |
31 |
|||||||||||
Interest cost on benefit obligation |
410 |
398 |
287 |
287 |
25 |
25 |
90 |
107 |
|||||||||||||||||||
Expected return on plan assets |
(656 |
) |
(645 |
) |
(291 |
) |
(298 |
) |
(1 |
) |
(1 |
) |
(92 |
) |
(101 |
) |
|||||||||||
Amortization of unrecognized |
|||||||||||||||||||||||||||
Prior service (benefit) cost |
(3 |
) |
(3 |
) |
2 |
4 |
— |
(1 |
) |
(9 |
) |
— |
|||||||||||||||
Net actuarial loss |
78 |
82 |
60 |
70 |
— |
— |
30 |
31 |
|||||||||||||||||||
Curtailment loss (1)
|
11 |
17 |
12 |
— |
— |
— |
— |
— |
|||||||||||||||||||
Settlement (gain) loss (1)
|
— |
— |
39 |
— |
— |
— |
(2 |
) |
— |
||||||||||||||||||
Special termination benefits (1)
|
— |
— |
8 |
1 |
— |
— |
— |
— |
|||||||||||||||||||
Net qualified plans (benefit) expense |
$ |
(156 |
) |
$ |
(145 |
) |
$ |
253 |
$ |
222 |
$ |
24 |
$ |
23 |
$ |
28 |
$ |
68 |
|||||||||
Nonqualified plans expense |
$ |
34 |
$ |
34 |
$ |
— |
$ |
— |
$ |
— |
$ |
— |
$ |
— |
$ |
— |
|||||||||||
Total net (benefit) expense |
$ |
(122 |
) |
$ |
(111 |
) |
$ |
253 |
$ |
222 |
$ |
24 |
$ |
23 |
$ |
28 |
$ |
68 |
|||||||||
Cumulative effect of change in |
— |
(23 |
) |
— |
— |
— |
— |
— |
3 |
||||||||||||||||||
accounting policy(2)
|
|||||||||||||||||||||||||||
Total adjusted net (benefit) expense |
$ |
(122 |
) |
$ |
(134 |
) |
$ |
253 |
$ |
222 |
$ |
24 |
$ |
23 |
$ |
28 |
$ |
71 |
|||||||||
(1) |
Losses due to curtailment, settlement and special termination benefits relate to repositioning actions in the U.S. and certain countries outside the U.S. |
(2) |
See Note 1 to the Consolidated Financial Statements in the Company’s 2013 Annual Report on Form 10-K for additional information on the change in accounting policy. |
Nine months ended September 30, 2014 |
|||||||||||||||
Pension plans |
Postretirement benefit plans |
||||||||||||||
In millions of dollars |
U.S. plans |
Non-U.S. plans |
U.S. plans |
Non-U.S. plans |
|||||||||||
Change in projected benefit obligation |
|||||||||||||||
Projected benefit obligation at beginning of year |
$ |
12,829 |
$ |
7,194 |
$ |
780 |
$ |
1,411 |
|||||||
Plans measured annually |
(692 |
) |
(3,473 |
) |
— |
(357 |
) |
||||||||
Projected benefit obligation at beginning of year - Significant Plans |
$ |
12,137 |
$ |
3,721 |
$ |
780 |
$ |
1,054 |
|||||||
First quarter activity |
215 |
69 |
1 |
56 |
|||||||||||
Second quarter activity |
350 |
191 |
62 |
106 |
|||||||||||
Projected benefit obligation at June 30, 2014 - Significant Plans |
$ |
12,702 |
$ |
3,981 |
$ |
843 |
$ |
1,216 |
|||||||
Benefits earned during the period |
1 |
10 |
— |
3 |
|||||||||||
Interest cost on benefit obligation |
132 |
56 |
8 |
24 |
|||||||||||
Actuarial (gain) loss |
— |
13 |
1 |
(43 |
) |
||||||||||
Benefits paid, net of participants’ contributions |
(177 |
) |
(44 |
) |
(21 |
) |
(14 |
) |
|||||||
Curtailment (gain) loss |
12 |
— |
— |
— |
|||||||||||
Foreign exchange impact and other |
— |
(178 |
) |
— |
(41 |
) |
|||||||||
Projected benefit obligation at September 30, 2014 - Significant Plans |
$ |
12,670 |
$ |
3,838 |
$ |
831 |
$ |
1,145 |
|||||||
Nine Months Ended September 30, 2014 |
|||||||||||||||
Pension plans |
Postretirement benefit plans |
||||||||||||||
In millions of dollars |
U.S. plans |
Non-U.S. plans |
U.S. plans |
Non-U.S. plans |
|||||||||||
Change in plan assets |
|||||||||||||||
Plan assets at fair value at beginning of year |
$ |
12,731 |
$ |
6,918 |
$ |
32 |
$ |
1,472 |
|||||||
Plans measured annually |
— |
(2,589 |
) |
— |
(11 |
) |
|||||||||
Plan assets at fair value at beginning of year - Significant Plans |
$ |
12,731 |
$ |
4,329 |
$ |
32 |
$ |
1,461 |
|||||||
First quarter activity |
96 |
69 |
(4 |
) |
(10 |
) |
|||||||||
Second quarter activity |
192 |
241 |
(4 |
) |
89 |
||||||||||
Plan assets at fair value at June 30, 2014 - Significant Plans |
$ |
13,019 |
$ |
4,639 |
$ |
24 |
$ |
1,540 |
|||||||
Actual return on plan assets |
66 |
174 |
— |
(14 |
) |
||||||||||
Company contributions |
100 |
13 |
14 |
— |
|||||||||||
Benefits paid |
(177 |
) |
(44 |
) |
(21 |
) |
(182 |
) |
|||||||
Foreign exchange impact and other |
— |
(212 |
) |
— |
115 |
||||||||||
Plan assets at fair value at September 30, 2014 - Significant Plans |
$ |
13,008 |
$ |
4,570 |
$ |
17 |
$ |
1,459 |
|||||||
Funded status of the plans at September 30, 2014 (1) - Significant Plans
|
$ |
338 |
$ |
732 |
$ |
(814 |
) |
$ |
314 |
||||||
Net amount recognized |
|||||||||||||||
Benefit asset |
$ |
338 |
$ |
732 |
$ |
— |
$ |
314 |
|||||||
Benefit liability |
— |
— |
(814 |
) |
— |
||||||||||
Net amount recognized on the balance sheet - Significant Plans |
$ |
338 |
$ |
732 |
$ |
(814 |
) |
$ |
314 |
||||||
Amounts recognized in Accumulated other comprehensive income (loss)
|
|||||||||||||||
Prior service benefit (cost) |
$ |
4 |
$ |
27 |
$ |
— |
$ |
158 |
|||||||
Net actuarial gain (loss) |
(4,419 |
) |
(986 |
) |
51 |
(499 |
) |
||||||||
Net amount recognized in equity (pretax) - Significant Plans |
$ |
(4,415 |
) |
$ |
(959 |
) |
$ |
51 |
$ |
(341 |
) |
||||
Accumulated benefit obligation at September 30, 2014 - Significant Plans |
$ |
12,661 |
$ |
3,735 |
N/A |
N/A |
|||||||||
(1) |
The U.S. qualified pension plan is fully funded under specified Employee Retirement Income Security Act (ERISA) funding rules as of January 1, 2014 and no minimum required funding is expected for 2014. |
Three Months Ended |
Nine Months Ended |
|||||
In millions of dollars |
September 30, 2014 |
September 30, 2014 |
||||
Beginning of period balance, net of tax (1) (2)
|
$ |
(4,166 |
) |
$ |
(3,989 |
) |
Actuarial assumptions changes and plan experience |
23 |
(988 |
) |
|||
Net asset gain (loss) due to difference between actual and expected returns |
(103 |
) |
328 |
|||
Net amortizations |
52 |
151 |
||||
Curtailment/ settlement loss (3)
|
30 |
58 |
||||
Foreign exchange impact and other |
105 |
264 |
||||
Change in deferred taxes, net |
(36 |
) |
81 |
|||
Change, net of tax |
$ |
71 |
$ |
(106 |
) |
|
End of period balance, net of tax (1) (2)
|
$ |
(4,095 |
) |
$ |
(4,095 |
) |
(3) |
Curtailment and settlement losses relate to repositioning actions in the U.S. and certain countries outside the U.S. |
Net benefit (expense) assumed discount rates during the period(1)
|
Three Months Ended |
Year Ended |
||
Sept. 30, 2014 |
Jun. 30, 2014 |
Mar. 31, 2014 |
Dec. 31, 2013 |
|
U.S. plans |
||||
Pension |
4.25% |
4.55% |
4.75% |
4.80% |
Postretirement |
3.95 |
4.15 |
4.35 |
4.30 |
Non-U.S. plans |
||||
Pension |
4.30 - 8.00 |
4.40 - 8.50 |
4.50 - 8.80 |
4.50 - 8.90 |
Weighted average |
5.95 |
6.21 |
6.41 |
6.49 |
Postretirement |
8.40 |
8.90 |
9.40 |
8.90 |
Plan obligations assumed discount rates at period ended (1)
|
||||
Sept. 30, 2014 |
Jun. 30, 2014 |
Mar. 30, 2014 |
Dec. 31, 2013 |
|
U.S. plans |
||||
Pension |
4.25% |
4.25% |
4.55% |
4.75% |
Postretirement |
4.00 |
3.95 |
4.15 |
4.35 |
Non-U.S. plans |
||||
Pension |
4.10 - 8.30 |
4.30 - 8.00 |
4.40 - 8.50 |
4.50 - 8.80 |
Weighted average |
5.94 |
5.95 |
6.21 |
6.41 |
Postretirement |
8.70 |
8.40 |
8.90 |
9.40 |
(1) |
For the Significant Plans, the September 30, 2014 rates shown above are utilized to calculate the September 30, 2014 benefit obligation and will be utilized to calculate the 2014 fourth quarter expense. The rates shown above for the year ended 2013 were utilized to calculate the first quarter 2014 expense. The March 31 and June 30, 2014 rates were utilized to calculate the 2014 second and third quarter expense, respectively.
|
Three Months Ended September 30, 2014 |
||
In millions of dollars |
One-percentage-point increase |
One-percentage-point decrease |
U.S. plans |
$7 |
$(11) |
Non-U.S. plans |
(3) |
4 |
Pension plans |
Postretirement benefit plans |
||||||||||||||||||||||||||||||
U.S. plans (1)
|
Non-U.S. plans |
U.S. plans |
Non-U.S. plans |
||||||||||||||||||||||||||||
In millions of dollars |
2014 |
2013 (3)
|
2014 |
2013 (3)
|
2014 |
2013 (3)
|
2014 |
2013 (3)
|
|||||||||||||||||||||||
Company contributions(2) for the nine months ended September 30
|
$ |
139 |
$ |
32 |
$ |
164 |
$ |
282 |
$ |
34 |
$ |
49 |
$ |
2 |
$ |
244 |
|||||||||||||||
Company contributions expected for the remainder of the year |
$ |
12 |
$ |
11 |
$ |
43 |
$ |
57 |
$ |
17 |
$ |
16 |
$ |
10 |
$ |
1 |
|||||||||||||||
(1) |
The U.S. pension plans include benefits paid directly by the Company for the nonqualified pension plans. |
(2) |
Company contributions are composed of cash contributions made to the plans and benefits paid directly to participants by the Company. |
(3) |
For the year ended December 31, 2013, actual Company contributions amounted to $51 million and $357 million for the U.S. pension and Non-U.S. pension plans, respectively. For the year ended December 31, 2013, actual Company contributions amounted to $52 million and $256 million for the U.S. postretirement and Non-U.S. postretirement plans, respectively.
|
Three Months Ended September 30, |
Nine Months Ended September 30, |
||||||||||||||
In millions of dollars |
2014 |
2013 |
2014 |
2013 |
|||||||||||
Service related expense |
|||||||||||||||
Benefits earned during the period |
$ |
— |
$ |
6 |
$ |
— |
$ |
19 |
|||||||
Interest cost on benefit obligation |
2 |
3 |
4 |
9 |
|||||||||||
Amortization of unrecognized |
|||||||||||||||
Prior service cost |
(8 |
) |
1 |
(23 |
) |
5 |
|||||||||
Net actuarial loss |
3 |
4 |
10 |
10 |
|||||||||||
Total service related (benefit) expense |
$ |
(3 |
) |
$ |
14 |
$ |
(9 |
) |
$ |
43 |
|||||
Non-service related expense |
$ |
4 |
$ |
7 |
$ |
21 |
$ |
20 |
|||||||
Total net expense |
$ |
1 |
$ |
21 |
$ |
12 |
$ |
63 |
|||||||
Three Months Ended September 30, |
Nine Months Ended September 30, |
|||||||||||
In millions, except per-share amounts |
2014 |
2013 |
2014 |
2013 |
||||||||
Income from continuing operations before attribution of noncontrolling interests |
$ |
2,914 |
$ |
3,186 |
$ |
7,118 |
$ |
11,305 |
||||
Less: Noncontrolling interests from continuing operations |
59 |
51 |
154 |
177 |
||||||||
Net income from continuing operations (for EPS purposes) |
$ |
2,855 |
$ |
3,135 |
$ |
6,964 |
$ |
11,128 |
||||
Income (loss) from discontinued operations, net of taxes |
(16 |
) |
92 |
(1 |
) |
89 |
||||||
Citigroup's net income |
$ |
2,839 |
$ |
3,227 |
$ |
6,963 |
$ |
11,217 |
||||
Less: Preferred dividends(1)
|
128 |
110 |
352 |
123 |
||||||||
Net income available to common shareholders |
$ |
2,711 |
$ |
3,117 |
$ |
6,611 |
$ |
11,094 |
||||
Less: Dividends and undistributed earnings allocated to employee restricted and deferred shares with nonforfeitable rights to dividends, applicable to basic EPS |
44 |
61 |
108 |
217 |
||||||||
Net income allocated to common shareholders for basic EPS |
$ |
2,667 |
$ |
3,056 |
$ |
6,503 |
$ |
10,877 |
||||
Add: Interest expense, net of tax, and dividends on convertible securities and adjustment of undistributed earnings allocated to employee restricted and deferred shares with nonforfeitable rights to dividends, applicable to diluted EPS |
— |
— |
— |
2 |
||||||||
Net income allocated to common shareholders for diluted EPS |
$ |
2,667 |
$ |
3,056 |
$ |
6,503 |
$ |
10,879 |
||||
Weighted-average common shares outstanding applicable to basic EPS |
3,029.5 |
3,034.3 |
3,033.5 |
3,038.4 |
||||||||
Effect of dilutive securities |
||||||||||||
Options(2)
|
5.1 |
6.1 |
5.0 |
5.0 |
||||||||
Other employee plans |
0.2 |
0.5 |
0.3 |
0.5 |
||||||||
Convertible securities(3)
|
— |
— |
— |
0.1 |
||||||||
Adjusted weighted-average common shares outstanding applicable to diluted EPS |
3,034.8 |
3,040.9 |
3,038.8 |
3,044.0 |
||||||||
Basic earnings per share(4)
|
||||||||||||
Income from continuing operations |
$ |
0.89 |
$ |
0.98 |
$ |
2.14 |
$ |
3.55 |
||||
Discontinued operations |
(0.01 |
) |
0.03 |
— |
0.03 |
|||||||
Net income |
$ |
0.88 |
$ |
1.01 |
$ |
2.14 |
$ |
3.58 |
||||
Diluted earnings per share(4)
|
||||||||||||
Income from continuing operations |
$ |
0.88 |
$ |
0.98 |
$ |
2.14 |
$ |
3.55 |
||||
Discontinued operations |
(0.01 |
) |
0.03 |
— |
0.03 |
|||||||
Net income |
$ |
0.88 |
$ |
1.00 |
$ |
2.14 |
$ |
3.57 |
||||
(1) |
See Note 19 to the Consolidated Financial Statements for the potential future impact of preferred stock dividends. |
(2) |
During the third quarters of 2014 and 2013, weighted-average options to purchase 1.9 million and 1.5 million shares of common stock, respectively, were outstanding but not included in the computation of earnings per share because the weighted-average exercise prices of $157.90 and $214.30, respectively, were anti-dilutive.
|
(3) |
Warrants issued to the U.S. Treasury as part of the Troubled Asset Relief Program (TARP) and the loss-sharing agreement (all of which were subsequently sold to the public in January 2011), with an exercise price of $178.50 and $106.10 for approximately 21.0 million and 25.5 million shares of Citigroup common stock, respectively, were not included in the computation of earnings per share in the third quarters of 2014 and 2013 because they were anti-dilutive.
|
(4) |
Due to rounding, earnings per share on continuing operations and discontinued operations may not sum to earnings per share on net income. |
In millions of dollars |
September 30, 2014 |
December 31, 2013 |
||||
Federal funds sold |
$ |
— |
$ |
20 |
||
Securities purchased under agreements to resell |
125,302 |
136,649 |
||||
Deposits paid for securities borrowed |
120,160 |
120,368 |
||||
Total |
$ |
245,462 |
$ |
257,037 |
||
In millions of dollars |
September 30, 2014 |
December 31, 2013 |
||||
Federal funds purchased |
$ |
491 |
$ |
910 |
||
Securities sold under agreements to repurchase |
148,870 |
175,691 |
||||
Deposits received for securities loaned |
26,371 |
26,911 |
||||
Total |
$ |
175,732 |
$ |
203,512 |
||
As of September 30, 2014 |
|||||||||||||||
In millions of dollars |
Gross amounts of recognized assets |
Gross amounts offset on the Consolidated Balance Sheet(1) |
Net amounts of assets included on the Consolidated Balance Sheet(2) |
Amounts not offset on the Consolidated Balance Sheet but eligible for offsetting upon counterparty default(3) |
Net amounts(4) |
||||||||||
Securities purchased under agreements to resell |
$ |
179,360 |
$ |
54,058 |
$ |
125,302 |
$ |
89,901 |
$ |
35,401 |
|||||
Deposits paid for securities borrowed |
120,160 |
— |
120,160 |
17,653 |
102,507 |
||||||||||
Total |
$ |
299,520 |
$ |
54,058 |
$ |
245,462 |
$ |
107,554 |
$ |
137,908 |
|||||
In millions of dollars |
Gross amounts of recognized liabilities |
Gross amounts offset on the Consolidated Balance Sheet(1) |
Net amounts of liabilities included on the Consolidated Balance Sheet(2) |
Amounts not offset on the Consolidated Balance Sheet but eligible for offsetting upon counterparty default(3) |
Net amounts(4) |
||||||||||
Securities sold under agreements to repurchase |
$ |
202,928 |
$ |
54,058 |
$ |
148,870 |
$ |
64,433 |
$ |
84,437 |
|||||
Deposits received for securities loaned |
26,371 |
— |
26,371 |
4,537 |
21,834 |
||||||||||
Total |
$ |
229,299 |
$ |
54,058 |
$ |
175,241 |
$ |
68,970 |
$ |
106,271 |
|||||
As of December 31, 2013 |
|||||||||||||||
In millions of dollars |
Gross amounts of recognized assets |
Gross amounts offset on the Consolidated Balance Sheet(1) |
Net amounts of assets included on the Consolidated Balance Sheet(2) |
Amounts not offset on the Consolidated Balance Sheet but eligible for offsetting upon counterparty default(3) |
Net amounts(4) |
||||||||||
Securities purchased under agreements to resell |
$ |
179,894 |
$ |
43,245 |
$ |
136,649 |
$ |
105,226 |
$ |
31,423 |
|||||
Deposits paid for securities borrowed |
120,368 |
— |
120,368 |
26,728 |
93,640 |
||||||||||
Total |
$ |
300,262 |
$ |
43,245 |
$ |
257,017 |
$ |
131,954 |
$ |
125,063 |
|||||
In millions of dollars |
Gross amounts of recognized liabilities |
Gross amounts offset on the Consolidated Balance Sheet(1) |
Net amounts of liabilities included on the Consolidated Balance Sheet(2) |
Amounts not offset on the Consolidated Balance Sheet but eligible for offsetting upon counterparty default(3) |
Net amounts(4) |
||||||||||
Securities sold under agreements to repurchase |
$ |
218,936 |
$ |
43,245 |
$ |
175,691 |
$ |
80,082 |
$ |
95,609 |
|||||
Deposits received for securities loaned |
26,911 |
— |
26,911 |
3,833 |
23,078 |
||||||||||
Total |
$ |
245,847 |
$ |
43,245 |
$ |
202,602 |
$ |
83,915 |
$ |
118,687 |
|||||
(1) |
Includes financial instruments subject to enforceable master netting agreements that are permitted to be offset under ASC 210-20-45. |
(2) |
The total of this column for each period excludes Federal funds sold/purchased. See table on prior page. |
(3) |
Includes financial instruments subject to enforceable master netting agreements that are not permitted to be offset under ASC 210-20-45 but would be eligible for offsetting to the extent an event of default has occurred and a legal opinion supporting enforceability of the offsetting right has been obtained. |
(4) |
Remaining exposures continue to be secured by financial collateral, but the Company may not have sought or been able to obtain a legal opinion evidencing enforceability of the offsetting right. |
In millions of dollars |
September 30, 2014 |
December 31, 2013 |
||||
Receivables from customers |
$ |
12,774 |
$ |
5,811 |
||
Receivables from brokers, dealers, and clearing organizations |
26,524 |
19,863 |
||||
Total brokerage receivables (1)
|
$ |
39,298 |
$ |
25,674 |
||
Payables to customers |
$ |
36,010 |
$ |
34,751 |
||
Payables to brokers, dealers, and clearing organizations |
23,418 |
18,956 |
||||
Total brokerage payables (1)
|
$ |
59,428 |
$ |
53,707 |
||
(1) |
Brokerage receivables and payables are accounted for in accordance with ASC 940-320. |
In millions of dollars |
September 30, 2014 |
December 31, 2013 |
||||
Trading account assets |
||||||
Mortgage-backed securities(1)
|
||||||
U.S. government-sponsored agency guaranteed |
$ |
19,779 |
$ |
23,955 |
||
Prime |
1,371 |
1,422 |
||||
Alt-A |
602 |
721 |
||||
Subprime |
1,211 |
1,211 |
||||
Non-U.S. residential |
702 |
723 |
||||
Commercial |
2,962 |
2,574 |
||||
Total mortgage-backed securities |
$ |
26,627 |
$ |
30,606 |
||
U.S. Treasury and federal agency securities |
||||||
U.S. Treasury |
$ |
19,664 |
$ |
13,537 |
||
Agency obligations |
2,049 |
1,300 |
||||
Total U.S. Treasury and federal agency securities |
$ |
21,713 |
$ |
14,837 |
||
State and municipal securities |
$ |
2,713 |
$ |
3,207 |
||
Foreign government securities |
76,133 |
74,856 |
||||
Corporate |
28,388 |
30,534 |
||||
Derivatives(2)
|
57,694 |
52,821 |
||||
Equity securities |
55,662 |
61,776 |
||||
Asset-backed securities(1)
|
4,653 |
5,616 |
||||
Other trading assets(3)
|
17,239 |
11,675 |
||||
Total trading account assets |
$ |
290,822 |
$ |
285,928 |
||
Trading account liabilities |
||||||
Securities sold, not yet purchased |
$ |
78,561 |
$ |
61,508 |
||
Derivatives(2)
|
58,711 |
47,254 |
||||
Total trading account liabilities |
$ |
137,272 |
$ |
108,762 |
||
(1) |
The Company invests in mortgage-backed and asset-backed securities. These securitizations are generally considered VIEs. The Company’s maximum exposure to loss from these VIEs is equal to the carrying amount of the securities, which is reflected in the table above. For mortgage-backed and asset-backed securitizations in which the Company has other involvement, see Note 20 to the Consolidated Financial Statements. |
(2) |
Presented net, pursuant to enforceable master netting agreements. See Note 21 to the Consolidated Financial Statements for a discussion regarding the accounting and reporting for derivatives. |
(3) |
Includes investments in unallocated precious metals, as discussed in Note 23 to the Consolidated Financial Statements. Also includes physical commodities accounted for at the lower of cost or fair value. |
In millions of dollars |
September 30, 2014 |
December 31, 2013 |
||||
Securities available-for-sale (AFS) |
$ |
298,678 |
$ |
286,511 |
||
Debt securities held-to-maturity (HTM)(1)
|
24,038 |
10,599 |
||||
Non-marketable equity securities carried at fair value(2)
|
3,504 |
4,705 |
||||
Non-marketable equity securities carried at cost(3)
|
6,827 |
7,165 |
||||
Total investments |
$ |
333,047 |
$ |
308,980 |
||
(1) |
Recorded at amortized cost less impairment for securities that have credit-related impairment. |
(2) |
Unrealized gains and losses for non-marketable equity securities carried at fair value are recognized in earnings. |
(3) |
Non-marketable equity securities carried at cost primarily consist of shares issued by the Federal Reserve Bank, Federal Home Loan Banks, foreign central banks and various clearing houses of which Citigroup is a member. |
Three Months Ended September 30, |
Nine Months Ended September 30, |
|||||||||||
In millions of dollars |
2014 |
2013 |
2014 |
2013 |
||||||||
Taxable interest |
$ |
1,627 |
$ |
1,389 |
$ |
4,638 |
$ |
4,280 |
||||
Interest exempt from U.S. federal income tax |
96 |
197 |
407 |
567 |
||||||||
Dividends |
101 |
103 |
343 |
331 |
||||||||
Total interest and dividends |
$ |
1,824 |
$ |
1,689 |
$ |
5,388 |
$ |
5,178 |
||||
Three Months Ended September 30, |
Nine Months Ended September 30, |
|||||||||||
In millions of dollars |
2014 |
2013 |
2014 |
2013 |
||||||||
Gross realized investment gains |
$ |
229 |
$ |
375 |
$ |
689 |
$ |
1,489 |
||||
Gross realized investment losses |
(93 |
) |
(312 |
) |
(341 |
) |
(725 |
) |
||||
Net realized gains on sale of investments |
$ |
136 |
$ |
63 |
$ |
348 |
$ |
764 |
||||
Three Months Ended September 30, |
Nine Months Ended September 30, |
|||||||||||
In millions of dollars |
2014 |
2013 |
2014 |
2013 |
||||||||
Carrying value of HTM securities sold |
$ |
— |
$ |
235 |
$ |
5 |
$ |
720 |
||||
Net realized gain (loss) on sale of HTM securities |
— |
(39 |
) |
— |
$ |
(105 |
) |
|||||
Carrying value of securities reclassified to AFS |
700 |
— |
766 |
$ |
902 |
|||||||
OTTI losses on securities reclassified to AFS |
(2 |
) |
— |
(11 |
) |
$ |
(155 |
) |
||||
September 30, 2014 |
December 31, 2013 |
|||||||||||||||||||||||
In millions of dollars |
Amortized
cost
|
Gross
unrealized
gains(1)
|
Gross
unrealized
losses(1)
|
Fair
value
|
Amortized
cost
|
Gross
unrealized
gains(1)
|
Gross
unrealized
losses(1)
|
Fair
value
|
||||||||||||||||
Debt securities AFS |
||||||||||||||||||||||||
Mortgage-backed securities(2)
|
||||||||||||||||||||||||
U.S. government-sponsored agency guaranteed |
$ |
36,654 |
$ |
522 |
$ |
308 |
$ |
36,868 |
$ |
42,494 |
$ |
391 |
$ |
888 |
$ |
41,997 |
||||||||
Prime |
13 |
— |
— |
13 |
33 |
2 |
3 |
32 |
||||||||||||||||
Alt-A |
2 |
— |
— |
2 |
84 |
10 |
— |
94 |
||||||||||||||||
Subprime |
— |
— |
— |
— |
12 |
— |
— |
12 |
||||||||||||||||
Non-U.S. residential |
9,200 |
84 |
9 |
9,275 |
9,976 |
95 |
4 |
10,067 |
||||||||||||||||
Commercial |
562 |
6 |
4 |
564 |
455 |
6 |
8 |
453 |
||||||||||||||||
Total mortgage-backed securities |
$ |
46,431 |
$ |
612 |
$ |
321 |
$ |
46,722 |
$ |
53,054 |
$ |
504 |
$ |
903 |
$ |
52,655 |
||||||||
U.S. Treasury and federal agency securities |
||||||||||||||||||||||||
U.S. Treasury |
$ |
95,175 |
$ |
356 |
$ |
190 |
$ |
95,341 |
$ |
68,891 |
$ |
476 |
$ |
147 |
$ |
69,220 |
||||||||
Agency obligations |
16,513 |
61 |
29 |
16,545 |
18,320 |
123 |
67 |
18,376 |
||||||||||||||||
Total U.S. Treasury and federal agency securities |
$ |
111,688 |
$ |
417 |
$ |
219 |
$ |
111,886 |
$ |
87,211 |
$ |
599 |
$ |
214 |
$ |
87,596 |
||||||||
State and municipal(3)
|
$ |
13,894 |
$ |
144 |
$ |
1,125 |
$ |
12,913 |
$ |
20,761 |
$ |
184 |
$ |
2,005 |
$ |
18,940 |
||||||||
Foreign government |
95,314 |
639 |
293 |
95,660 |
96,608 |
403 |
540 |
96,471 |
||||||||||||||||
Corporate |
13,767 |
290 |
99 |
13,958 |
11,039 |
210 |
119 |
11,130 |
||||||||||||||||
Asset-backed securities(2)
|
12,830 |
41 |
28 |
12,843 |
15,352 |
42 |
120 |
15,274 |
||||||||||||||||
Other debt securities |
711 |
— |
1 |
710 |
710 |
1 |
— |
711 |
||||||||||||||||
Total debt securities AFS |
$ |
294,635 |
$ |
2,143 |
$ |
2,086 |
$ |
294,692 |
$ |
284,735 |
$ |
1,943 |
$ |
3,901 |
$ |
282,777 |
||||||||
Marketable equity securities AFS |
$ |
3,916 |
$ |
105 |
$ |
35 |
$ |
3,986 |
$ |
3,832 |
$ |
85 |
$ |
183 |
$ |
3,734 |
||||||||
Total securities AFS |
$ |
298,551 |
$ |
2,248 |
$ |
2,121 |
$ |
298,678 |
$ |
288,567 |
$ |
2,028 |
$ |
4,084 |
$ |
286,511 |
||||||||
(1) |
Gross unrealized gains and losses, as presented, do not include the impact of minority investments and the related allocations and pick-up of unrealized gains and losses of AFS securities. These amounts totaled $16 million of unrealized gains and $36 million of unrealized gains as of September 30, 2014 and December 31, 2013, respectively.
|
(2) |
The Company invests in mortgage-backed and asset-backed securities. These securitizations are generally considered VIEs. The Company’s maximum exposure to loss from these VIEs is equal to the carrying amount of the securities, which is reflected in the table above. For mortgage-backed and asset-backed securitizations in which the Company has other involvement, see Note 20 to the Consolidated Financial Statements.
|
(3) |
The gross unrealized losses on state and municipal debt securities are primarily attributable to the effects of fair value hedge accounting. Specifically, Citi hedges the LIBOR-benchmark interest rate component of certain fixed-rate tax-exempt state and municipal debt securities utilizing LIBOR-based interest rate swaps. During the hedge period, losses incurred on the LIBOR-hedging swaps recorded in earnings were substantially offset by gains on the state and municipal debt securities attributable to changes in the LIBOR swap rate being hedged. However, because the LIBOR swap rate decreased significantly during the hedge period while the overall fair value of the municipal debt securities was relatively unchanged, the effect of reclassifying fair value gains on these securities from Accumulated other comprehensive income (loss) (AOCI) to earnings, attributable solely to changes in the LIBOR swap rate, resulted in net unrealized losses remaining in AOCI that relate to the unhedged components of these securities.
|
Less than 12 months |
12 months or longer |
Total |
||||||||||||||||
In millions of dollars |
Fair
value
|
Gross
unrealized
losses
|
Fair
value
|
Gross
unrealized
losses
|
Fair
value
|
Gross
unrealized
losses
|
||||||||||||
September 30, 2014 |
||||||||||||||||||
Securities AFS |
||||||||||||||||||
Mortgage-backed securities |
||||||||||||||||||
U.S. government-sponsored agency guaranteed |
$ |
5,606 |
$ |
32 |
$ |
9,447 |
$ |
276 |
$ |
15,053 |
$ |
308 |
||||||
Prime |
4 |
— |
2 |
— |
6 |
— |
||||||||||||
Non-U.S. residential |
382 |
2 |
547 |
7 |
929 |
9 |
||||||||||||
Commercial |
140 |
1 |
131 |
3 |
271 |
4 |
||||||||||||
Total mortgage-backed securities |
$ |
6,132 |
$ |
35 |
$ |
10,127 |
$ |
286 |
$ |
16,259 |
$ |
321 |
||||||
U.S. Treasury and federal agency securities |
||||||||||||||||||
U.S. Treasury |
$ |
45,334 |
$ |
177 |
$ |
1,173 |
$ |
13 |
$ |
46,507 |
$ |
190 |
||||||
Agency obligations |
4,680 |
16 |
1,552 |
13 |
6,232 |
29 |
||||||||||||
Total U.S. Treasury and federal agency securities |
$ |
50,014 |
$ |
193 |
$ |
2,725 |
$ |
26 |
$ |
52,739 |
$ |
219 |
||||||
State and municipal |
$ |
429 |
$ |
15 |
$ |
6,154 |
$ |
1,110 |
$ |
6,583 |
$ |
1,125 |
||||||
Foreign government |
22,487 |
176 |
7,447 |
117 |
29,934 |
293 |
||||||||||||
Corporate |
2,873 |
69 |
1,472 |
30 |
4,345 |
99 |
||||||||||||
Asset-backed securities |
1,117 |
1 |
3,936 |
27 |
5,053 |
28 |
||||||||||||
Other debt securities |
49 |
1 |
— |
— |
49 |
1 |
||||||||||||
Marketable equity securities AFS |
43 |
3 |
231 |
32 |
274 |
35 |
||||||||||||
Total securities AFS |
$ |
83,144 |
$ |
493 |
$ |
32,092 |
$ |
1,628 |
$ |
115,236 |
$ |
2,121 |
||||||
December 31, 2013 |
||||||||||||||||||
Securities AFS |
||||||||||||||||||
Mortgage-backed securities |
||||||||||||||||||
U.S. government-sponsored agency guaranteed |
$ |
19,377 |
$ |
533 |
$ |
5,643 |
$ |
355 |
$ |
25,020 |
$ |
888 |
||||||
Prime |
85 |
3 |
3 |
— |
88 |
3 |
||||||||||||
Non-U.S. residential |
2,103 |
4 |
5 |
— |
2,108 |
4 |
||||||||||||
Commercial |
206 |
6 |
28 |
2 |
234 |
8 |
||||||||||||
Total mortgage-backed securities |
$ |
21,771 |
$ |
546 |
$ |
5,679 |
$ |
357 |
$ |
27,450 |
$ |
903 |
||||||
U.S. Treasury and federal agency securities |
||||||||||||||||||
U.S. Treasury |
$ |
34,780 |
$ |
133 |
$ |
268 |
$ |
14 |
$ |
35,048 |
$ |
147 |
||||||
Agency obligations |
6,692 |
66 |
101 |
1 |
6,793 |
67 |
||||||||||||
Total U.S. Treasury and federal agency securities |
$ |
41,472 |
$ |
199 |
$ |
369 |
$ |
15 |
$ |
41,841 |
$ |
214 |
||||||
State and municipal |
$ |
595 |
$ |
29 |
$ |
11,447 |
$ |
1,976 |
$ |
12,042 |
$ |
2,005 |
||||||
Foreign government |
35,783 |
477 |
5,778 |
63 |
41,561 |
540 |
||||||||||||
Corporate |
4,565 |
108 |
387 |
11 |
4,952 |
119 |
||||||||||||
Asset-backed securities |
11,207 |
57 |
1,931 |
63 |
13,138 |
120 |
||||||||||||
Marketable equity securities AFS |
1,271 |
92 |
806 |
91 |
2,077 |
183 |
||||||||||||
Total securities AFS |
$ |
116,664 |
$ |
1,508 |
$ |
26,397 |
$ |
2,576 |
$ |
143,061 |
$ |
4,084 |
||||||
September 30, 2014 |
December 31, 2013 |
|||||||||||
In millions of dollars |
Amortized
cost
|
Fair
value
|
Amortized
cost
|
Fair
value
|
||||||||
Mortgage-backed securities(1)
|
||||||||||||
Due within 1 year |
$ |
63 |
$ |
63 |
$ |
87 |
$ |
87 |
||||
After 1 but within 5 years |
593 |
599 |
346 |
354 |
||||||||
After 5 but within 10 years |
1,932 |
1,957 |
2,898 |
2,932 |
||||||||
After 10 years(2)
|
43,843 |
44,103 |
49,723 |
49,282 |
||||||||
Total |
$ |
46,431 |
$ |
46,722 |
$ |
53,054 |
$ |
52,655 |
||||
U.S. Treasury and federal agency securities |
||||||||||||
Due within 1 year |
$ |
13,172 |
$ |
13,198 |
$ |
15,789 |
$ |
15,853 |
||||
After 1 but within 5 years |
93,519 |
93,588 |
66,232 |
66,457 |
||||||||
After 5 but within 10 years |
2,301 |
2,321 |
2,129 |
2,185 |
||||||||
After 10 years(2)
|
2,696 |
2,779 |
3,061 |
3,101 |
||||||||
Total |
$ |
111,688 |
$ |
111,886 |
$ |
87,211 |
$ |
87,596 |
||||
State and municipal |
||||||||||||
Due within 1 year |
$ |
307 |
$ |
300 |
$ |
576 |
$ |
581 |
||||
After 1 but within 5 years |
3,878 |
3,803 |
3,731 |
3,735 |
||||||||
After 5 but within 10 years |
530 |
546 |
439 |
482 |
||||||||
After 10 years(2)
|
9,179 |
8,264 |
16,015 |
14,142 |
||||||||
Total |
$ |
13,894 |
$ |
12,913 |
$ |
20,761 |
$ |
18,940 |
||||
Foreign government |
||||||||||||
Due within 1 year |
$ |
36,864 |
$ |
36,881 |
$ |
37,005 |
$ |
36,959 |
||||
After 1 but within 5 years |
42,217 |
42,326 |
51,344 |
51,304 |
||||||||
After 5 but within 10 years |
15,207 |
15,356 |
7,314 |
7,216 |
||||||||
After 10 years(2)
|
1,026 |
1,097 |
945 |
992 |
||||||||
Total |
$ |
95,314 |
$ |
95,660 |
$ |
96,608 |
$ |
96,471 |
||||
All other(3)
|
||||||||||||
Due within 1 year |
$ |
1,585 |
$ |
1,589 |
$ |
2,786 |
$ |
2,733 |
||||
After 1 but within 5 years |
12,016 |
12,181 |
10,934 |
11,020 |
||||||||
After 5 but within 10 years |
7,053 |
7,099 |
5,632 |
5,641 |
||||||||
After 10 years(2)
|
6,654 |
6,642 |
7,749 |
7,721 |
||||||||
Total |
$ |
27,308 |
$ |
27,511 |
$ |
27,101 |
$ |
27,115 |
||||
Total debt securities AFS |
$ |
294,635 |
$ |
294,692 |
$ |
284,735 |
$ |
282,777 |
||||
(1) |
Includes mortgage-backed securities of U.S. government-sponsored agencies. |
(2) |
Investments with no stated maturities are included as contractual maturities of greater than 10 years. Actual maturities may differ due to call or prepayment rights. |
(3) |
Includes corporate, asset-backed and other debt securities. |
In millions of dollars |
Amortized
cost(1)
|
Net unrealized gains
(losses)
recognized in
AOCI
|
Carrying
value(2)
|
Gross
unrealized
gains
|
Gross
unrealized
(losses)
|
Fair
value
|
||||||||||||
September 30, 2014 |
||||||||||||||||||
Debt securities held-to-maturity |
||||||||||||||||||
Mortgage-backed securities(3)
|
||||||||||||||||||
U.S. government agency guaranteed |
$ |
8,247 |
$ |
96 |
$ |
8,343 |
$ |
27 |
$ |
(28 |
) |
$ |
8,342 |
|||||
Prime |
63 |
(14 |
) |
49 |
5 |
(1 |
) |
53 |
||||||||||
Alt-A |
1,214 |
(238 |
) |
976 |
546 |
(281 |
) |
1,241 |
||||||||||
Subprime |
2 |
— |
2 |
1 |
— |
3 |
||||||||||||
Non-U.S. residential |
1,165 |
(170 |
) |
995 |
103 |
— |
1,098 |
|||||||||||
Commercial |
9 |
— |
9 |
1 |
— |
10 |
||||||||||||
Total mortgage-backed securities |
$ |
10,700 |
$ |
(326 |
) |
$ |
10,374 |
$ |
683 |
$ |
(310 |
) |
$ |
10,747 |
||||
State and municipal(4)
|
$ |
8,323 |
$ |
(525 |
) |
$ |
7,798 |
$ |
162 |
$ |
(50 |
) |
$ |
7,910 |
||||
Foreign government |
5,279 |
— |
5,279 |
78 |
— |
5,357 |
||||||||||||
Corporate |
38 |
(1 |
) |
37 |
2 |
— |
39 |
|||||||||||
Asset-backed securities(3)
|
569 |
(19 |
) |
550 |
49 |
(10 |
) |
589 |
||||||||||
Total debt securities held-to-maturity (5)
|
$ |
24,909 |
$ |
(871 |
) |
$ |
24,038 |
$ |
974 |
$ |
(370 |
) |
$ |
24,642 |
||||
December 31, 2013 |
||||||||||||||||||
Debt securities held-to-maturity |
||||||||||||||||||
Mortgage-backed securities(3)
|
||||||||||||||||||
Prime |
$ |
72 |
$ |
(16 |
) |
$ |
56 |
$ |
5 |
$ |
(2 |
) |
$ |
59 |
||||
Alt-A |
1,379 |
(287 |
) |
1,092 |
449 |
(263 |
) |
1,278 |
||||||||||
Subprime |
2 |
— |
2 |
1 |
— |
3 |
||||||||||||
Non-U.S. residential |
1,372 |
(206 |
) |
1,166 |
60 |
(20 |
) |
1,206 |
||||||||||
Commercial |
10 |
— |
10 |
1 |
— |
11 |
||||||||||||
Total mortgage-backed securities |
$ |
2,835 |
$ |
(509 |
) |
$ |
2,326 |
$ |
516 |
$ |
(285 |
) |
$ |
2,557 |
||||
State and municipal |
$ |
1,394 |
$ |
(62 |
) |
$ |
1,332 |
$ |
50 |
$ |
(70 |
) |
$ |
1,312 |
||||
Foreign government |
5,628 |
— |
5,628 |
70 |
(10 |
) |
5,688 |
|||||||||||
Corporate |
818 |
(78 |
) |
740 |
111 |
— |
851 |
|||||||||||
Asset-backed securities(3)
|
599 |
(26 |
) |
573 |
22 |
(10 |
) |
585 |
||||||||||
Total debt securities held-to-maturity |
$ |
11,274 |
$ |
(675 |
) |
$ |
10,599 |
$ |
769 |
$ |
(375 |
) |
$ |
10,993 |
||||
(1) |
For securities transferred to HTM from Trading account assets, amortized cost is defined as the fair value of the securities at the date of transfer plus any accretion income and less any impairments recognized in earnings subsequent to transfer. For securities transferred to HTM from AFS, amortized cost is defined as the original purchase cost, adjusted for the cumulative accretion or amortization of any purchase discount or premium, plus or minus any cumulative fair value hedge adjustments, net of accretion or amortization, and less any other-than-temporary impairment recognized in earnings.
|
(2) |
HTM securities are carried on the Consolidated Balance Sheet at amortized cost, plus or minus any unamortized unrealized gains and losses and fair value hedge adjustments recognized in AOCI prior to reclassifying the securities from AFS to HTM. Changes in the values of these securities are not reported in the financial statements, except for the amortization of any difference between the carrying value at the transfer date and par value of the securities, and the recognition of any non-credit fair value adjustments in AOCI in connection with the recognition of any credit impairment in earnings related to securities the Company continues to intend to hold until maturity. |
(3) |
The Company invests in mortgage-backed and asset-backed securities. These securitizations are generally considered VIEs. The Company’s maximum exposure to loss from these VIEs is equal to the carrying amount of the securities, which is reflected in the table above. For mortgage-backed and asset-backed securitizations in which the Company has other involvement, see Note 20 to the Consolidated Financial Statements.
|
(4) |
The net unrealized losses recognized in AOCI on state and municipal debt securities are primarily attributable to the effects of fair value hedge accounting applied when these debt securities were classified as AFS. Specifically, Citi hedged the LIBOR-benchmark interest rate component of certain fixed-rate tax-exempt state and municipal debt securities utilizing LIBOR-based interest rate swaps. During the hedge period, losses incurred on the LIBOR-hedging swaps recorded in earnings were substantially offset by gains on the state and municipal debt securities attributable to changes in the LIBOR swap rate being hedged. However, because the LIBOR swap rate decreased significantly during the hedge period while the overall fair value of the municipal debt securities was relatively unchanged, the effect of reclassifying fair value gains on these securities from AOCI to earnings attributable solely to changes in the LIBOR swap rate resulted in net unrealized losses remaining in AOCI that relate to the unhedged components of these securities. Upon transfer of these debt securities to HTM, all hedges have been de-designated and hedge accounting has ceased. |
(5) |
During the second quarter of 2014, securities with a total fair value of approximately $11.8 billion were transferred from AFS to HTM. For additional information, see Note 13 in Citi’s Second Quarter of 2014 Form 10-Q.
|
Less than 12 months |
12 months or longer |
Total |
||||||||||||||||
In millions of dollars |
Fair value |
Gross unrecognized losses |
Fair value |
Gross unrecognized losses |
Fair value |
Gross unrecognized losses |
||||||||||||
September 30, 2014 |
||||||||||||||||||
Debt securities held-to-maturity |
||||||||||||||||||
Mortgage-backed securities |
$ |
4 |
$ |
— |
$ |
4,312 |
$ |
310 |
$ |
4,316 |
$ |
310 |
||||||
State and municipal |
2,228 |
18 |
551 |
32 |
2,779 |
50 |
||||||||||||
Foreign government |
— |
— |
— |
— |
— |
— |
||||||||||||
Asset-backed securities |
11 |
1 |
175 |
9 |
186 |
10 |
||||||||||||
Total debt securities held-to-maturity |
$ |
2,243 |
$ |
19 |
$ |
5,038 |
$ |
351 |
$ |
7,281 |
$ |
370 |
||||||
December 31, 2013 |
||||||||||||||||||
Debt securities held-to-maturity |
||||||||||||||||||
Mortgage-backed securities |
$ |
— |
$ |
— |
$ |
358 |
$ |
285 |
$ |
358 |
$ |
285 |
||||||
State and municipal |
235 |
20 |
302 |
50 |
537 |
70 |
||||||||||||
Foreign government |
920 |
10 |
— |
— |
920 |
10 |
||||||||||||
Asset-backed securities |
98 |
6 |
198 |
4 |
296 |
10 |
||||||||||||
Total debt securities held-to-maturity |
$ |
1,253 |
$ |
36 |
$ |
858 |
$ |
339 |
$ |
2,111 |
$ |
375 |
||||||
September 30, 2014 |
December 31, 2013 |
|||||||||||
In millions of dollars |
Carrying value |
Fair value |
Carrying value |
Fair value |
||||||||
Mortgage-backed securities |
||||||||||||
Due within 1 year |
$ |
— |
$ |
— |
$ |
— |
$ |
— |
||||
After 1 but within 5 years |
— |
— |
— |
— |
||||||||
After 5 but within 10 years |
780 |
777 |
10 |
11 |
||||||||
After 10 years(1)
|
9,594 |
9,970 |
2,316 |
2,546 |
||||||||
Total |
$ |
10,374 |
$ |
10,747 |
$ |
2,326 |
$ |
2,557 |
||||
State and municipal |
||||||||||||
Due within 1 year |
$ |
39 |
$ |
39 |
$ |
8 |
$ |
9 |
||||
After 1 but within 5 years |
21 |
21 |
17 |
17 |
||||||||
After 5 but within 10 years |
144 |
149 |
69 |
72 |
||||||||
After 10 years(1)
|
7,594 |
7,701 |
1,238 |
1,214 |
||||||||
Total |
$ |
7,798 |
$ |
7,910 |
$ |
1,332 |
$ |
1,312 |
||||
Foreign government |
||||||||||||
Due within 1 year |
$ |
— |
$ |
— |
$ |
— |
$ |
— |
||||
After 1 but within 5 years |
5,279 |
5,357 |
5,628 |
5,688 |
||||||||
After 5 but within 10 years |
— |
— |
— |
— |
||||||||
After 10 years(1)
|
— |
— |
— |
— |
||||||||
Total |
$ |
5,279 |
$ |
5,357 |
$ |
5,628 |
$ |
5,688 |
||||
All other(2)
|
||||||||||||
Due within 1 year |
$ |
— |
$ |
— |
$ |
— |
$ |
— |
||||
After 1 but within 5 years |
37 |
39 |
740 |
851 |
||||||||
After 5 but within 10 years |
— |
— |
— |
— |
||||||||
After 10 years(1)
|
550 |
589 |
573 |
585 |
||||||||
Total |
$ |
587 |
$ |
628 |
$ |
1,313 |
$ |
1,436 |
||||
Total debt securities held-to-maturity |
$ |
24,038 |
$ |
24,642 |
$ |
10,599 |
$ |
10,993 |
||||
(1) |
Investments with no stated maturities are included as contractual maturities of greater than 10 years. Actual maturities may differ due to call or prepayment rights. |
(2) |
Includes corporate and asset-backed securities. |
• |
the length of time and the extent to which fair value has been below cost; |
• |
the severity of the impairment; |
• |
the cause of the impairment and the financial condition and near-term prospects of the issuer; |
• |
activity in the market of the issuer that may indicate adverse credit conditions; and |
• |
the Company’s ability and intent to hold the investment for a period of time sufficient to allow for any anticipated recovery. |
• |
identification and evaluation of investments that have indications of possible impairment; |
• |
analysis of individual investments that have fair values less than amortized cost, including consideration of the length of time the investment has been in an unrealized loss position and the expected recovery period; |
• |
discussion of evidential matter, including an evaluation of factors or triggers that could cause individual investments to qualify as having other-than-temporary impairment and those that would not support other-than-temporary impairment; and |
• |
documentation of the results of these analyses, as required under business policies. |
• |
the cause of the impairment and the financial condition and near-term prospects of the issuer, including any specific events that may influence the operations of the issuer; |
• |
the intent and ability to hold the investment for a period of time sufficient to allow for any anticipated recovery in market value; and |
• |
the length of time and extent to which fair value has been less than the carrying value. |
OTTI on Investments and Other Assets |
Three Months Ended September 30, 2014 |
Nine Months Ended September 30, 2014 |
||||||||||||||||||||||
In millions of dollars |
AFS(1)
|
HTM |
Other
Assets
|
Total |
AFS(1)
|
HTM |
Other
Assets
|
Total |
||||||||||||||||
Impairment losses related to securities that the Company does not intend to sell nor will likely be required to sell: |
||||||||||||||||||||||||
Total OTTI losses recognized during the period |
$ |
11 |
$ |
— |
$ |
— |
$ |
11 |
$ |
13 |
$ |
— |
$ |
— |
$ |
13 |
||||||||
Less: portion of impairment loss recognized in AOCI (before taxes) |
8 |
— |
— |
8 |
8 |
— |
— |
8 |
||||||||||||||||
Net impairment losses recognized in earnings for securities that the Company does not intend to sell nor will likely be required to sell |
$ |
3 |
$ |
— |
$ |
— |
$ |
3 |
$ |
5 |
$ |
— |
$ |
— |
$ |
5 |
||||||||
Impairment losses recognized in earnings for securities that the Company intends to sell or more-likely-than-not will be required to sell before recovery |
88 |
— |
— |
88 |
324 |
— |
— |
324 |
||||||||||||||||
Total impairment losses recognized in earnings |
$ |
91 |
$ |
— |
$ |
— |
$ |
91 |
$ |
329 |
$ |
— |
$ |
— |
$ |
329 |
||||||||
(1) |
Includes OTTI on non-marketable equity securities. |
OTTI on Investments and Other Assets |
Three Months Ended September 30, 2013 |
Nine Months Ended September 30, 2013 |
||||||||||||||||||||||
In millions of dollars |
AFS(1)
|
HTM |
Other Assets |
Total |
AFS(1)
|
HTM |
Other Assets (2) |
Total |
||||||||||||||||
Impairment losses related to securities that the Company does not intend to sell nor will likely be required to sell: |
||||||||||||||||||||||||
Total OTTI losses recognized during the period |
$ |
2 |
$ |
42 |
$ |
— |
$ |
44 |
$ |
7 |
$ |
65 |
$ |
— |
$ |
72 |
||||||||
Less: portion of impairment loss recognized in AOCI (before taxes) |
— |
27 |
— |
27 |
— |
38 |
— |
38 |
||||||||||||||||
Net impairment losses recognized in earnings for securities that the Company does not intend to sell nor will likely be required to sell |
$ |
2 |
$ |
15 |
$ |
— |
$ |
17 |
$ |
7 |
$ |
27 |
$ |
— |
$ |
34 |
||||||||
Impairment losses recognized in earnings for securities that the Company intends to sell or more-likely-than-not will be required to sell before recovery (2)
|
22 |
— |
— |
22 |
236 |
— |
192 |
428 |
||||||||||||||||
Total impairment losses recognized in earnings |
$ |
24 |
$ |
15 |
$ |
— |
$ |
39 |
$ |
243 |
$ |
27 |
$ |
192 |
$ |
462 |
||||||||
(1) |
Includes OTTI on non-marketable equity securities. |
(2) |
The impairment charge relates to the carrying value of Citi’s then-remaining 35% interest in the Morgan Stanley Smith Barney joint venture (MSSB), offset by the equity pickup from MSSB during the respective periods which was recorded in Other revenue.
|
Cumulative OTTI credit losses recognized in earnings on HTM Securities Still Held |
|||||||||||||||
In millions of dollars |
Jun. 30, 2014 balance |
Credit
impairments
recognized in
earnings on
securities not
previously
impaired
|
Credit
impairments
recognized in
earnings on
securities that
have
been previously
impaired
|
Reductions due to
credit-impaired
securities sold,
transferred or
matured
|
Sept. 30, 2014 balance |
||||||||||
AFS debt securities |
|||||||||||||||
Mortgage-backed securities |
$ |
295 |
$ |
— |
$ |
— |
$ |
— |
$ |
295 |
|||||
Foreign government securities |
171 |
— |
— |
— |
171 |
||||||||||
Corporate |
112 |
— |
— |
— |
112 |
||||||||||
All other debt securities |
146 |
3 |
— |
— |
149 |
||||||||||
Total OTTI credit losses recognized for AFS debt securities |
$ |
724 |
$ |
3 |
$ |
— |
$ |
— |
$ |
727 |
|||||
HTM debt securities |
|||||||||||||||
Mortgage-backed securities(1)
|
$ |
665 |
$ |
— |
$ |
— |
$ |
— |
$ |
665 |
|||||
Corporate |
56 |
— |
— |
(56 |
) |
— |
|||||||||
All other debt securities |
133 |
— |
— |
— |
133 |
||||||||||
Total OTTI credit losses recognized for HTM debt securities |
$ |
854 |
$ |
— |
$ |
— |
$ |
(56 |
) |
$ |
798 |
||||
Cumulative OTTI credit losses recognized in earnings on HTM Securities Still Held |
|||||||||||||||
In millions of dollars |
Dec. 31, 2013 balance |
Credit impairments recognized in earnings on securities not previously impaired |
Credit impairments recognized in earnings on securities that have been previously impaired |
Reductions due to credit-impaired securities sold, transferred or matured |
Sept. 30, 2014 balance |
||||||||||
AFS debt securities |
|||||||||||||||
Mortgage-backed securities |
$ |
295 |
$ |
— |
$ |
— |
$ |
— |
$ |
295 |
|||||
Foreign government securities |
171 |
— |
— |
— |
171 |
||||||||||
Corporate |
113 |
— |
— |
(1 |
) |
112 |
|||||||||
All other debt securities |
144 |
5 |
— |
— |
149 |
||||||||||
Total OTTI credit losses recognized for AFS debt securities |
$ |
723 |
$ |
5 |
$ |
— |
$ |
(1 |
) |
$ |
727 |
||||
HTM debt securities |
|||||||||||||||
Mortgage-backed securities(1)
|
$ |
678 |
$ |
— |
$ |
— |
$ |
(13 |
) |
$ |
665 |
||||
Corporate |
56 |
— |
— |
(56 |
) |
— |
|||||||||
All other debt securities |
133 |
— |
— |
— |
133 |
||||||||||
Total OTTI credit losses recognized for HTM debt securities |
$ |
867 |
$ |
— |
$ |
— |
$ |
(69 |
) |
$ |
798 |
||||
Fair value |
Unfunded commitments |
Redemption frequency
(if currently eligible)
monthly, quarterly, annually
|
Redemption notice
period
|
|||||||||||
In millions of dollars |
September 30, 2014 |
December 31, 2013 |
September 30, 2014 |
December 31, 2013 |
||||||||||
Hedge funds |
$ |
16 |
$ |
751 |
$ |
— |
$ |
— |
Generally quarterly |
10-95 days |
||||
Private equity funds(1)(2)
|
849 |
794 |
153 |
170 |
— |
— |
||||||||
Real estate funds (2)(3)
|
173 |
294 |
25 |
36 |
— |
— |
||||||||
Total(4)
|
$ |
1,038 |
$ |
1,839 |
$ |
178 |
$ |
206 |
— |
— |
||||
(1) |
Private equity funds include funds that invest in infrastructure, leveraged buyout transactions, emerging markets and venture capital. |
(2) |
With respect to the Company’s investments in private equity funds and real estate funds, distributions from each fund will be received as the underlying assets held by these funds are liquidated. It is estimated that the underlying assets of these funds will be liquidated over a period of several years as market conditions allow. Private equity and real estate funds do not allow redemption of investments by their investors. Investors are permitted to sell or transfer their investments, subject to the approval of the general partner or investment manager of these funds, which generally may not be unreasonably withheld. |
(3) |
Includes several real estate funds that invest primarily in commercial real estate in the U.S., Europe and Asia. |
(4) |
Included in the total fair value of investments above are $0.8 billion and $1.6 billion of fund assets that are valued using NAVs provided by third-party asset managers as of September 30, 2014 and December 31, 2013, respectively.
|
In millions of dollars |
September 30, 2014 |
December 31, 2013 |
||||
Consumer loans |
||||||
In U.S. offices |
||||||
Mortgage and real estate(1)
|
$ |
101,583 |
$ |
108,453 |
||
Installment, revolving credit, and other |
13,350 |
13,398 |
||||
Cards |
108,314 |
115,651 |
||||
Commercial and industrial |
6,870 |
6,592 |
||||
$ |
230,117 |
$ |
244,094 |
|||
In offices outside the U.S. |
||||||
Mortgage and real estate(1)
|
$ |
56,099 |
$ |
55,511 |
||
Installment, revolving credit, and other |
34,270 |
33,182 |
||||
Cards |
32,410 |
36,740 |
||||
Commercial and industrial |
23,393 |
24,107 |
||||
Lease financing |
678 |
769 |
||||
$ |
146,850 |
$ |
150,309 |
|||
Total Consumer loans |
$ |
376,967 |
$ |
394,403 |
||
Net unearned income |
(649 |
) |
(572 |
) |
||
Consumer loans, net of unearned income |
$ |
376,318 |
$ |
393,831 |
||
(1)
|
Loans secured primarily by real estate. |
In millions of dollars |
Total
current(1)(2)
|
30-89 days
past due(3)
|
≥ 90 days
past due(3)
|
Past due
government
guaranteed(4)
|
Total
loans(2)
|
Total
non-accrual
|
90 days past due
and accruing
|
||||||||||||||
In North America offices |
|||||||||||||||||||||
Residential first mortgages |
$ |
64,838 |
$ |
1,585 |
$ |
1,532 |
$ |
4,049 |
$ |
72,004 |
$ |
2,912 |
$ |
3,167 |
|||||||
Home equity loans(5)
|
28,130 |
344 |
521 |
— |
28,995 |
1,285 |
— |
||||||||||||||
Credit cards |
107,015 |
1,295 |
1,189 |
— |
109,499 |
— |
1,189 |
||||||||||||||
Installment and other |
12,344 |
229 |
255 |
— |
12,828 |
251 |
4 |
||||||||||||||
Commercial market loans |
8,518 |
33 |
14 |
— |
8,565 |
91 |
8 |
||||||||||||||
Total |
$ |
220,845 |
$ |
3,486 |
$ |
3,511 |
$ |
4,049 |
$ |
231,891 |
$ |
4,539 |
$ |
4,368 |
|||||||
In offices outside North America |
|||||||||||||||||||||
Residential first mortgages |
$ |
45,957 |
$ |
311 |
$ |
234 |
$ |
— |
$ |
46,502 |
$ |
489 |
$ |
— |
|||||||
Home equity loans(5)
|
— |
— |
— |
— |
— |
— |
— |
||||||||||||||
Credit cards |
31,147 |
685 |
575 |
— |
32,407 |
445 |
336 |
||||||||||||||
Installment and other |
30,988 |
377 |
166 |
— |
31,531 |
240 |
— |
||||||||||||||
Commercial market loans |
33,236 |
103 |
372 |
— |
33,711 |
526 |
— |
||||||||||||||
Total |
$ |
141,328 |
$ |
1,476 |
$ |
1,347 |
$ |
— |
$ |
144,151 |
$ |
1,700 |
$ |
336 |
|||||||
Total GCB and Citi Holdings |
$ |
362,173 |
$ |
4,962 |
$ |
4,858 |
$ |
4,049 |
$ |
376,042 |
$ |
6,239 |
$ |
4,704 |
|||||||
Other |
276 |
— |
— |
— |
276 |
33 |
— |
||||||||||||||
Total Citigroup |
$ |
362,449 |
$ |
4,962 |
$ |
4,858 |
$ |
4,049 |
$ |
376,318 |
$ |
6,272 |
$ |
4,704 |
|||||||
(1) |
Loans less than 30 days past due are presented as current.
|
(2) |
Includes $45 million of residential first mortgages recorded at fair value.
|
(3) |
Excludes loans guaranteed by U.S. government-sponsored entities. |
(4) |
Consists of residential first mortgages that are guaranteed by U.S. government-sponsored entities that are 30-89 days past due of $0.8 billion and 90 days past due of $3.2 billion.
|
(5) |
Fixed rate home equity loans and loans extended under home equity lines of credit, which are typically in junior lien positions. |
In millions of dollars |
Total
current(1)(2)
|
30-89 days
past due(3)
|
≥ 90 days
past due(3)
|
Past due
government
guaranteed(4)
|
Total
loans(2)
|
Total
non-accrual
|
90 days past due
and accruing
|
||||||||||||||
In North America offices |
|||||||||||||||||||||
Residential first mortgages |
$ |
66,612 |
$ |
2,044 |
$ |
1,975 |
$ |
5,271 |
$ |
75,902 |
$ |
3,415 |
$ |
3,997 |
|||||||
Home equity loans(5)
|
30,603 |
434 |
605 |
— |
31,642 |
1,452 |
— |
||||||||||||||
Credit cards |
113,886 |
1,491 |
1,452 |
— |
116,829 |
— |
1,452 |
||||||||||||||
Installment and other |
12,609 |
225 |
243 |
— |
13,077 |
247 |
7 |
||||||||||||||
Commercial market loans |
8,630 |
26 |
28 |
— |
8,684 |
112 |
7 |
||||||||||||||
Total |
$ |
232,340 |
$ |
4,220 |
$ |
4,303 |
$ |
5,271 |
$ |
246,134 |
$ |
5,226 |
$ |
5,463 |
|||||||
In offices outside North America |
|||||||||||||||||||||
Residential first mortgages |
$ |
46,067 |
$ |
435 |
$ |
332 |
$ |
— |
$ |
46,834 |
$ |
584 |
$ |
— |
|||||||
Home equity loans(5)
|
— |
— |
— |
— |
— |
— |
— |
||||||||||||||
Credit cards |
34,733 |
780 |
641 |
— |
36,154 |
402 |
413 |
||||||||||||||
Installment and other |
30,138 |
398 |
158 |
— |
30,694 |
230 |
— |
||||||||||||||
Commercial market loans |
33,242 |
111 |
295 |
— |
33,648 |
610 |
— |
||||||||||||||
Total |
$ |
144,180 |
$ |
1,724 |
$ |
1,426 |
$ |
— |
$ |
147,330 |
$ |
1,826 |
$ |
413 |
|||||||
Total GCB and Citi Holdings |
$ |
376,520 |
$ |
5,944 |
$ |
5,729 |
$ |
5,271 |
$ |
393,464 |
$ |
7,052 |
$ |
5,876 |
|||||||
Other |
367 |
— |
— |
— |
367 |
43 |
— |
||||||||||||||
Total Citigroup |
$ |
376,887 |
$ |
5,944 |
$ |
5,729 |
$ |
5,271 |
$ |
393,831 |
$ |
7,095 |
$ |
5,876 |
|||||||
(1) |
Loans less than 30 days past due are presented as current.
|
(2) |
Includes $0.9 billion of residential first mortgages recorded at fair value.
|
(3) |
Excludes loans guaranteed by U.S. government-sponsored entities. |
(4) |
Consists of residential first mortgages that are guaranteed by U.S. government-sponsored entities that are 30-89 days past due of $1.2 billion and 90 days past due of $4.1 billion.
|
(5) |
Fixed rate home equity loans and loans extended under home equity lines of credit, which are typically in junior lien positions. |
FICO score distribution in U.S. portfolio(1)(2)
|
September 30, 2014 |
||||||||
In millions of dollars |
Less than
620
|
≥ 620 but less
than 660
|
Equal to or
greater
than 660
|
||||||
Residential first mortgages |
$ |
9,862 |
$ |
5,861 |
$ |
47,538 |
|||
Home equity loans |
3,386 |
2,527 |
21,577 |
||||||
Credit cards |
7,283 |
9,963 |
88,770 |
||||||
Installment and other |
3,312 |
2,888 |
5,376 |
||||||
Total |
$ |
23,843 |
$ |
21,239 |
$ |
163,261 |
|||
(1)
|
Excludes loans guaranteed by U.S. government entities, loans subject to long-term standby commitments (LTSCs) with U.S. government-sponsored entities and loans recorded at fair value. |
(2)
|
Excludes balances where FICO was not available. Such amounts are not material. |
FICO score distribution in U.S. portfolio(1)(2)
|
December 31, 2013 |
||||||||
|
In millions of dollars
|
Less than
620
|
≥ 620 but less
than 660
|
Equal to or
greater
than 660
|
||||||
Residential first mortgages |
$ |
11,860 |
$ |
6,426 |
$ |
46,207 |
|||
Home equity loans |
4,093 |
2,779 |
23,152 |
||||||
Credit cards |
8,125 |
10,693 |
94,437 |
||||||
Installment and other |
3,900 |
2,399 |
5,186 |
||||||
Total |
$ |
27,978 |
$ |
22,297 |
$ |
168,982 |
|||
(1) |
Excludes loans guaranteed by U.S. government entities, loans subject to LTSCs with U.S. government-sponsored entities and loans recorded at fair value. |
(2) |
Excludes balances where FICO was not available. Such amounts are not material. |
LTV distribution in U.S. portfolio(1)(2)
|
September 30, 2014 |
||||||||
In millions of dollars |
Less than or
equal to 80%
|
> 80% but less
than or equal to
100%
|
Greater
than
100%
|
||||||
Residential first mortgages |
$ |
50,801 |
$ |
9,667 |
$ |
2,975 |
|||
Home equity loans |
15,129 |
7,647 |
4,591 |
||||||
Total |
$ |
65,930 |
$ |
17,314 |
$ |
7,566 |
|||
(1)
|
Excludes loans guaranteed by U.S. government entities, loans subject to LTSCs with U.S. government-sponsored entities and loans recorded at fair value. |
(2)
|
Excludes balances where LTV was not available. Such amounts are not material. |
LTV distribution in U.S. portfolio(1)(2)
|
December 31, 2013 |
||||||||
In millions of dollars |
Less than or
equal to 80%
|
> 80% but less
than or equal to
100%
|
Greater
than
100%
|
||||||
Residential first mortgages |
$ |
45,809 |
$ |
13,458 |
$ |
5,269 |
|||
Home equity loans |
14,216 |
8,685 |
6,935 |
||||||
Total |
$ |
60,025 |
$ |
22,143 |
$ |
12,204 |
|||
(1) |
Excludes loans guaranteed by U.S. government entities, loans subject to LTSCs with U.S. government-sponsored entities and loans recorded at fair value. |
(2) |
Excludes balances where LTV was not available. Such amounts are not material. |
Three months ended September 30, |
Nine months ended September 30, |
|||||||||||||||||||||||
Balance at September 30, 2014 |
2014 |
2013 |
2014 |
2013 |
||||||||||||||||||||
In millions of dollars |
Recorded
investment(1)(2)
|
Unpaid
principal balance
|
Related
specific allowance(3)
|
Average
carrying value(4)
|
Interest income
recognized(5)(6)
|
Interest income
recognized(5)(6)
|
Interest income
recognized(5)(6)
|
Interest income
recognized(5)(6)
|
||||||||||||||||
Mortgage and real estate |
||||||||||||||||||||||||
Residential first mortgages |
$ |
15,237 |
$ |
16,148 |
$ |
2,108 |
$ |
16,202 |
$ |
167 |
$ |
179 |
$ |
532 |
$ |
604 |
||||||||
Home equity loans |
2,058 |
2,701 |
546 |
2,103 |
18 |
23 |
56 |
61 |
||||||||||||||||
Credit cards |
2,584 |
2,626 |
898 |
2,965 |
47 |
56 |
148 |
182 |
||||||||||||||||
Installment and other |
||||||||||||||||||||||||
Individual installment and other |
969 |
983 |
447 |
1,016 |
31 |
35 |
94 |
118 |
||||||||||||||||
Commercial market loans |
355 |
565 |
193 |
375 |
3 |
5 |
18 |
17 |
||||||||||||||||
Total |
$ |
21,203 |
$ |
23,023 |
$ |
4,192 |
$ |
22,661 |
$ |
266 |
$ |
298 |
$ |
848 |
$ |
982 |
||||||||
(1) |
Recorded investment in a loan includes net deferred loan fees and costs, unamortized premium or discount and direct write-downs and includes accrued interest only on credit card loans. |
(2) |
$1,957 million of residential first mortgages, $555 million of home equity loans and $112 million of commercial market loans do not have a specific allowance.
|
Balance at December 31, 2013 |
||||||||||||
In millions of dollars |
Recorded
investment(1)(2)
|
Unpaid
principal balance
|
Related
specific allowance(3)
|
Average
carrying value(4)
|
||||||||
Mortgage and real estate |
||||||||||||
Residential first mortgages |
$ |
16,801 |
$ |
17,788 |
$ |
2,309 |
$ |
17,616 |
||||
Home equity loans |
2,141 |
2,806 |
427 |
2,116 |
||||||||
Credit cards |
3,339 |
3,385 |
1,178 |
3,720 |
||||||||
Installment and other |
||||||||||||
Individual installment and other |
1,114 |
1,143 |
536 |
1,094 |
||||||||
Commercial market loans |
398 |
605 |
183 |
404 |
||||||||
Total |
$ |
23,793 |
$ |
25,727 |
$ |
4,633 |
$ |
24,950 |
||||
(1) |
Recorded investment in a loan includes net deferred loan fees and costs, unamortized premium or discount and direct write-downs and includes accrued interest only on credit card loans. |
(2) |
$2,169 million of residential first mortgages, $568 million of home equity loans and $111 million of commercial market loans do not have a specific allowance.
|
(3) |
Included in the Allowance for loan losses.
|
(4) |
Average carrying value represents the average recorded investment ending balance for last four quarters and does not include the related specific allowance.
|
At and for the three months ended September 30, 2014 |
||||||||||||||||
In millions of dollars except number of loans modified |
Number of
loans modified
|
Post-
modification
recorded
investment(1)(2)
|
Deferred
principal(3)
|
Contingent
principal
forgiveness(4)
|
Principal
forgiveness(5)
|
Average
interest rate
reduction
|
||||||||||
North America |
||||||||||||||||
Residential first mortgages |
4,933 |
$ |
626 |
$ |
15 |
$ |
11 |
$ |
1 |
1 |
% |
|||||
Home equity loans |
1,900 |
76 |
1 |
— |
2 |
3 |
||||||||||
Credit cards |
48,775 |
211 |
— |
— |
— |
16 |
||||||||||
Installment and other revolving |
11,420 |
87 |
— |
— |
— |
6 |
||||||||||
Commercial markets(6)
|
46 |
5 |
— |
— |
1 |
— |
||||||||||
Total(8)
|
67,074 |
$ |
1,005 |
$ |
16 |
$ |
11 |
$ |
4 |
|||||||
International |
||||||||||||||||
Residential first mortgages |
841 |
$ |
30 |
$ |
— |
$ |
— |
$ |
— |
— |
% |
|||||
Home equity loans |
15 |
3 |
— |
— |
— |
— |
||||||||||
Credit cards |
40,848 |
125 |
— |
— |
10 |
12 |
||||||||||
Installment and other revolving |
15,053 |
73 |
— |
— |
4 |
10 |
||||||||||
Commercial markets(6)
|
51 |
22 |
— |
— |
— |
— |
||||||||||
Total(8)
|
56,808 |
$ |
253 |
$ |
— |
$ |
— |
$ |
14 |
|||||||
At and for the three months ended September 30, 2013 |
||||||||||||||||
In millions of dollars except number of loans modified |
Number of
loans modified
|
Post-
modification
recorded
investment(1)(7)
|
Deferred
principal(3)
|
Contingent
principal
forgiveness(4)
|
Principal
forgiveness(5)
|
Average
interest rate
reduction
|
||||||||||
North America |
||||||||||||||||
Residential first mortgages |
7,375 |
$ |
933 |
$ |
28 |
$ |
15 |
$ |
34 |
1 |
% |
|||||
Home equity loans |
2,962 |
90 |
— |
33 |
1 |
|||||||||||
Credit cards |
43,312 |
207 |
— |
— |
— |
14 |
||||||||||
Installment and other revolving |
13,880 |
99 |
— |
— |
— |
6 |
||||||||||
Commercial markets(6)
|
44 |
6 |
— |
— |
— |
— |
||||||||||
Total(8)
|
67,573 |
$ |
1,335 |
$ |
28 |
$ |
15 |
$ |
67 |
|||||||
International |
||||||||||||||||
Residential first mortgages |
733 |
$ |
30 |
$ |
— |
$ |
— |
$ |
1 |
1 |
% |
|||||
Home equity loans |
44 |
1 |
— |
— |
— |
1 |
||||||||||
Credit cards |
43,660 |
138 |
— |
— |
7 |
12 |
||||||||||
Installment and other revolving |
15,620 |
81 |
— |
— |
3 |
8 |
||||||||||
Commercial markets(6)
|
88 |
30 |
1 |
— |
— |
— |
||||||||||
Total(8)
|
60,145 |
$ |
280 |
$ |
1 |
$ |
— |
$ |
11 |
|||||||
(1) |
Post-modification balances include past due amounts that are capitalized at the modification date. |
(2) |
Post-modification balances in North America include $74 million of residential first mortgages and $22 million of home equity loans to borrowers who have gone through Chapter 7 bankruptcy in the three months ended September 30, 2014. These amounts include $45 million of residential first mortgages and $19 million of home equity loans that are newly classified as TDRs in the three months ended September 30, 2014 as a result of OCC guidance, as described above.
|
(3) |
Represents portion of contractual loan principal that is non-interest bearing but still due from the borrower. Such deferred principal is charged off at the time of permanent modification to the extent that the related loan balance exceeds the underlying collateral value. |
(4) |
Represents portion of contractual loan principal that is non-interest bearing and, depending upon borrower performance, eligible for forgiveness. |
(5) |
Represents portion of contractual loan principal that was forgiven at the time of permanent modification. |
At and for the nine months ended September 30, 2014 |
||||||||||||||||
In millions of dollars except number of loans modified |
Number of
loans modified
|
Post-
modification
recorded
investment(1)(2)
|
Deferred
principal(3)
|
Contingent
principal
forgiveness(4)
|
Principal
forgiveness(5)
|
Average
interest rate
reduction
|
||||||||||
North America |
||||||||||||||||
Residential first mortgages |
15,435 |
$ |
1,866 |
$ |
43 |
$ |
30 |
$ |
7 |
1 |
% |
|||||
Home equity loans |
6,102 |
228 |
3 |
— |
13 |
2 |
||||||||||
Credit cards |
136,501 |
601 |
— |
— |
— |
15 |
||||||||||
Installment and other revolving |
36,086 |
269 |
— |
— |
— |
6 |
||||||||||
Commercial markets(6)
|
137 |
27 |
— |
— |
1 |
— |
||||||||||
Total(8)
|
194,261 |
$ |
2,991 |
$ |
46 |
$ |
30 |
$ |
21 |
|||||||
International |
||||||||||||||||
Residential first mortgages |
2,127 |
$ |
79 |
$ |
— |
$ |
— |
$ |
1 |
1 |
% |
|||||
Home equity loans |
53 |
9 |
— |
— |
— |
— |
||||||||||
Credit cards |
109,079 |
357 |
— |
— |
28 |
13 |
||||||||||
Installment and other revolving |
44,095 |
216 |
— |
— |
11 |
10 |
||||||||||
Commercial markets(6)
|
271 |
156 |
— |
— |
— |
|||||||||||
Total(8)
|
155,625 |
$ |
817 |
$ |
— |
$ |
— |
$ |
40 |
|||||||
At and for the nine months ended September 30, 2013 |
||||||||||||||||
In millions of dollars except number of loans modified |
Number of
loans modified
|
Post-
modification
recorded
investment(1)(2)
|
Deferred
principal(3)
|
Contingent
principal
forgiveness(4)
|
Principal
forgiveness(5)
|
Average
interest rate
reduction
|
||||||||||
North America |
||||||||||||||||
Residential first mortgages |
25,757 |
$ |
3,387 |
$ |
45 |
$ |
17 |
$ |
136 |
1 |
% |
|||||
Home equity loans |
10,319 |
460 |
1 |
— |
71 |
1 |
||||||||||
Credit cards |
123,073 |
613 |
— |
— |
— |
14 |
||||||||||
Installment and other revolving |
39,822 |
284 |
— |
— |
— |
7 |
||||||||||
Commercial markets(6)
|
166 |
25 |
— |
— |
— |
— |
||||||||||
Total(8)
|
199,137 |
$ |
4,769 |
$ |
46 |
$ |
17 |
$ |
207 |
|||||||
International |
||||||||||||||||
Residential first mortgages |
2,914 |
$ |
135 |
$ |
— |
$ |
— |
$ |
2 |
1 |
% |
|||||
Home equity loans |
48 |
1 |
— |
— |
— |
— |
||||||||||
Credit cards |
105,850 |
394 |
— |
— |
13 |
14 |
||||||||||
Installment and other revolving |
43,106 |
260 |
— |
— |
7 |
8 |
||||||||||
Commercial markets(6)
|
296 |
76 |
2 |
— |
— |
— |
||||||||||
Total(8)
|
152,214 |
$ |
866 |
$ |
2 |
$ |
— |
$ |
22 |
|||||||
(1) |
Post-modification balances include past due amounts that are capitalized at modification date. |
(2) |
Post-modification balances in North America include $240 million of residential first mortgages and $65 million of home equity loans to borrowers who have gone through Chapter 7 bankruptcy in the nine months ended September 30, 2014. These amounts include $144 million of residential first mortgages and $56 million of home equity loans that are newly classified as TDRs as a result of OCC guidance received in the nine months ended September 30, 2014, as described above.
|
(3) |
Represents portion of contractual loan principal that is non-interest bearing but still due from the borrower. Such deferred principal is charged off at the time of permanent modification to the extent that the related loan balance exceeds the underlying collateral value. |
(4) |
Represents portion of contractual loan principal that is non-interest bearing and, depending upon borrower performance, eligible for forgiveness. |
(5) |
Represents portion of contractual loan principal that was forgiven at the time of permanent modification. |
Three Months Ended September 30, |
Nine Months Ended September 30, |
|||||||||||
In millions of dollars |
2014 |
2013 |
2014 |
2013 |
||||||||
North America |
||||||||||||
Residential first mortgages |
$ |
149 |
$ |
440 |
$ |
562 |
$ |
1,221 |
||||
Home equity loans |
16 |
52 |
55 |
155 |
||||||||
Credit cards |
47 |
41 |
146 |
155 |
||||||||
Installment and other revolving |
26 |
22 |
68 |
67 |
||||||||
Commercial markets |
1 |
1 |
8 |
3 |
||||||||
Total |
$ |
239 |
$ |
556 |
$ |
839 |
$ |
1,601 |
||||
International |
||||||||||||
Residential first mortgages |
$ |
6 |
$ |
11 |
$ |
16 |
$ |
43 |
||||
Home equity loans |
— |
— |
— |
— |
||||||||
Credit cards |
53 |
44 |
175 |
146 |
||||||||
Installment and other revolving |
24 |
22 |
79 |
78 |
||||||||
Commercial markets |
2 |
5 |
102 |
9 |
||||||||
Total |
$ |
85 |
$ |
82 |
$ |
372 |
$ |
276 |
||||
In millions of dollars |
September 30, 2014 |
December 31, 2013 |
||||
Corporate |
||||||
In U.S. offices |
||||||
Commercial and industrial |
$ |
36,516 |
$ |
32,704 |
||
Financial institutions |
31,916 |
25,102 |
||||
Mortgage and real estate(1)
|
32,285 |
29,425 |
||||
Installment, revolving credit and other |
30,378 |
34,434 |
||||
Lease financing |
1,737 |
1,647 |
||||
$ |
132,832 |
$ |
123,312 |
|||
In offices outside the U.S. |
||||||
Commercial and industrial |
$ |
80,304 |
$ |
82,663 |
||
Financial institutions |
35,854 |
38,372 |
||||
Mortgage and real estate(1)
|
6,243 |
6,274 |
||||
Installment, revolving credit and other |
20,151 |
18,714 |
||||
Lease financing |
396 |
527 |
||||
Governments and official institutions |
2,264 |
2,341 |
||||
$ |
145,212 |
$ |
148,891 |
|||
Total Corporate loans |
$ |
278,044 |
$ |
272,203 |
||
Net unearned income |
(536 |
) |
(562 |
) |
||
Corporate loans, net of unearned income |
$ |
277,508 |
$ |
271,641 |
||
(1)
|
Loans secured primarily by real estate. |
In millions of dollars |
30-89 days
past due
and accruing(1)
|
≥ 90 days
past due and
accruing(1)
|
Total past due
and accruing
|
Total
non-accrual(2)
|
Total
current(3)
|
Total
loans (4)
|
||||||||||||
Commercial and industrial |
$ |
212 |
$ |
1 |
$ |
213 |
$ |
733 |
$ |
113,211 |
$ |
114,157 |
||||||
Financial institutions |
5 |
— |
5 |
266 |
66,226 |
66,497 |
||||||||||||
Mortgage and real estate |
100 |
94 |
194 |
237 |
37,935 |
38,366 |
||||||||||||
Leases |
4 |
— |
4 |
49 |
2,080 |
2,133 |
||||||||||||
Other |
57 |
2 |
59 |
65 |
51,865 |
51,989 |
||||||||||||
Loans at fair value |
4,366 |
|||||||||||||||||
Total |
$ |
378 |
$ |
97 |
$ |
475 |
$ |
1,350 |
$ |
271,317 |
$ |
277,508 |
||||||
(1) |
Corporate loans that are 90 days past due are generally classified as non-accrual. Corporate loans are considered past due when principal or interest is contractually due but unpaid.
|
(2) |
Citi generally does not manage corporate loans on a delinquency basis. Non-accrual loans generally include those loans that are ≥ 90 days past due or those loans for which Citi believes, based on actual experience and a forward-looking assessment of the collectability of the loan in full, that the payment of interest or principal is doubtful.
|
(3) |
Corporate loans are past due when principal or interest is contractually due but unpaid. Loans less than 30 days past due are presented as current.
|
(4) |
Total loans include loans at fair value, which are not included in the various delinquency columns. |
In millions of dollars |
30-89 days
past due
and accruing(1)
|
≥ 90 days
past due and
accruing(1)
|
Total past due
and accruing
|
Total
non-accrual(2)
|
Total
current(3)
|
Total
loans (4)
|
||||||||||||
Commercial and industrial |
$ |
72 |
$ |
5 |
$ |
77 |
$ |
769 |
$ |
112,985 |
$ |
113,831 |
||||||
Financial institutions |
— |
— |
— |
365 |
61,704 |
62,069 |
||||||||||||
Mortgage and real estate |
183 |
175 |
358 |
515 |
34,027 |
34,900 |
||||||||||||
Leases |
9 |
1 |
10 |
189 |
1,975 |
2,174 |
||||||||||||
Other |
47 |
2 |
49 |
70 |
54,476 |
54,595 |
||||||||||||
Loans at fair value |
4,072 |
|||||||||||||||||
Total |
$ |
311 |
$ |
183 |
$ |
494 |
$ |
1,908 |
$ |
265,167 |
$ |
271,641 |
||||||
(1)
|
Corporate loans that are 90 days past due are generally classified as non-accrual. Corporate loans are considered past due when principal or interest is contractually due but unpaid.
|
(2)
|
Citi generally does not manage corporate loans on a delinquency basis. Non-accrual loans generally include those loans that are ≥ 90 days past due or those loans for which Citi believes, based on actual experience and a forward-looking assessment of the collectability of the loan in full, that the payment of interest or principal is doubtful.
|
(3)
|
Corporate loans are past due when principal or interest is contractually due but unpaid. Loans less than 30 days past due are presented as current.
|
(4) |
Total loans include loans at fair value, which are not included in the various delinquency columns. |
Recorded investment in loans(1)
|
||||||
In millions of dollars |
September 30, 2014 |
December 31, 2013 |
||||
Investment grade(2)
|
||||||
Commercial and industrial |
$ |
82,143 |
$ |
79,360 |
||
Financial institutions |
53,338 |
49,699 |
||||
Mortgage and real estate |
16,015 |
13,178 |
||||
Leases |
1,615 |
1,600 |
||||
Other |
48,108 |
51,370 |
||||
Total investment grade |
$ |
201,219 |
$ |
195,207 |
||
Non-investment grade(2)
|
||||||
Accrual |
||||||
Commercial and industrial |
$ |
31,282 |
$ |
33,702 |
||
Financial institutions |
12,892 |
12,005 |
||||
Mortgage and real estate |
3,940 |
4,205 |
||||
Leases |
469 |
385 |
||||
Other |
3,816 |
3,155 |
||||
Non-accrual |
||||||
Commercial and industrial |
733 |
769 |
||||
Financial institutions |
266 |
365 |
||||
Mortgage and real estate |
237 |
515 |
||||
Leases |
49 |
189 |
||||
Other |
65 |
70 |
||||
Total non-investment grade |
$ |
53,749 |
$ |
55,360 |
||
Private Banking loans managed on a delinquency basis (2)
|
$ |
18,174 |
$ |
17,002 |
||
Loans at fair value |
4,366 |
4,072 |
||||
Corporate loans, net of unearned income |
$ |
277,508 |
$ |
271,641 |
||
(1) |
Recorded investment in a loan includes net deferred loan fees and costs, unamortized premium or discount, less any direct write-downs. |
(2) |
Held-for-investment loans are accounted for on an amortized cost basis. |
Three Months Ended September 30, 2014 |
Nine Months Ended September 30, 2014 |
|||||||||||||||||
September 30, 2014 |
||||||||||||||||||
In millions of dollars |
Recorded
investment(1)
|
Unpaid
principal balance
|
Related specific
allowance
|
Average
carrying value(2)
|
Interest income
recognized(3)
|
Interest income recognized(3) |
||||||||||||
Non-accrual Corporate loans |
||||||||||||||||||
Commercial and industrial |
$ |
733 |
$ |
1,059 |
$ |
197 |
$ |
707 |
$ |
10 |
$ |
24 |
||||||
Financial institutions |
266 |
277 |
4 |
306 |
— |
4 |
||||||||||||
Mortgage and real estate |
237 |
276 |
17 |
329 |
— |
7 |
||||||||||||
Lease financing |
49 |
50 |
29 |
119 |
— |
— |
||||||||||||
Other |
65 |
194 |
19 |
64 |
4 |
4 |
||||||||||||
Total non-accrual Corporate loans |
$ |
1,350 |
$ |
1,856 |
$ |
266 |
$ |
1,525 |
$ |
14 |
$ |
39 |
||||||
Balance at December 31, 2013 |
||||||||||||
In millions of dollars |
Recorded
investment(1)
|
Unpaid
principal balance
|
Related specific
allowance
|
Average
carrying value(2)
|
||||||||
Non-accrual Corporate loans |
||||||||||||
Commercial and industrial |
$ |
769 |
$ |
1,074 |
$ |
79 |
$ |
967 |
||||
Financial institutions |
365 |
382 |
3 |
378 |
||||||||
Mortgage and real estate |
515 |
651 |
35 |
585 |
||||||||
Lease financing |
189 |
190 |
131 |
189 |
||||||||
Other |
70 |
216 |
20 |
64 |
||||||||
Total non-accrual Corporate loans |
$ |
1,908 |
$ |
2,513 |
$ |
268 |
$ |
2,183 |
||||
September 30, 2014 |
December 31, 2013 |
|||||||||||
In millions of dollars |
Recorded
investment(1)
|
Related specific
allowance
|
Recorded
investment(1)
|
Related specific
allowance
|
||||||||
Non-accrual Corporate loans with valuation allowances |
||||||||||||
Commercial and industrial |
$ |
266 |
$ |
197 |
$ |
401 |
$ |
79 |
||||
Financial institutions |
17 |
4 |
24 |
3 |
||||||||
Mortgage and real estate |
42 |
17 |
253 |
35 |
||||||||
Lease financing |
47 |
29 |
186 |
131 |
||||||||
Other |
63 |
19 |
61 |
20 |
||||||||
Total non-accrual Corporate loans with specific allowance |
$ |
435 |
$ |
266 |
$ |
925 |
$ |
268 |
||||
Non-accrual Corporate loans without specific allowance |
||||||||||||
Commercial and industrial |
$ |
466 |
$ |
368 |
||||||||
Financial institutions |
249 |
341 |
||||||||||
Mortgage and real estate |
196 |
262 |
||||||||||
Lease financing |
2 |
3 |
||||||||||
Other |
1 |
9 |
||||||||||
Total non-accrual Corporate loans without specific allowance |
$ |
914 |
N/A |
$ |
983 |
N/A |
||||||
(1) |
Recorded investment in a loan includes net deferred loan fees and costs, unamortized premium or discount, less any direct write-downs. |
(2) |
Average carrying value represents the average recorded investment balance and does not include related specific allowance. |
(3) |
Interest income recognized for the three- and nine-month periods ended September 30, 2013 was $6 million and $24 million, respectively.
|
In millions of dollars |
Carrying
Value
|
TDRs
involving changes
in the amount
and/or timing of
principal payments(1)
|
TDRs
involving changes
in the amount
and/or timing of
interest payments(2)
|
TDRs
involving changes
in the amount
and/or timing of
both principal and
interest payments
|
||||||||
Commercial and industrial |
$ |
1 |
$ |
— |
$ |
— |
$ |
1 |
||||
Financial institutions |
— |
— |
— |
— |
||||||||
Mortgage and real estate |
3 |
1 |
— |
2 |
||||||||
Other |
— |
— |
— |
— |
||||||||
Total |
$ |
4 |
$ |
1 |
$ |
— |
$ |
3 |
||||
(1) |
TDRs involving changes in the amount or timing of principal payments may involve principal forgiveness or deferral of periodic and/or final principal payments. Because forgiveness of principal is rare for commercial loans, modifications typically have little to no impact on the loans’ projected cash flows and thus little to no impact on the allowance established for the loan. Charge-offs for amounts deemed uncollectable may be recorded at the time of the restructuring or may have already been recorded in prior periods such that no charge-off is required at the time of the modification. |
(2) |
TDRs involving changes in the amount or timing of interest payments may involve a below-market interest rate. |
In millions of dollars |
Carrying
Value
|
TDRs
involving changes
in the amount
and/or timing of
principal payments(1)
|
TDRs
involving changes
in the amount
and/or timing of
interest payments(2)
|
TDRs
involving changes
in the amount
and/or timing of
both principal and
interest payments
|
||||||||
Commercial and industrial |
$ |
11 |
$ |
— |
$ |
— |
$ |
11 |
||||
Financial institutions |
— |
— |
— |
— |
||||||||
Mortgage and real estate |
1 |
— |
— |
1 |
||||||||
Other |
1 |
— |
— |
1 |
||||||||
Total |
$ |
13 |
$ |
— |
$ |
— |
$ |
13 |
||||
(1) |
TDRs involving changes in the amount or timing of principal payments may involve principal forgiveness or deferral of periodic and/or final principal payments. Because forgiveness of principal is rare for commercial loans, modifications typically have little to no impact on the loans’ projected cash flows and thus little to no impact on the allowance established for the loan. Charge-offs for amounts deemed uncollectable may be recorded at the time of the restructuring or may have already been recorded in prior periods such that no charge-off is required at the time of the modification. |
(2) |
TDRs involving changes in the amount or timing of interest payments may involve a below-market interest rate. |
In millions of dollars |
Carrying
Value
|
TDRs
involving changes
in the amount
and/or timing of
principal payments(1)
|
TDRs
involving changes
in the amount
and/or timing of
interest payments(2)
|
TDRs
involving changes
in the amount
and/or timing of
both principal and
interest payments
|
||||||||
Commercial and industrial |
$ |
48 |
$ |
30 |
$ |
17 |
$ |
1 |
||||
Financial institutions |
— |
— |
— |
— |
||||||||
Mortgage and real estate |
8 |
5 |
1 |
2 |
||||||||
Other |
— |
— |
— |
— |
||||||||
Total |
$ |
56 |
$ |
35 |
$ |
18 |
$ |
3 |
||||
(1) |
TDRs involving changes in the amount or timing of principal payments may involve principal forgiveness or deferral of periodic and/or final principal payments. Because forgiveness of principal is rare for commercial loans, modifications typically have little to no impact on the loans’ projected cash flows and thus little to no impact on the allowance established for the loan. Charge-offs for amounts deemed uncollectable may be recorded at the time of the restructuring or may have already been recorded in prior periods such that no charge-off is required at the time of the modification. |
(2) |
TDRs involving changes in the amount or timing of interest payments may involve a below-market interest rate. |
In millions of dollars |
Carrying
Value
|
TDRs
involving changes
in the amount
and/or timing of
principal payments(1)
|
TDRs
involving changes
in the amount
and/or timing of
interest payments(2)
|
TDRs
involving changes
in the amount
and/or timing of
both principal and
interest payments
|
||||||||
Commercial and industrial |
$ |
100 |
$ |
55 |
$ |
28 |
$ |
17 |
||||
Financial institutions |
— |
— |
||||||||||
Mortgage and real estate |
15 |
— |
14 |
1 |
||||||||
Other |
$ |
5 |
$ |
— |
$ |
— |
$ |
5 |
||||
Total |
$ |
120 |
$ |
55 |
$ |
42 |
$ |
23 |
||||
(1) |
TDRs involving changes in the amount or timing of principal payments may involve principal forgiveness or deferral of periodic and/or final principal payments. Because forgiveness of principal is rare for commercial loans, modifications typically have little to no impact on the loans’ projected cash flows and thus little to no impact on the allowance established for the loan. Charge-offs for amounts deemed uncollectable may be recorded at the time of the restructuring or may have already been recorded in prior periods such that no charge-off is required at the time of the modification. |
(2) |
TDRs involving changes in the amount or timing of interest payments may involve a below-market interest rate. |
TDR balances at |
TDR loans in payment default
during the three months ended
|
TDR loans in payment default nine months ended |
TDR balances at |
TDR loans in
payment default
during the three months ended
|
TDR loans in payment default nine months ended |
|||||||||||||
In millions of dollars |
September 30, 2014 |
September 30, 2014 |
September 30, 2014 |
September 30, 2013 |
September 30, 2013 |
September 30, 2013 |
||||||||||||
Commercial and industrial |
$ |
161 |
$ |
— |
$ |
— |
$ |
167 |
$ |
— |
$ |
15 |
||||||
Loans to financial institutions |
— |
— |
— |
16 |
— |
— |
||||||||||||
Mortgage and real estate |
125 |
— |
— |
202 |
— |
2 |
||||||||||||
Other |
326 |
— |
— |
393 |
— |
— |
||||||||||||
Total |
$ |
612 |
$ |
— |
$ |
— |
$ |
778 |
$ |
— |
$ |
17 |
||||||
Three Months Ended September 30, |
Nine Months Ended September 30, |
|||||||||||
In millions of dollars |
2014 |
2013 |
2014 |
2013 |
||||||||
Allowance for loan losses at beginning of period |
$ |
17,890 |
$ |
21,580 |
$ |
19,648 |
$ |
25,455 |
||||
Gross credit losses |
(2,586 |
) |
(2,974 |
) |
(8,381 |
) |
(9,675 |
) |
||||
Gross recoveries (1)
|
489 |
544 |
1,656 |
1,759 |
||||||||
Net credit losses (NCLs) |
$ |
(2,097 |
) |
$ |
(2,430 |
) |
$ |
(6,725 |
) |
$ |
(7,916 |
) |
NCLs |
$ |
2,097 |
$ |
2,430 |
$ |
6,725 |
$ |
7,916 |
||||
Net reserve releases |
(492 |
) |
(767 |
) |
(1,573 |
) |
(1,715 |
) |
||||
Net specific reserve builds (releases) |
(30 |
) |
(11 |
) |
(205 |
) |
(508 |
) |
||||
Total provision for credit losses |
$ |
1,575 |
$ |
1,652 |
$ |
4,947 |
$ |
5,693 |
||||
Other, net (2)
|
(453 |
) |
(197 |
) |
(955 |
) |
(2,627 |
) |
||||
Allowance for loan losses at end of period |
$ |
16,915 |
$ |
20,605 |
$ |
16,915 |
$ |
20,605 |
||||
Allowance for credit losses on unfunded lending commitments at beginning of period (3)
|
$ |
1,176 |
$ |
1,133 |
$ |
1,229 |
$ |
1,119 |
||||
Provision for unfunded lending commitments |
(30 |
) |
103 |
(88 |
) |
114 |
||||||
Other, net |
(6 |
) |
26 |
(1 |
) |
29 |
||||||
Allowance for credit losses on unfunded lending commitments at end of period (3)
|
$ |
1,140 |
$ |
1,262 |
$ |
1,140 |
$ |
1,262 |
||||
Total allowance for loans, leases, and unfunded lending commitments |
$ |
18,055 |
$ |
21,867 |
$ |
18,055 |
$ |
21,867 |
||||
(1) |
Recoveries have been reduced by certain collection costs that are incurred only if collection efforts are successful. |
(2) |
The third quarter of 2014 includes a reduction of approximately $259 million related to transfers to held-for-sale (HFS) of various loan portfolios, including a reduction of $151 million related to a transfer of a real estate loan portfolio to HFS and a reduction of approximately $108 million related to the transfer of various EMEA loan portfolios to HFS. Additionally, the third quarter includes a reduction of approximately $181 million related to foreign currency translation. The second quarter of 2014 includes a reduction of approximately $480 million related to the sale or transfers to HFS of various loan portfolios, including a reduction of approximately $204 million and $177 million related to the transfers to HFS of consumer operations in Greece and Spain and $29 million related to the sale of the Honduras consumer business, and $66 million related to a transfer of a real estate loan portfolio to HFS. These amounts are partially offset by foreign currency translation on the entire allowance balance. The first quarter of 2014 includes reductions of approximately $79 million related to the sale or transfer to HFS of various loan portfolios. The third quarter of 2013 includes a reduction of approximately $214 million related to the sale or transfer to HFS of various loan portfolios. The second quarter of 2013 includes a reduction of approximately $650 million related to the sale or transfer to HFS of various U.S. loan portfolios and a reduction of approximately $360 million related to the transfer of Credicard to discontinued operations held for sale. Additionally, a reduction of approximately $90 million related to a transfer to HFS of a loan portfolio in Greece and a reduction of approximately $220 million related to foreign currency translation. The first quarter of 2013 includes reductions of approximately $855 million related to the sale or transfer to HFS of various U.S. loan portfolios and a reduction of approximately $165 million related to a transfer to HFS of a loan portfolio in Greece.
|
(3) |
Represents additional credit loss reserves for unfunded lending commitments and letters of credit recorded in Other liabilities on the Consolidated Balance Sheet.
|
Three Months Ended September 30, 2014 |
Nine Months Ended September 30, 2014 |
|||||||||||||||||
In millions of dollars |
Corporate |
Consumer |
Total |
Corporate |
Consumer |
Total |
||||||||||||
Allowance for loan losses at beginning of period |
$ |
2,370 |
$ |
15,520 |
$ |
17,890 |
$ |
2,584 |
$ |
17,064 |
$ |
19,648 |
||||||
Charge-offs |
(43 |
) |
(2,543 |
) |
(2,586 |
) |
(264 |
) |
(8,117 |
) |
(8,381 |
) |
||||||
Recoveries |
61 |
428 |
489 |
126 |
1,530 |
1,656 |
||||||||||||
Replenishment of net charge-offs |
(18 |
) |
2,115 |
2,097 |
138 |
6,587 |
6,725 |
|||||||||||
Net reserve releases |
(99 |
) |
(393 |
) |
(492 |
) |
(226 |
) |
(1,347 |
) |
(1,573 |
) |
||||||
Net specific reserve releases |
87 |
(117 |
) |
(30 |
) |
2 |
(207 |
) |
(205 |
) |
||||||||
Other |
(18 |
) |
(435 |
) |
(453 |
) |
(20 |
) |
(935 |
) |
(955 |
) |
||||||
Ending balance |
$ |
2,340 |
$ |
14,575 |
$ |
16,915 |
$ |
2,340 |
$ |
14,575 |
$ |
16,915 |
||||||
Three Months Ended September 30, 2013 |
Nine Months Ended September 30, 2013 |
|||||||||||||||||
In millions of dollars |
Corporate |
Consumer |
Total |
Corporate |
Consumer |
Total |
||||||||||||
Allowance for loan losses at beginning of period |
$ |
2,708 |
$ |
18,872 |
$ |
21,580 |
$ |
2,776 |
$ |
22,679 |
$ |
25,455 |
||||||
Charge-offs |
(148 |
) |
(2,826 |
) |
(2,974 |
) |
(305 |
) |
(9,370 |
) |
(9,675 |
) |
||||||
Recoveries |
52 |
492 |
544 |
119 |
1,640 |
1,759 |
||||||||||||
Replenishment of net charge-offs |
96 |
2,334 |
2,430 |
186 |
7,730 |
7,916 |
||||||||||||
Net reserve releases |
18 |
(785 |
) |
(767 |
) |
(111 |
) |
(1,604 |
) |
(1,715 |
) |
|||||||
Net specific reserve builds (releases) |
(45 |
) |
34 |
(11 |
) |
27 |
(535 |
) |
(508 |
) |
||||||||
Other |
12 |
(209 |
) |
(197 |
) |
1 |
(2,628 |
) |
(2,627 |
) |
||||||||
Ending balance |
$ |
2,693 |
$ |
17,912 |
$ |
20,605 |
$ |
2,693 |
$ |
17,912 |
$ |
20,605 |
||||||
September 30, 2014 |
December 31, 2013 |
|||||||||||||||||
In millions of dollars |
Corporate |
Consumer |
Total |
Corporate |
Consumer |
Total |
||||||||||||
Allowance for loan losses |
||||||||||||||||||
Determined in accordance with ASC 450-20 |
$ |
1,995 |
$ |
10,364 |
$ |
12,359 |
$ |
2,232 |
$ |
12,402 |
$ |
14,634 |
||||||
Determined in accordance with ASC 310-10-35 |
267 |
4,192 |
4,459 |
268 |
4,633 |
4,901 |
||||||||||||
Determined in accordance with ASC 310-30 |
78 |
19 |
97 |
84 |
29 |
113 |
||||||||||||
Total allowance for loan losses |
$ |
2,340 |
$ |
14,575 |
$ |
16,915 |
$ |
2,584 |
$ |
17,064 |
$ |
19,648 |
||||||
Loans, net of unearned income |
||||||||||||||||||
Loans collectively evaluated for impairment in accordance with ASC 450-20 |
$ |
271,391 |
$ |
354,662 |
$ |
626,053 |
$ |
265,230 |
$ |
368,449 |
$ |
633,679 |
||||||
Loans individually evaluated for impairment in accordance with ASC 310-10-35 |
1,666 |
21,203 |
22,869 |
2,222 |
23,793 |
26,015 |
||||||||||||
Loans acquired with deteriorated credit quality in accordance with ASC 310-30 |
85 |
408 |
493 |
117 |
632 |
749 |
||||||||||||
Loans held at fair value |
4,366 |
45 |
4,411 |
4,072 |
957 |
5,029 |
||||||||||||
Total loans, net of unearned income |
$ |
277,508 |
$ |
376,318 |
$ |
653,826 |
$ |
271,641 |
$ |
393,831 |
$ |
665,472 |
||||||
In millions of dollars |
|||
Balance at December 31, 2013 |
25,009 |
||
Foreign exchange translation and other |
1 |
||
Divestitures |
(2 |
) |
|
Balance at March 31, 2014 |
$ |
25,008 |
|
Foreign exchange translation and other |
208 |
||
Divestitures |
(129 |
) |
|
Balance at June 30, 2014 |
25,087 |
||
Foreign exchange translation and other |
(586 |
) |
|
Divestitures |
(1 |
) |
|
Balance at September 30, 2014 |
24,500 |
||
In millions of dollars |
|||
Reporting Unit(1)
|
Goodwill |
||
North America Global Consumer Banking |
$ |
6,765 |
|
EMEA Global Consumer Banking |
346 |
||
Asia Global Consumer Banking |
4,987 |
||
Latin America Global Consumer Banking |
1,733 |
||
Banking |
3,786 |
||
Markets and Securities Services |
6,841 |
||
Latin America Retirement Services |
42 |
||
Total |
$ |
24,500 |
|
(1) |
Citi Holdings—Other is excluded from the table as there is no goodwill allocated to it.
|
September 30, 2014 |
December 31, 2013 |
|||||||||||||||||
In millions of dollars |
Gross
carrying
amount
|
Accumulated
amortization
|
Net
carrying
amount
|
Gross
carrying
amount
|
Accumulated
amortization
|
Net
carrying
amount
|
||||||||||||
Purchased credit card relationships |
$ |
7,521 |
$ |
6,229 |
$ |
1,292 |
$ |
7,552 |
$ |
6,006 |
$ |
1,546 |
||||||
Core deposit intangibles |
1,210 |
1,059 |
151 |
1,255 |
1,052 |
203 |
||||||||||||
Other customer relationships |
615 |
344 |
271 |
675 |
389 |
286 |
||||||||||||
Present value of future profits |
237 |
154 |
83 |
238 |
146 |
92 |
||||||||||||
Indefinite-lived intangible assets |
314 |
— |
314 |
323 |
— |
323 |
||||||||||||
Other(1)
|
5,088 |
2,674 |
2,414 |
5,073 |
2,467 |
2,606 |
||||||||||||
Intangible assets (excluding MSRs) |
$ |
14,985 |
$ |
10,460 |
$ |
4,525 |
$ |
15,116 |
$ |
10,060 |
$ |
5,056 |
||||||
Mortgage servicing rights (MSRs) |
2,093 |
— |
2,093 |
2,718 |
— |
2,718 |
||||||||||||
Total intangible assets |
$ |
17,078 |
$ |
10,460 |
$ |
6,618 |
$ |
17,834 |
$ |
10,060 |
$ |
7,774 |
||||||
(1) |
Includes contract-related intangible assets. |
Net carrying amount at |
Net carrying
amount at
|
|||||||||||||||||
In millions of dollars |
December 31, 2013 |
Acquisitions/
divestitures
|
Amortization |
Impairments |
FX and
other (1)
|
September 30, 2014 |
||||||||||||
Purchased credit card relationships |
$ |
1,546 |
$ |
(9 |
) |
$ |
(247 |
) |
$ |
2 |
$ |
1,292 |
||||||
Core deposit intangibles |
203 |
(6 |
) |
(44 |
) |
(2 |
) |
151 |
||||||||||
Other customer relationships |
286 |
14 |
(21 |
) |
(8 |
) |
271 |
|||||||||||
Present value of future profits |
92 |
— |
(9 |
) |
— |
83 |
||||||||||||
Indefinite-lived intangible assets |
323 |
(2 |
) |
— |
(7 |
) |
314 |
|||||||||||
Other |
2,606 |
(252 |
) |
(2 |
) |
62 |
2,414 |
|||||||||||
Intangible assets (excluding MSRs) |
$ |
5,056 |
$ |
(3 |
) |
$ |
(573 |
) |
$ |
(2 |
) |
$ |
47 |
$ |
4,525 |
|||
Mortgage servicing rights (MSRs) (2)
|
2,718 |
2,093 |
||||||||||||||||
Total intangible assets |
$ |
7,774 |
$ |
6,618 |
||||||||||||||
(1) |
Includes foreign exchange translation and purchase accounting adjustments. |
(2) |
See Note 20 to the Consolidated Financial Statements for the roll-forward of MSRs. |
In millions of dollars |
September 30, 2014 |
December 31, 2013 |
||||
Commercial paper |
||||||
Significant Citibank Entities(1)
|
$ |
17,600 |
$ |
17,677 |
||
Parent(2)
|
163 |
201 |
||||
Total Commercial paper |
$ |
17,763 |
$ |
17,878 |
||
Other borrowings (3)
|
47,075 |
41,066 |
||||
Total |
$ |
64,838 |
$ |
58,944 |
||
(1) |
Significant Citibank Entities consist of Citibank, N.A. units domiciled in the U.S., Western Europe, Hong Kong and Singapore. |
(2) |
Parent includes the parent holding company (Citigroup Inc.) and Citi’s broker-dealer subsidiaries that are consolidated into Citigroup. |
(3) |
At both September 30, 2014 and December 31, 2013, collateralized short-term advances from the Federal Home Loan Banks were $11 billion.
|
In millions of dollars |
September 30, 2014 |
December 31, 2013 |
||||
Citigroup Inc.(1)
|
$ |
147,892 |
$ |
156,804 |
||
Bank(2)
|
67,908 |
56,457 |
||||
Broker-dealer(3)
|
8,042 |
7,855 |
||||
Total(4)
|
$ |
223,842 |
$ |
221,116 |
||
(1)
|
Parent holding company, Citigroup Inc. |
(2) |
Represents the Significant Citibank Entities as well as other Citibank and Banamex entities. At September 30, 2014 and December 31, 2013, collateralized long-term advances from the Federal Home Loan Banks were $23.3 billion and $14.0 billion, respectively.
|
(3) |
Represents broker-dealer subsidiaries that are consolidated into Citigroup Inc., the parent holding company. |
(4) |
Includes senior notes with carrying values of $87 million issued to outstanding Safety First Trusts at December 31, 2013. As of September 30, 2014, no amounts were outstanding to these trusts.
|
Junior subordinated debentures owned by trust |
||||||||||||||
Trust |
Issuance
date
|
Securities
issued
|
Liquidation
value(1)
|
Coupon
rate(2)
|
Common
shares
issued
to parent
|
Amount |
Maturity |
Redeemable
by issuer
beginning
|
||||||
In millions of dollars, except share amounts
|
||||||||||||||
Citigroup Capital III |
Dec. 1996 |
194,053 |
$ |
194 |
7.625% |
6,003 |
$ |
200 |
Dec. 1, 2036 |
Not redeemable |
||||
Citigroup Capital XIII |
Sept. 2010 |
89,840,000 |
2,246 |
7.875% |
1,000 |
2,246 |
Oct. 30, 2040 |
Oct. 30, 2015 |
||||||
Citigroup Capital XVIII |
Jun. 2007 |
99,901 |
162 |
6.829% |
50 |
162 |
June 28, 2067 |
June 28, 2017 |
||||||
Total obligated |
$ |
2,602 |
$ |
2,608 |
||||||||||
(1) |
Represents the notional value received by investors from the trusts at the time of issuance. |
(2) |
In each case, the coupon rate on the subordinated debentures is the same as that on the trust preferred securities. |
In millions of dollars |
Net
unrealized
gains (losses)
on investment securities
|
Cash flow hedges (1)
|
Benefit plans (2)
|
Foreign
currency
translation
adjustment,
net of hedges (CTA)(3)(4)
|
Accumulated
other
comprehensive income (loss)
|
||||||||||
Balance, June 30, 2014 |
$ |
(206 |
) |
$ |
(1,007 |
) |
$ |
(4,166 |
) |
$ |
(12,768 |
) |
$ |
(18,147 |
) |
Other comprehensive income (losses) before reclassifications |
$ |
(173 |
) |
$ |
(42 |
) |
$ |
17 |
$ |
(1,721 |
) |
$ |
(1,919 |
) |
|
Increase (decrease) due to amounts reclassified from AOCI |
(34 |
) |
70 |
54 |
— |
90 |
|||||||||
Change, net of taxes |
$ |
(207 |
) |
$ |
28 |
$ |
71 |
$ |
(1,721 |
) |
$ |
(1,829 |
) |
||
Balance at September 30, 2014 |
$ |
(413 |
) |
$ |
(979 |
) |
$ |
(4,095 |
) |
$ |
(14,489 |
) |
$ |
(19,976 |
) |
In millions of dollars |
|||||||||||||||
Balance, December 31, 2013 |
$ |
(1,640 |
) |
$ |
(1,245 |
) |
$ |
(3,989 |
) |
$ |
(12,259 |
) |
$ |
(19,133 |
) |
Other comprehensive income (losses) before reclassifications |
$ |
1,242 |
$ |
62 |
$ |
(240 |
) |
$ |
(2,230 |
) |
$ |
(1,166 |
) |
||
Increase (decrease) due to amounts reclassified from AOCI |
(15 |
) |
204 |
134 |
— |
323 |
|||||||||
Change, net of taxes |
$ |
1,227 |
$ |
266 |
$ |
(106 |
) |
$ |
(2,230 |
) |
$ |
(843 |
) |
||
Balance at September 30, 2014 |
$ |
(413 |
) |
$ |
(979 |
) |
$ |
(4,095 |
) |
$ |
(14,489 |
) |
$ |
(19,976 |
) |
In millions of dollars |
|||||||||||||||
Balance, June 30, 2013 |
$ |
(1,301 |
) |
$ |
(1,671 |
) |
$ |
(4,615 |
) |
$ |
(12,337 |
) |
$ |
(19,924 |
) |
Other comprehensive income before reclassifications |
$ |
7 |
$ |
177 |
$ |
261 |
$ |
506 |
$ |
951 |
|||||
Increase (decrease) due to amounts reclassified from AOCI |
(15 |
) |
153 |
37 |
— |
175 |
|||||||||
Change, net of taxes |
$ |
(8 |
) |
$ |
330 |
$ |
298 |
$ |
506 |
$ |
1,126 |
||||
Balance at September 30, 2013 |
$ |
(1,309 |
) |
$ |
(1,341 |
) |
$ |
(4,317 |
) |
$ |
(11,831 |
) |
$ |
(18,798 |
) |
In millions of dollars |
|||||||||||||||
Balance, December 31, 2012 |
$ |
597 |
$ |
(2,293 |
) |
$ |
(5,270 |
) |
$ |
(9,930 |
) |
$ |
(16,896 |
) |
|
Other comprehensive income (losses) before reclassifications |
$ |
(1,582 |
) |
$ |
509 |
$ |
836 |
$ |
(1,901 |
) |
$ |
(2,138 |
) |
||
Increase (decrease) due to amounts reclassified from AOCI |
(324 |
) |
443 |
117 |
— |
236 |
|||||||||
Change, net of taxes |
$ |
(1,906 |
) |
$ |
952 |
$ |
953 |
$ |
(1,901 |
) |
$ |
(1,902 |
) |
||
Balance at September 30, 2013 |
$ |
(1,309 |
) |
$ |
(1,341 |
) |
$ |
(4,317 |
) |
$ |
(11,831 |
) |
$ |
(18,798 |
) |
(1) |
Primarily driven by Citigroup’s pay fixed/receive floating interest rate swap programs that hedge the floating rates on liabilities. |
(2) |
Primarily reflects adjustments based on the quarterly actuarial valuations of the Company’s significant pension and postretirement plans and amortization of amounts previously recognized in other comprehensive income. |
(3) |
Primarily reflects the movements in (by order of impact) the Mexican peso, Euro, British pound, and Australian dollar against the U.S. dollar, and changes in related tax effects and hedges for the quarter ended September 30, 2014. Primarily reflects the movements in (by order of impact) the Korean won, British pound, Euro, and Mexican peso against the U.S. dollar, and changes in related tax effects and hedges for the quarter ended June 30, 2014. Primarily reflects the movements in the Russian ruble, Argentine peso, Korean won, and Japanese yen against the U.S. dollar, and changes in related tax effects and hedges for the quarter ended March 31, 2014. Primarily reflects the movements in (by order of impact) the Korean won, Euro, British pound, Mexican peso and Polish zloty
|
(4) |
Reclassified to reflect the allocation of foreign currency translation between net unrealized gains (losses) on investment securities to CTA. |
In millions of dollars |
Pretax |
Tax effect |
After-tax |
||||||
Balance, June 30, 2014 |
$ |
(25,645 |
) |
$ |
7,498 |
$ |
(18,147 |
) |
|
Change in net unrealized gains (losses) on investment securities |
(321 |
) |
114 |
(207 |
) |
||||
Cash flow hedges |
45 |
(17 |
) |
28 |
|||||
Benefit plans |
107 |
(36 |
) |
71 |
|||||
Foreign currency translation adjustment |
(2,094 |
) |
373 |
(1,721 |
) |
||||
Change |
$ |
(2,263 |
) |
$ |
434 |
$ |
(1,829 |
) |
|
Balance, September 30, 2014 |
$ |
(27,908 |
) |
$ |
7,932 |
$ |
(19,976 |
) |
|
In millions of dollars |
Pretax |
Tax effect |
After-tax |
||||||
Balance, December 31, 2013 |
$ |
(27,596 |
) |
$ |
8,463 |
$ |
(19,133 |
) |
|
Change in net unrealized gains (losses) on investment securities |
1,967 |
(740 |
) |
1,227 |
|||||
Cash flow hedges |
431 |
(165 |
) |
266 |
|||||
Benefit plans |
(187 |
) |
81 |
(106 |
) |
||||
Foreign currency translation adjustment |
(2,523 |
) |
293 |
(2,230 |
) |
||||
Change |
$ |
(312 |
) |
$ |
(531 |
) |
$ |
(843 |
) |
Balance, September 30, 2014 |
$ |
(27,908 |
) |
$ |
7,932 |
$ |
(19,976 |
) |
|
In millions of dollars |
Pretax |
Tax effect |
After-tax |
||||||
Balance, June 30, 2013 |
$ |
(28,846 |
) |
$ |
8,922 |
$ |
(19,924 |
) |
|
Change in net unrealized gains (losses) on investment securities |
(20 |
) |
12 |
(8 |
) |
||||
Cash flow hedges |
514 |
(184 |
) |
330 |
|||||
Benefit plans |
326 |
(28 |
) |
298 |
|||||
Foreign currency translation adjustment |
338 |
168 |
506 |
||||||
Change |
$ |
1,158 |
$ |
(32 |
) |
$ |
1,126 |
||
Balance, September 30, 2013 |
$ |
(27,688 |
) |
$ |
8,890 |
$ |
(18,798 |
) |
|
In millions of dollars |
Pretax |
Tax effect |
After-tax |
||||||
Balance, December 31, 2012 |
$ |
(25,334 |
) |
$ |
8,438 |
$ |
(16,896 |
) |
|
Change in net unrealized gains (losses) on investment securities |
(3,013 |
) |
1,107 |
(1,906 |
) |
||||
Cash flow hedges |
1,519 |
(567 |
) |
952 |
|||||
Benefit plans |
1,323 |
(370 |
) |
953 |
|||||
Foreign currency translation adjustment |
(2,183 |
) |
282 |
(1,901 |
) |
||||
Change |
$ |
(2,354 |
) |
$ |
452 |
$ |
(1,902 |
) |
|
Balance, September 30, 2013 |
$ |
(27,688 |
) |
$ |
8,890 |
$ |
(18,798 |
) |
|
Increase (decrease) in AOCI due to amounts reclassified to Consolidated Statement of Income |
||||||
In millions of dollars |
Three Months Ended September 30, 2014 |
Nine Months Ended September 30, 2014 |
||||
Realized (gains) losses on sales of investments |
$ |
(136 |
) |
$ |
(348 |
) |
OTTI gross impairment losses |
91 |
329 |
||||
Subtotal, pretax |
$ |
(45 |
) |
$ |
(19 |
) |
Tax effect |
11 |
4 |
||||
Net realized (gains) losses on investment securities, after-tax(1)
|
$ |
(34 |
) |
$ |
(15 |
) |
Interest rate contracts |
$ |
84 |
$ |
218 |
||
Foreign exchange contracts |
30 |
114 |
||||
Subtotal, pretax |
$ |
114 |
$ |
332 |
||
Tax effect |
(44 |
) |
(128 |
) |
||
Amortization of cash flow hedges, after-tax(2)
|
$ |
70 |
$ |
204 |
||
Amortization of unrecognized |
||||||
Prior service cost (benefit) |
$ |
(11 |
) |
$ |
(30 |
) |
Net actuarial loss |
63 |
183 |
||||
Curtailment/settlement impact (3)
|
33 |
61 |
||||
Subtotal, pretax |
$ |
85 |
$ |
214 |
||
Tax effect |
(31 |
) |
(80 |
) |
||
Amortization of benefit plans, after-tax(3)
|
$ |
54 |
$ |
134 |
||
Foreign currency translation adjustment |
$ |
— |
$ |
— |
||
Total amounts reclassified out of AOCI, pretax |
$ |
154 |
$ |
527 |
||
Total tax effect |
(64 |
) |
(204 |
) |
||
Total amounts reclassified out of AOCI, after-tax |
$ |
90 |
$ |
323 |
||
(1) |
The pretax amount is reclassified to Realized gains (losses) on sales of investments, net and Gross impairment losses on the Consolidated Statement of Income. See Note 13 to the Consolidated Financial Statements for additional details.
|
(2) |
See Note 21 to the Consolidated Financial Statements for additional details. |
(3) |
See Notes 1 and 8 to the Consolidated Financial Statements for additional details. |
Increase (decrease) in AOCI due to amounts reclassified to Consolidated Statement of Income |
||||||
In millions of dollars |
Three Months Ended September 30, 2013 |
Nine months ended September 30, 2013 |
||||
Realized (gains) losses on sales of investments |
$ |
(63 |
) |
$ |
(764 |
) |
OTTI gross impairment losses |
39 |
270 |
||||
Subtotal, pretax |
$ |
(24 |
) |
$ |
(494 |
) |
Tax effect |
9 |
170 |
||||
Net realized (gains) losses on investment securities, after-tax(1)
|
$ |
(15 |
) |
$ |
(324 |
) |
Interest rate contracts |
$ |
211 |
$ |
596 |
||
Foreign exchange contracts |
38 |
124 |
||||
Subtotal, pretax |
$ |
249 |
$ |
720 |
||
Tax effect |
(96 |
) |
(277 |
) |
||
Amortization of cash flow hedges, after-tax(2)
|
$ |
153 |
$ |
443 |
||
Amortization of unrecognized |
||||||
Prior service cost (benefit) |
$ |
2 |
$ |
7 |
||
Net actuarial loss |
61 |
205 |
||||
Curtailment/settlement impact(3)
|
(2 |
) |
(2 |
) |
||
Cumulative effect of change in accounting policy(3)
|
— |
(20 |
) |
|||
Subtotal, pretax |
$ |
61 |
$ |
190 |
||
Tax effect |
(24 |
) |
(73 |
) |
||
Amortization of benefit plans, after-tax(3)
|
$ |
37 |
$ |
117 |
||
Foreign currency translation adjustment |
$ |
— |
$ |
— |
||
Total amounts reclassified out of AOCI, pretax |
$ |
286 |
$ |
416 |
||
Total tax effect |
(111 |
) |
(180 |
) |
||
Total amounts reclassified out of AOCI, after-tax |
$ |
175 |
$ |
236 |
||
(1) |
The pretax amount is reclassified to Realized gains (losses) on sales of investments, net and Gross impairment losses on the Consolidated Statement of Income. See Note 13 to the Consolidated Financial Statements for additional details.
|
(2) |
See Note 21 to the Consolidated Financial Statements for additional details. |
(3) |
See Notes 1 and 8 to the Consolidated Financial Statements for additional details. |
|
Carrying value
in millions of dollars
|
|||||||||||||||
Issuance date |
Redeemable by issuer beginning |
Dividend rate |
Redemption price per depositary share/preference share |
Number of depositary shares |
September 30, 2014 |
December 31, 2013 |
|||||||||
Series AA(1)
|
January 25, 2008 |
February 15, 2018 |
8.125 |
% |
$ |
25 |
3,870,330 |
$ |
97 |
$ |
97 |
||||
Series E(2)
|
April 28, 2008 |
April 30, 2018 |
8.400 |
% |
1,000 |
121,254 |
121 |
121 |
|||||||
Series A(3)
|
October 29, 2012 |
January 30, 2023 |
5.950 |
% |
1,000 |
1,500,000 |
1,500 |
1,500 |
|||||||
Series B(4)
|
December 13, 2012 |
February 15, 2023 |
5.900 |
% |
1,000 |
750,000 |
750 |
750 |
|||||||
Series C(5)
|
March 26, 2013 |
April 22, 2018 |
5.800 |
% |
25 |
23,000,000 |
575 |
575 |
|||||||
Series D(6)
|
April 30, 2013 |
May 15, 2023 |
5.350 |
% |
1,000 |
1,250,000 |
1,250 |
1,250 |
|||||||
Series J(7)
|
September 19, 2013 |
September 30, 2023 |
7.125 |
% |
25 |
38,000,000 |
950 |
950 |
|||||||
Series K(8)
|
October 31, 2013 |
November 15, 2023 |
6.875 |
% |
25 |
59,800,000 |
1,495 |
1,495 |
|||||||
Series L(9)
|
February 12, 2014 |
February 12, 2019 |
6.875 |
% |
25 |
19,200,000 |
480 |
— |
|||||||
Series M(10)
|
April 30, 2014 |
May 15, 2024 |
6.300 |
% |
1,000 |
1,750,000 |
1,750 |
— |
|||||||
$ |
8,968 |
$ |
6,738 |
||||||||||||
(1) |
Issued as depositary shares, each representing a 1/1,000th interest in a share of the corresponding series of non-cumulative perpetual preferred stock. Dividends payable quarterly on February 15, May 15, August 15 and November 15 when, as and if declared by the Citi Board of Directors.
|
(2) |
Issued as depositary shares, each representing a 1/25th interest in a share of the corresponding series of non-cumulative perpetual preferred stock. Dividends payable semi-annually on April 30 and October 30 at a fixed rate until April 30, 2018, thereafter payable quarterly on January 30, April 30, July 30 and October 30 at a floating rate, in each case when, as and if declared by the Citi Board of Directors.
|
(3) |
Issued as depositary shares, each representing a 1/25th interest in a share of the corresponding series of non-cumulative perpetual preferred stock. Dividends payable semi-annually on January 30 and July 30 at a fixed rate until January 30, 2023, thereafter payable quarterly on January 30, April 30, July 30 and October 30 at a floating rate, in each case when, as and if declared by the Citi Board of Directors.
|
(4) |
Issued as depositary shares, each representing a 1/25th interest in a share of the corresponding series of non-cumulative perpetual preferred stock. Dividends payable semi-annually on February 15 and August 15 at a fixed rate until February 15, 2023, thereafter payable quarterly on February 15, May 15, August 15 and November 15 at a floating rate, in each case when, as and if declared by the Citi Board of Directors.
|
(5) |
Issued as depositary shares, each representing a 1/1,000th interest in a share of the corresponding series of non-cumulative perpetual preferred stock. Dividends payable quarterly on January 22, April 22, July 22 and October 22 when, as and if declared by the Citi Board of Directors.
|
(6) |
Issued as depositary shares, each representing a 1/25th interest in a share of the corresponding series of non-cumulative perpetual preferred stock. Dividends payable semi-annually on May 15 and November 15 at a fixed rate until May 15, 2023, thereafter payable quarterly on February 15, May 15, August 15 and November 15 at a floating rate, in each case when, as and if declared by the Citi Board of Directors.
|
(7) |
Issued as depositary shares, each representing a 1/1,000th interest in a share of the corresponding series of non-cumulative perpetual preferred stock. Dividends payable quarterly on March 30, June 30, September 30 and December 30 at a fixed rate until September 30, 2023, thereafter payable quarterly on the same dates at a floating rate, in each case when, as and if declared by the Citi Board of Directors.
|
(8) |
Issued as depositary shares, each representing a 1/1,000th interest in a share of the corresponding series of non-cumulative perpetual preferred stock. Dividends payable quarterly on February 15, May 15, August 15 and November 15 at a fixed rate until November 15, 2023, thereafter payable quarterly on the same dates at a floating rate, in each case when, as and if declared by the Citi Board of Directors.
|
(9) |
Issued as depositary shares, each representing a 1/1,000th interest in a share of the corresponding series of non-cumulative perpetual preferred stock. Dividends payable quarterly on February 12, May 12, August 12 and November 12 at a fixed rate, in each case when, as and if declared by the Citi Board of Directors.
|
(10) |
Issued as depository shares, each representing a 1/25th interest in a share of the corresponding series of non-cumulative perpetual preferred stock. Dividends payable semi-annually on May 15 and November 15 at a fixed rate until May 15, 2024, thereafter payable quarterly on February 15, May 15, August 15, and November 15 at a floating rate, in each case when, as and if declared by the Citi Board of Directors.
|
• |
power to direct the activities of the VIE that most significantly impact the entity’s economic performance; and |
• |
an obligation to absorb losses of the entity that could potentially be significant to the VIE, or a right to receive benefits from the entity that could potentially be significant to the VIE. |
As of September 30, 2014 |
||||||||||||||||||||||||
Maximum exposure to loss in significant unconsolidated VIEs (1)
|
||||||||||||||||||||||||
Funded exposures (2)
|
Unfunded exposures |
|||||||||||||||||||||||
In millions of dollars |
Total
involvement
with SPE
assets
|
Consolidated
VIE / SPE assets
|
Significant
unconsolidated
VIE assets (3)
|
Debt
investments
|
Equity
investments
|
Funding
commitments
|
Guarantees
and
derivatives
|
Total |
||||||||||||||||
Citicorp |
||||||||||||||||||||||||
Credit card securitizations |
$ |
59,448 |
$ |
59,448 |
$ |
— |
$ |
— |
$ |
— |
$ |
— |
$ |
— |
$ |
— |
||||||||
Mortgage securitizations (4)
|
||||||||||||||||||||||||
U.S. agency-sponsored |
232,316 |
— |
232,316 |
3,196 |
— |
— |
23 |
3,219 |
||||||||||||||||
Non-agency-sponsored |
5,502 |
349 |
5,153 |
377 |
— |
— |
— |
377 |
||||||||||||||||
Citi-administered asset-backed commercial paper conduits (ABCP) |
30,213 |
30,213 |
— |
— |
— |
— |
— |
— |
||||||||||||||||
Collateralized debt obligations (CDOs) |
3,772 |
— |
3,772 |
62 |
— |
— |
— |
62 |
||||||||||||||||
Collateralized loan obligations (CLOs) |
17,675 |
— |
17,675 |
1,728 |
— |
— |
— |
1,728 |
||||||||||||||||
Asset-based financing |
56,320 |
1,560 |
54,760 |
20,582 |
94 |
2,115 |
347 |
23,138 |
||||||||||||||||
Municipal securities tender option bond trusts (TOBs) |
12,187 |
6,642 |
5,545 |
14 |
— |
3,626 |
— |
3,640 |
||||||||||||||||
Municipal investments |
16,511 |
137 |
16,374 |
1,962 |
2,041 |
1,074 |
— |
5,077 |
||||||||||||||||
Client intermediation |
1,749 |
256 |
1,493 |
12 |
— |
— |
10 |
22 |
||||||||||||||||
Investment funds (5)
|
33,259 |
1,877 |
31,382 |
13 |
385 |
74 |
— |
472 |
||||||||||||||||
Trust preferred securities |
2,646 |
— |
2,646 |
— |
6 |
— |
— |
6 |
||||||||||||||||
Other |
2,494 |
315 |
2,179 |
133 |
617 |
31 |
76 |
857 |
||||||||||||||||
Total |
$ |
474,092 |
$ |
100,797 |
$ |
373,295 |
$ |
28,079 |
$ |
3,143 |
$ |
6,920 |
$ |
456 |
$ |
38,598 |
||||||||
Citi Holdings |
||||||||||||||||||||||||
Credit card securitizations |
$ |
345 |
$ |
76 |
$ |
269 |
$ |
— |
$ |
— |
$ |
— |
$ |
— |
$ |
— |
||||||||
Mortgage securitizations |
||||||||||||||||||||||||
U.S. agency-sponsored |
36,286 |
— |
36,286 |
240 |
— |
— |
98 |
338 |
||||||||||||||||
Non-agency-sponsored |
10,695 |
366 |
10,329 |
20 |
— |
— |
1 |
21 |
||||||||||||||||
Student loan securitizations |
— |
— |
— |
— |
— |
— |
— |
— |
||||||||||||||||
Collateralized debt obligations (CDOs) |
2,786 |
— |
2,786 |
246 |
— |
— |
139 |
385 |
||||||||||||||||
Collateralized loan obligations (CLOs) |
1,078 |
— |
1,078 |
60 |
— |
— |
— |
60 |
||||||||||||||||
Asset-based financing |
1,930 |
3 |
1,927 |
216 |
3 |
90 |
— |
309 |
||||||||||||||||
Municipal investments |
6,957 |
— |
6,957 |
3 |
180 |
920 |
— |
1,103 |
||||||||||||||||
Investment funds |
591 |
— |
591 |
— |
— |
— |
— |
— |
||||||||||||||||
Other |
2,653 |
2,647 |
6 |
— |
— |
— |
— |
— |
||||||||||||||||
Total |
$ |
63,321 |
$ |
3,092 |
$ |
60,229 |
$ |
785 |
$ |
183 |
$ |
1,010 |
$ |
238 |
$ |
2,216 |
||||||||
Total Citigroup |
$ |
537,413 |
$ |
103,889 |
$ |
433,524 |
$ |
28,864 |
$ |
3,326 |
$ |
7,930 |
$ |
694 |
$ |
40,814 |
||||||||
(2) |
Included on Citigroup’s September 30, 2014 Consolidated Balance Sheet.
|
(3) |
A significant unconsolidated VIE is an entity where the Company has any variable interest or continuing involvement considered to be significant, regardless of the likelihood of loss or the notional amount of exposure. |
(4) |
Citicorp mortgage securitizations also include agency and non-agency (private-label) re-securitization activities. These SPEs are not consolidated. See “Re-securitizations” below for further discussion. |
As of December 31, 2013 |
||||||||||||||||||||||||
Maximum exposure to loss in significant unconsolidated VIEs (1)
|
||||||||||||||||||||||||
Funded exposures (2)
|
Unfunded exposures |
|||||||||||||||||||||||
In millions of dollars |
Total
involvement
with SPE
assets
|
Consolidated
VIE / SPE assets
|
Significant
unconsolidated
VIE assets (3)
|
Debt
investments
|
Equity
investments
|
Funding
commitments
|
Guarantees
and
derivatives
|
Total |
||||||||||||||||
Citicorp |
||||||||||||||||||||||||
Credit card securitizations |
$ |
52,229 |
$ |
52,229 |
$ |
— |
$ |
— |
$ |
— |
$ |
— |
$ |
— |
$ |
— |
||||||||
Mortgage securitizations (4)
|
||||||||||||||||||||||||
U.S. agency-sponsored |
239,204 |
— |
239,204 |
3,583 |
— |
— |
36 |
3,619 |
||||||||||||||||
Non-agency-sponsored |
7,711 |
598 |
7,113 |
583 |
— |
— |
— |
583 |
||||||||||||||||
Citi-administered asset-backed commercial paper conduits (ABCP) |
31,759 |
31,759 |
— |
— |
— |
— |
— |
— |
||||||||||||||||
Collateralized debt obligations (CDOs) |
4,204 |
— |
4,204 |
34 |
— |
— |
— |
34 |
||||||||||||||||
Collateralized loan obligations (CLOs) |
16,883 |
— |
16,883 |
1,938 |
— |
— |
— |
1,938 |
||||||||||||||||
Asset-based financing |
45,884 |
971 |
44,913 |
17,452 |
74 |
1,132 |
195 |
18,853 |
||||||||||||||||
Municipal securities tender option bond trusts (TOBs) |
12,716 |
7,039 |
5,677 |
29 |
— |
3,881 |
— |
3,910 |
||||||||||||||||
Municipal investments |
15,962 |
223 |
15,739 |
1,846 |
2,073 |
1,173 |
— |
5,092 |
||||||||||||||||
Client intermediation |
1,778 |
195 |
1,583 |
145 |
— |
— |
— |
145 |
||||||||||||||||
Investment funds (5)
|
32,324 |
3,094 |
29,230 |
191 |
264 |
81 |
— |
536 |
||||||||||||||||
Trust preferred securities |
4,822 |
— |
4,822 |
— |
51 |
— |
— |
51 |
||||||||||||||||
Other |
2,439 |
225 |
2,214 |
143 |
649 |
20 |
78 |
890 |
||||||||||||||||
Total |
$ |
467,915 |
$ |
96,333 |
$ |
371,582 |
$ |
25,944 |
$ |
3,111 |
$ |
6,287 |
$ |
309 |
$ |
35,651 |
||||||||
Citi Holdings |
||||||||||||||||||||||||
Credit card securitizations |
$ |
1,867 |
$ |
1,448 |
$ |
419 |
$ |
— |
$ |
— |
$ |
— |
$ |
— |
$ |
— |
||||||||
Mortgage securitizations |
||||||||||||||||||||||||
U.S. agency-sponsored |
73,549 |
— |
73,549 |
549 |
— |
— |
77 |
626 |
||||||||||||||||
Non-agency-sponsored |
13,193 |
1,695 |
11,498 |
35 |
— |
— |
2 |
37 |
||||||||||||||||
Student loan securitizations |
1,520 |
1,520 |
— |
— |
— |
— |
— |
— |
||||||||||||||||
Collateralized debt obligations (CDOs) |
3,879 |
— |
3,879 |
273 |
— |
— |
87 |
360 |
||||||||||||||||
Collateralized loan obligations (CLOs) |
2,733 |
— |
2,733 |
358 |
— |
— |
111 |
469 |
||||||||||||||||
Asset-based financing |
3,508 |
3 |
3,505 |
629 |
3 |
258 |
— |
890 |
||||||||||||||||
Municipal investments |
7,304 |
— |
7,304 |
3 |
204 |
939 |
— |
1,146 |
||||||||||||||||
Investment funds |
1,237 |
— |
1,237 |
— |
61 |
— |
— |
61 |
||||||||||||||||
Other |
4,494 |
4,434 |
60 |
— |
— |
— |
— |
— |
||||||||||||||||
Total |
$ |
113,284 |
$ |
9,100 |
$ |
104,184 |
$ |
1,847 |
$ |
268 |
$ |
1,197 |
$ |
277 |
$ |
3,589 |
||||||||
Total Citigroup |
$ |
581,199 |
$ |
105,433 |
$ |
475,766 |
$ |
27,791 |
$ |
3,379 |
$ |
7,484 |
$ |
586 |
$ |
39,240 |
||||||||
(1) |
The definition of maximum exposure to loss is included in the text that follows this table. |
(2) |
Included on Citigroup’s December 31, 2013 Consolidated Balance Sheet.
|
(3) |
A significant unconsolidated VIE is an entity where the Company has any variable interest or continuing involvement considered to be significant, regardless of the likelihood of loss or the notional amount of exposure. |
(4) |
Citicorp mortgage securitizations also include agency and non-agency (private-label) re-securitization activities. These SPEs are not consolidated. See “Re-securitizations” below for further discussion. |
• |
certain venture capital investments made by some of the Company’s private equity subsidiaries, as the Company accounts for these investments in accordance with the Investment Company Audit Guide (codified in ASC 946); |
• |
certain limited partnerships that are investment funds that qualify for the deferral from the requirements of ASC 810 where the Company is the general partner and the limited partners have the right to replace the general partner or liquidate the funds; |
• |
certain investment funds for which the Company provides investment management services and personal estate trusts for which the Company provides administrative, trustee and/or investment management services; |
• |
VIEs structured by third parties where the Company holds securities in inventory, as these investments are made on arm’s-length terms; |
• |
certain positions in mortgage-backed and asset-backed securities held by the Company, which are classified as Trading account assets or Investments, where the Company has no other involvement with the related securitization entity deemed to be significant (for more information on these positions, see Notes 12 and 13 to the Consolidated Financial Statements);
|
• |
certain representations and warranties exposures in legacy Securities and Banking-sponsored mortgage-backed and asset-backed securitizations, where the Company has no variable interest or continuing involvement as servicer. The outstanding balance of mortgage loans securitized during 2005 to 2008 where the Company has no variable interest or continuing involvement as servicer was approximately $14 billion and $16 billion at September 30, 2014 and December 31, 2013, respectively; and
|
• |
certain representations and warranties exposures in Citigroup residential mortgage securitizations, where the original mortgage loan balances are no longer outstanding. |
September 30, 2014 |
December 31, 2013 |
|||||||||||
Liquidity |
Loan |
Liquidity |
Loan |
|||||||||
In millions of dollars |
facilities |
commitments |
facilities |
commitments |
||||||||
Citicorp |
||||||||||||
Asset-based financing |
$ |
5 |
$ |
2,110 |
$ |
5 |
$ |
1,127 |
||||
Municipal securities tender option bond trusts (TOBs) |
3,626 |
— |
3,881 |
— |
||||||||
Municipal investments |
— |
1,074 |
— |
1,173 |
||||||||
Investment funds |
— |
74 |
— |
81 |
||||||||
Other |
— |
31 |
— |
20 |
||||||||
Total Citicorp |
$ |
3,631 |
$ |
3,289 |
$ |
3,886 |
$ |
2,401 |
||||
Citi Holdings |
||||||||||||
Asset-based financing |
$ |
— |
$ |
90 |
$ |
— |
$ |
258 |
||||
Municipal investments |
— |
920 |
— |
939 |
||||||||
Total Citi Holdings |
$ |
— |
$ |
1,010 |
$ |
— |
$ |
1,197 |
||||
Total Citigroup funding commitments |
$ |
3,631 |
$ |
4,299 |
$ |
3,886 |
$ |
3,598 |
||||
September 30, 2014 |
December 31, 2013 |
|||||||||||||||||
In billions of dollars |
Citicorp |
Citi Holdings |
Citigroup |
Citicorp |
Citi Holdings |
Citigroup |
||||||||||||
Cash |
$ |
0.1 |
$ |
0.1 |
$ |
0.2 |
$ |
0.2 |
$ |
0.2 |
$ |
0.4 |
||||||
Trading account assets |
0.8 |
— |
0.8 |
1.0 |
— |
1.0 |
||||||||||||
Investments |
9.9 |
— |
9.9 |
10.9 |
— |
10.9 |
||||||||||||
Total loans, net |
89.3 |
2.6 |
91.9 |
83.2 |
8.7 |
91.9 |
||||||||||||
Other |
0.7 |
0.3 |
1.0 |
1.1 |
0.2 |
1.3 |
||||||||||||
Total assets |
$ |
100.8 |
$ |
3.0 |
$ |
103.8 |
$ |
96.4 |
$ |
9.1 |
$ |
105.5 |
||||||
Short-term borrowings |
$ |
24.2 |
$ |
— |
$ |
24.2 |
$ |
24.3 |
$ |
— |
$ |
24.3 |
||||||
Long-term debt |
38.2 |
2.0 |
40.2 |
32.8 |
2.0 |
34.8 |
||||||||||||
Other liabilities |
0.8 |
0.1 |
0.9 |
0.9 |
0.1 |
1.0 |
||||||||||||
Total liabilities |
$ |
63.2 |
$ |
2.1 |
$ |
65.3 |
$ |
58.0 |
$ |
2.1 |
$ |
60.1 |
||||||
September 30, 2014 |
December 31, 2013 |
|||||||||||||||||
In billions of dollars |
Citicorp |
Citi Holdings |
Citigroup |
Citicorp |
Citi Holdings |
Citigroup |
||||||||||||
Trading account assets |
$ |
4.3 |
$ |
0.3 |
$ |
4.6 |
$ |
4.8 |
$ |
0.6 |
$ |
5.4 |
||||||
Investments |
2.5 |
0.2 |
2.7 |
3.7 |
0.4 |
4.1 |
||||||||||||
Total loans, net |
22.5 |
0.2 |
22.7 |
18.3 |
0.6 |
18.9 |
||||||||||||
Other |
1.9 |
0.2 |
2.1 |
2.2 |
0.5 |
2.7 |
||||||||||||
Total assets |
$ |
31.2 |
$ |
0.9 |
$ |
32.1 |
$ |
29.0 |
$ |
2.1 |
$ |
31.1 |
||||||
Citicorp |
Citi Holdings |
|||||||||||
In billions of dollars |
September 30, 2014 |
December 31, 2013 |
September 30, 2014 |
December 31, 2013 |
||||||||
Ownership interests in principal amount of trust credit card receivables |
||||||||||||
Sold to investors via trust-issued securities |
$ |
37.9 |
$ |
32.3 |
$ |
— |
$ |
— |
||||
Retained by Citigroup as trust-issued securities |
10.0 |
8.1 |
— |
1.3 |
||||||||
Retained by Citigroup via non-certificated interests |
11.6 |
12.1 |
— |
— |
||||||||
Total ownership interests in principal amount of trust credit card receivables |
$ |
59.5 |
$ |
52.5 |
$ |
— |
$ |
1.3 |
||||
Three months ended September 30, |
||||||
In billions of dollars |
2014 |
2013 |
||||
Proceeds from new securitizations |
$ |
3.1 |
$ |
4.9 |
||
Pay down of maturing notes |
(2.8 |
) |
— |
|||
Nine months ended September 30, |
||||||
In billions of dollars |
2014 |
2013 |
||||
Proceeds from new securitizations |
$ |
9.8 |
$ |
7.4 |
||
Pay down of maturing notes |
(4.1 |
) |
(1.6 |
) |
||
Three months ended September 30, |
||||||
In billions of dollars |
2014 |
2013 |
||||
Proceeds from new securitizations |
$ |
— |
$ |
0.2 |
||
Pay down of maturing notes |
— |
— |
||||
Nine months ended September 30, |
||||||
In billions of dollars |
2014 |
2013 |
||||
Proceeds from new securitizations |
$ |
0.1 |
$ |
0.2 |
||
Pay down of maturing notes |
— |
(0.1 |
) |
|||
In billions of dollars |
September 30, 2014 |
Dec. 31, 2013 |
||||
Term notes issued to third parties |
$ |
36.4 |
$ |
27.9 |
||
Term notes retained by Citigroup affiliates |
8.1 |
6.2 |
||||
Total Master Trust liabilities |
$ |
44.5 |
$ |
34.1 |
||
In billions of dollars |
September 30, 2014 |
Dec. 31, 2013 |
||||
Term notes issued to third parties |
$ |
1.5 |
$ |
4.4 |
||
Term notes retained by Citigroup affiliates |
1.9 |
1.9 |
||||
Total Omni Trust liabilities |
$ |
3.4 |
$ |
6.3 |
||
Three months ended September 30, |
||||||||||||
2014 |
2013 |
|||||||||||
In billions of dollars |
U.S. agency- sponsored mortgages |
Non-agency- sponsored mortgages |
U.S. agency- sponsored mortgages |
Non-agency- sponsored mortgages |
||||||||
Proceeds from new securitizations |
$ |
6.2 |
$ |
1.7 |
$ |
15.4 |
$ |
2.0 |
||||
Contractual servicing fees received |
0.1 |
— |
0.1 |
— |
||||||||
Nine months ended September 30, |
||||||||||||
2014 |
2013 |
|||||||||||
In billions of dollars |
U.S. agency- sponsored mortgages |
Non-agency- sponsored mortgages |
U.S. agency- sponsored mortgages |
Non-agency- sponsored mortgages |
||||||||
Proceeds from new securitizations |
$ |
19.4 |
$ |
6.9 |
$ |
54.2 |
$ |
5.0 |
||||
Contractual servicing fees received |
0.3 |
— |
0.3 |
— |
||||||||
Three months ended September 30, 2014 |
|||||
Non-agency-sponsored mortgages (1)
|
|||||
U.S. agency- sponsored mortgages |
Senior interests |
Subordinated interests |
|||
Discount rate |
0.0% to 14.7% |
— |
6.7% to 9.0% |
||
Weighted average discount rate |
12.3 |
% |
— |
8.7 |
% |
Constant prepayment rate |
4.6% to 18.1% |
— |
0.5% to 8.9% |
||
Weighted average constant prepayment rate |
5.8 |
% |
— |
1.7 |
% |
Anticipated net credit losses (2)
|
NM |
— |
8.9% to 40.0% |
||
Weighted average anticipated net credit losses |
NM |
— |
35.6 |
% |
|
Weighted average life |
5.2 to 8.9 years |
— |
6.7 to 7.3 years |
||
Three months ended September 30, 2013 |
||||||
Non-agency-sponsored mortgages (1)
|
||||||
U.S. agency- sponsored mortgages |
Senior interests |
Subordinated interests |
||||
Discount rate |
0.8% to 12.2% |
3.9 |
% |
0.1% to 9.8% |
||
Weighted average discount rate |
10.0 |
% |
3.9 |
% |
6.1 |
% |
Constant prepayment rate |
2.4% to 19.0% |
5.4 |
% |
0.1% to 11.2% |
||
Weighted average constant prepayment rate |
4.5 |
% |
5.4 |
% |
6.8 |
% |
Anticipated net credit losses (2)
|
NM |
47.8 |
% |
0.1% to 49.0% |
||
Weighted average anticipated net credit losses |
NM |
47.8 |
% |
29.6 |
% |
|
Weighted average life |
5.3 to 8.4 years |
7.0 years |
10.0 to 10.2 years |
|||
Nine months ended September 30, 2014 |
||||||
Non-agency-sponsored mortgages (1)
|
||||||
U.S. agency- sponsored mortgages |
Senior interests |
Subordinated interests |
||||
Discount rate |
0.0% to 14.7% |
1.4% to 4.6% |
2.6% to 9.1% |
|||
Weighted average discount rate |
11.1 |
% |
3.8 |
% |
7.8 |
% |
Constant prepayment rate |
0.0% to 18.1% |
0.0 |
% |
0.5% to 8.9% |
||
Weighted average constant prepayment rate |
5.4 |
% |
0.0 |
% |
3.2 |
% |
Anticipated net credit losses (2)
|
NM |
40.0 |
% |
8.9% to 58.5% |
||
Weighted average anticipated net credit losses |
NM |
40.0 |
% |
43.1 |
% |
|
Weighted average life |
0.0 to 9.7 years |
2.6 to 8.6 years |
3.0 to 14.5 years |
|||
Nine months ended September 30, 2013 |
||||||
Non-agency-sponsored mortgages (1)
|
||||||
U.S. agency- sponsored mortgages |
Senior interests |
Subordinated interests |
||||
Discount rate |
0.8% to 12.4% |
2.3% to 4.3% |
0.1% to 19.2% |
|||
Weighted average discount rate |
10.0 |
% |
3.4 |
% |
7.6 |
% |
Constant prepayment rate |
2.4% to 21.4% |
5.4% to 10.0% |
0.1% to 11.2% |
|||
Weighted average constant prepayment rate |
5.3 |
% |
7.2 |
% |
6.9 |
% |
Anticipated net credit losses (2)
|
NM |
47.2% to 53.0% |
0.1% to 89.0% |
|||
Weighted average anticipated net credit losses |
NM |
49.3 |
% |
49.3 |
% |
|
Weighted average life |
0.1 to 11.8 years |
2.9 to 9.7 years |
2.5 to 16.5 years |
|||
(1) |
Disclosure of non-agency-sponsored mortgages as senior and subordinated interests is indicative of the interests’ position in the capital structure of the securitization. |
(2) |
Anticipated net credit losses represent estimated loss severity associated with defaulted mortgage loans underlying the mortgage securitizations disclosed above. Anticipated net credit losses, in this instance, do not represent total credit losses incurred to date, nor do they represent credit losses expected on retained interests in mortgage securitizations. |
September 30, 2014 |
||||||
Non-agency-sponsored mortgages (1)
|
||||||
U.S. agency- sponsored mortgages |
Senior interests |
Subordinated interests |
||||
Discount rate |
0.0% to 22.0% |
1.0% to 17.3% |
1.6% to 18.2% |
|||
Weighted average discount rate |
8.6 |
% |
6.0 |
% |
8.7 |
% |
Constant prepayment rate |
5.4% to 36.4% |
3.1% to 100.0% |
0.5% to 16.0% |
|||
Weighted average constant prepayment rate |
12.1 |
% |
19.8 |
% |
6.4 |
% |
Anticipated net credit losses (2)
|
NM |
0.0% to 40.0% |
1.6% to 40.0% |
|||
Weighted average anticipated net credit losses |
NM |
27.5 |
% |
15.2 |
% |
|
Weighted average life |
0.1 to 19.0 years |
0.7 to 11.9 years |
0.9 to 25.3 years |
|||
December 31, 2013 |
||||||
Non-agency-sponsored mortgages (1)
|
||||||
U.S. agency- sponsored mortgages |
Senior interests |
Subordinated interests |
||||
Discount rate |
0.1% to 20.9% |
0.5% to 17.4% |
2.1% to 19.6% |
|||
Weighted average discount rate |
6.9 |
% |
5.5 |
% |
11.2 |
% |
Constant prepayment rate |
6.2% to 30.4% |
1.3% to 100.0% |
1.4% to 23.1% |
|||
Weighted average constant prepayment rate |
11.1 |
% |
6.4 |
% |
7.4 |
% |
Anticipated net credit losses (2)
|
NM |
0.1% to 80.0% |
25.5% to 81.9% |
|||
Weighted average anticipated net credit losses |
NM |
49.5 |
% |
52.8 |
% |
|
Weighted average life |
2.1 to 14.1 years |
0.0 to 11.9 years |
0.0 to 26.0 years |
|||
(1) |
Disclosure of non-agency-sponsored mortgages as senior and subordinated interests is indicative of the interests’ position in the capital structure of the securitization. |
(2) |
Anticipated net credit losses represent estimated loss severity associated with defaulted mortgage loans underlying the mortgage securitizations disclosed above. Anticipated net credit losses, in this instance, do not represent total credit losses incurred to date, nor do they represent credit losses expected on retained interests in mortgage securitizations. |
Non-agency-sponsored mortgages (1)
|
|||||||||
In millions of dollars at September 30, 2014 |
U.S. agency- sponsored mortgages |
Senior interests |
Subordinated interests |
||||||
Carrying value of retained interests |
$ |
2,470 |
$ |
158 |
$ |
502 |
|||
Discount rates |
|||||||||
Adverse change of 10% |
$ |
(78 |
) |
$ |
(3 |
) |
$ |
(30 |
) |
Adverse change of 20% |
(152 |
) |
(5 |
) |
(58 |
) |
|||
Constant prepayment rate |
|||||||||
Adverse change of 10% |
(81 |
) |
(1 |
) |
(8 |
) |
|||
Adverse change of 20% |
(157 |
) |
(2 |
) |
(17 |
) |
|||
Anticipated net credit losses |
|||||||||
Adverse change of 10% |
NM |
(2 |
) |
(10 |
) |
||||
Adverse change of 20% |
NM |
(2 |
) |
(17 |
) |
||||
Non-agency-sponsored mortgages (1)
|
|||||||||
In millions of dollars at December 31, 2013 |
U.S. agency- sponsored mortgages |
Senior interests |
Subordinated interests |
||||||
Carrying value of retained interests |
$ |
2,519 |
$ |
293 |
$ |
429 |
|||
Discount rates |
|||||||||
Adverse change of 10% |
$ |
(76 |
) |
$ |
(6 |
) |
$ |
(25 |
) |
Adverse change of 20% |
(148 |
) |
(11 |
) |
(48 |
) |
|||
Constant prepayment rate |
|||||||||
Adverse change of 10% |
(96 |
) |
(1 |
) |
(7 |
) |
|||
Adverse change of 20% |
(187 |
) |
(2 |
) |
(14 |
) |
|||
Anticipated net credit losses |
|||||||||
Adverse change of 10% |
NM |
(2 |
) |
(7 |
) |
||||
Adverse change of 20% |
NM |
(3 |
) |
(14 |
) |
||||
(1) |
Disclosure of non-agency-sponsored mortgages as senior and subordinated interests is indicative of the interests’ position in the capital structure of the securitization. |
Three months ended September 30, |
||||||||||||
2014 |
2013 |
|||||||||||
In billions of dollars |
U.S. agency- sponsored mortgages |
Non-agency- sponsored mortgages |
U.S. agency- sponsored mortgages |
Non-agency- sponsored mortgages |
||||||||
Proceeds from new securitizations |
$ |
0.1 |
$ |
— |
$ |
0.1 |
$ |
— |
||||
Contractual servicing fees received |
— |
— |
0.1 |
— |
||||||||
Nine months ended September 30, |
||||||||||||
2014 |
2013 |
|||||||||||
In billions of dollars |
U.S. agency- sponsored mortgages |
Non-agency- sponsored mortgages |
U.S. agency- sponsored mortgages |
Non-agency- sponsored mortgages |
||||||||
Proceeds from new securitizations |
$ |
0.2 |
$ |
— |
$ |
0.1 |
$ |
— |
||||
Contractual servicing fees received |
0.1 |
— |
0.2 |
— |
||||||||
September 30, 2014 |
||||||
Non-agency-sponsored mortgages (1)
|
||||||
U.S. agency- sponsored mortgages |
Senior interests |
Subordinated interests (2) |
||||
Discount rate |
4.4% to 32.4% |
35.8 |
% |
— |
||
Weighted average discount rate |
19.1 |
% |
35.8 |
% |
— |
|
Constant prepayment rate |
18.1% to 28.0% |
11.7 |
% |
— |
||
Weighted average constant prepayment rate |
27.7 |
% |
11.7 |
% |
— |
|
Anticipated net credit losses |
NM |
0.2 |
% |
— |
||
Weighted average anticipated net credit losses |
NM |
0.2 |
% |
— |
||
Weighted average life |
4.1 to 7.2 years |
3.3 years |
— |
|||
December 31, 2013 |
||||||
Non-agency-sponsored mortgages (1)
|
||||||
U.S. agency- sponsored mortgages |
Senior interests |
Subordinated interests (2) |
||||
Discount rate |
0.0% to 49.3% |
9.9 |
% |
— |
||
Weighted average discount rate |
9.5 |
% |
9.9 |
% |
— |
|
Constant prepayment rate |
9.6% to 26.2% |
12.3% to 27.3% |
— |
|||
Weighted average constant prepayment rate |
20.0 |
% |
15.6 |
% |
— |
|
Anticipated net credit losses |
NM |
0.3 |
% |
— |
||
Weighted average anticipated net credit losses |
NM |
0.3 |
% |
— |
||
Weighted average life |
2.3 to 7.6 years |
5.2 years |
— |
|||
(1) |
Disclosure of non-agency-sponsored mortgages as senior and subordinated interests is indicative of the interests’ position in the capital structure of the securitization. |
(2) |
Citi Holdings held no subordinated interests in mortgage securitizations as of September 30, 2014 and December 31, 2013.
|
Non-agency-sponsored mortgages (1)
|
|||||||||
In millions of dollars at September 30, 2014 |
U.S. agency- sponsored mortgages |
Senior interests |
Subordinated interests |
||||||
Carrying value of retained interests |
$ |
238 |
$ |
24 |
$ |
— |
|||
Discount rates |
|||||||||
Adverse change of 10% |
$ |
(7 |
) |
$ |
(3 |
) |
$ |
— |
|
Adverse change of 20% |
(14 |
) |
(5 |
) |
— |
||||
Constant prepayment rate |
|||||||||
Adverse change of 10% |
(6 |
) |
(2 |
) |
— |
||||
Adverse change of 20% |
(12 |
) |
(4 |
) |
— |
||||
Anticipated net credit losses |
|||||||||
Adverse change of 10% |
NM |
(4 |
) |
— |
|||||
Adverse change of 20% |
NM |
(8 |
) |
— |
|||||
Non-agency-sponsored mortgages (1)
|
|||||||||
In millions of dollars at December 31, 2013 |
U.S. agency- sponsored mortgages |
Senior interests |
Subordinated interests |
||||||
Carrying value of retained interests |
$ |
585 |
$ |
50 |
$ |
— |
|||
Discount rates |
|||||||||
Adverse change of 10% |
$ |
(16 |
) |
$ |
(3 |
) |
$ |
— |
|
Adverse change of 20% |
(32 |
) |
(5 |
) |
— |
||||
Constant prepayment rate |
— |
||||||||
Adverse change of 10% |
(33 |
) |
(3 |
) |
— |
||||
Adverse change of 20% |
(65 |
) |
(6 |
) |
— |
||||
Anticipated net credit losses |
|||||||||
Adverse change of 10% |
NM |
(5 |
) |
— |
|||||
Adverse change of 20% |
NM |
(11 |
) |
— |
|||||
(1) |
Disclosure of non-agency-sponsored mortgages as senior and subordinated interests is indicative of the interests’ position in the capital structure of the securitization. |
Three months ended September 30, |
||||||
In millions of dollars |
2014 |
2013 |
||||
Balance, as of June 30 |
$ |
2,282 |
$ |
2,524 |
||
Originations |
52 |
167 |
||||
Changes in fair value of MSRs due to changes in inputs and assumptions |
(11 |
) |
11 |
|||
Other changes (1)
|
(108 |
) |
(121 |
) |
||
Sale of MSRs |
(122 |
) |
(1 |
) |
||
Balance, as of September 30 |
$ |
2,093 |
$ |
2,580 |
||
Nine months ended September 30, |
||||||
In millions of dollars |
2014 |
2013 |
||||
Balance, beginning of year |
$ |
2,718 |
$ |
1,942 |
||
Originations |
151 |
543 |
||||
Changes in fair value of MSRs due to changes in inputs and assumptions |
(186 |
) |
481 |
|||
Other changes (1)
|
(333 |
) |
(384 |
) |
||
Sale of MSRs |
(257 |
) |
(2 |
) |
||
Balance, as of September 30 |
$ |
2,093 |
$ |
2,580 |
||
(1) |
Represents changes due to customer payments and passage of time. |
Three months ended September 30, |
Nine months ended September 30, |
|||||||||||
In millions of dollars |
2014 |
2013 |
2014 |
2013 |
||||||||
Servicing fees |
$ |
159 |
$ |
196 |
$ |
491 |
$ |
611 |
||||
Late fees |
5 |
12 |
20 |
31 |
||||||||
Ancillary fees |
11 |
27 |
47 |
79 |
||||||||
Total MSR fees |
$ |
175 |
$ |
235 |
$ |
558 |
$ |
721 |
||||
September 30, 2014 |
December 31, 2013 |
|
Discount rate |
1.5% to 1.6% |
1.5% to 1.6% |
September 30, 2014 |
|||
In millions of dollars |
CLO |
||
Carrying value of retained interests |
$ |
1,542 |
|
Value of underlying portfolio |
|||
Adverse change of 10% |
$ |
(10 |
) |
Adverse change of 20% |
(20 |
) |
|
December 31, 2013 |
|||
In millions of dollars |
CLO |
||
Carrying value of retained interests |
$ |
1,333 |
|
Value of underlying portfolio |
|||
Adverse change of 10% |
$ |
(7 |
) |
Adverse change of 20% |
(14 |
) |
|
September 30, 2014 |
||
CDOs |
CLOs |
|
Discount rate |
44.4% to 48.9% |
4.5% to 5.0% |
December 31, 2013 |
||
CDOs |
CLOs |
|
Discount rate |
44.3% to 48.7% |
4.5% to 5.0% |
September 30, 2014 |
||||||
In millions of dollars |
CDOs |
CLOs |
||||
Carrying value of retained interests |
$ |
6 |
$ |
8 |
||
Discount rates |
||||||
Adverse change of 10% |
$ |
(1 |
) |
$ |
— |
|
Adverse change of 20% |
(2 |
) |
— |
|||
December 31, 2013 |
||||||
In millions of dollars |
CDOs |
CLOs |
||||
Carrying value of retained interests |
$ |
19 |
$ |
31 |
||
Discount rates |
||||||
Adverse change of 10% |
$ |
(1 |
) |
$ |
— |
|
Adverse change of 20% |
(2 |
) |
— |
|||
September 30, 2014 |
||||||
In millions of dollars |
Total unconsolidated VIE assets |
Maximum exposure to unconsolidated VIEs |
||||
Type |
||||||
Commercial and other real estate |
$ |
21,090 |
$ |
6,922 |
||
Corporate loans |
460 |
475 |
||||
Airplanes, ships and other assets |
33,210 |
15,741 |
||||
Total |
$ |
54,760 |
$ |
23,138 |
||
December 31, 2013 |
||||||
In millions of dollars |
Total unconsolidated VIE assets |
Maximum exposure to unconsolidated VIEs |
||||
Type |
||||||
Commercial and other real estate |
$ |
14,042 |
$ |
3,902 |
||
Corporate loans |
2,221 |
1,754 |
||||
Airplanes, ships and other assets |
28,650 |
13,197 |
||||
Total |
$ |
44,913 |
$ |
18,853 |
||
Three months ended September 30, |
||||||
In billions of dollars |
2014 |
2013 |
||||
Proceeds from new securitizations |
$ |
— |
$ |
— |
||
Cash flows received on retained interest and other net cash flows |
$ |
— |
$ |
— |
||
Nine months ended September 30, |
||||||
In billions of dollars |
2014 |
2013 |
||||
Proceeds from new securitizations |
$ |
0.5 |
$ |
— |
||
Cash flows received on retained interest and other net cash flows |
$ |
0.2 |
$ |
0.6 |
||
Sept. 30, 2014 |
Dec. 31, 2013 |
|
Discount rate |
N/A |
3.0% |
September 30, 2014 |
|||
In millions of dollars |
Asset-based financing |
||
Carrying value of retained interests |
$ |
— |
|
Value of underlying portfolio |
|||
Adverse change of 10% |
$ |
— |
|
Adverse change of 20% |
— |
||
December 31, 2013 |
|||
In millions of dollars |
Asset-based financing |
||
Carrying value of retained interests |
$ |
1,316 |
|
Value of underlying portfolio |
|||
Adverse change of 10% |
$ |
(11 |
) |
Adverse change of 20% |
(23 |
) |
|
September 30, 2014 |
||||||
In millions of dollars |
Total unconsolidated VIE assets |
Maximum exposure to unconsolidated VIEs |
||||
Type |
||||||
Commercial and other real estate |
$ |
715 |
$ |
228 |
||
Corporate loans |
— |
— |
||||
Airplanes, ships and other assets |
1,212 |
81 |
||||
Total |
$ |
1,927 |
$ |
309 |
||
December 31, 2013 |
||||||
In millions of dollars |
Total unconsolidated VIE assets |
Maximum exposure to unconsolidated VIEs |
||||
Type |
||||||
Commercial and other real estate |
$ |
774 |
$ |
298 |
||
Corporate loans |
112 |
96 |
||||
Airplanes, ships and other assets |
2,619 |
496 |
||||
Total |
$ |
3,505 |
$ |
890 |
||
Three months ended September 30, |
||||||
In billions of dollars |
2014 |
2013 |
||||
Cash flows received on retained interest and other net cash flows |
$ |
— |
$ |
— |
||
Nine months ended September 30, |
||||||
In billions of dollars |
2014 |
2013 |
||||
Cash flows received on retained interest and other net cash flows |
$ |
0.1 |
$ |
0.2 |
||
September 30, 2014 |
|||
In millions of dollars |
Asset-based financing |
||
Carrying value of retained interests |
$ |
— |
|
Value of underlying portfolio |
|||
Adverse change of 10% |
$ |
— |
|
Adverse change of 20% |
— |
||
December 31, 2013 |
|||
In millions of dollars |
Asset-based financing |
||
Carrying value of retained interests |
$ |
95 |
|
Value of underlying portfolio |
|||
Adverse change of 10% |
$ |
— |
|
Adverse change of 20% |
— |
||
• |
Futures and forward contracts, which are commitments to buy or sell at a future date a financial instrument, commodity or currency at a contracted price and may be settled in cash or through delivery.
|
• |
Swap contracts, which are commitments to settle in cash at a future date or dates that may range from a few days to a number of years, based on differentials between specified financial indices, as applied to a notional principal amount.
|
• |
Option contracts, which give the purchaser, for a premium, the right, but not the obligation, to buy or sell within a specified time a financial instrument, commodity or currency at a contracted price that may also be settled in cash, based on differentials between specified indices or prices.
|
• |
Trading Purposes—Customer Needs: Citigroup offers its customers derivatives in connection with their risk-management actions to transfer, modify or reduce their interest rate, foreign exchange and other market/credit risks or for their own trading purposes. As part of this process, Citigroup considers the customers’ suitability for the risk involved and the business purpose for the transaction. Citigroup also manages its derivative risk positions through offsetting trade activities, controls focused on price verification, and daily reporting of positions to senior managers.
|
• |
Trading Purposes—Citigroup trades derivatives as an active market maker. Trading limits and price verification controls are key aspects of this activity.
|
• |
Hedging—Citigroup uses derivatives in connection with its risk-management activities to hedge certain risks or reposition the risk profile of the Company. For example, Citigroup issues fixed-rate long-term debt and then enters into a receive-fixed, pay-variable-rate interest rate swap with the same tenor and notional amount to convert the interest payments to a net variable-rate basis. This strategy is the most common form of an interest rate hedge, as it minimizes interest cost in certain yield curve environments. Derivatives are also used to manage risks inherent in specific groups of on-balance-sheet assets and liabilities, including AFS securities and borrowings, as well as other interest-sensitive assets and liabilities. In
|
|
Hedging instruments under
ASC 815(1)(2)
|
Other derivative instruments |
|||||||||||||||||
Trading derivatives |
Management hedges(3)
|
|||||||||||||||||
In millions of dollars |
September 30, 2014 |
December 31, 2013 |
September 30, 2014 |
December 31, 2013 |
September 30, 2014 |
December 31, 2013 |
||||||||||||
Interest rate contracts |
||||||||||||||||||
Swaps |
$ |
172,774 |
$ |
132,823 |
$ |
34,796,574 |
$ |
36,370,196 |
$ |
68,093 |
$ |
93,286 |
||||||
Futures and forwards |
— |
20 |
6,579,341 |
6,129,742 |
38,233 |
61,398 |
||||||||||||
Written options |
— |
— |
3,349,604 |
3,342,832 |
4,132 |
3,103 |
||||||||||||
Purchased options |
— |
— |
3,278,606 |
3,240,990 |
4,560 |
3,185 |
||||||||||||
Total interest rate contract notionals |
$ |
172,774 |
$ |
132,843 |
$ |
48,004,125 |
$ |
49,083,760 |
$ |
115,018 |
$ |
160,972 |
||||||
Foreign exchange contracts |
||||||||||||||||||
Swaps |
$ |
25,923 |
$ |
22,402 |
$ |
4,405,719 |
$ |
3,298,500 |
$ |
24,214 |
$ |
20,013 |
||||||
Futures and forwards |
75,176 |
79,646 |
2,240,032 |
1,982,303 |
10,819 |
14,226 |
||||||||||||
Written options |
238 |
101 |
1,573,970 |
1,037,433 |
— |
— |
||||||||||||
Purchased options |
238 |
106 |
1,593,341 |
1,029,872 |
— |
71 |
||||||||||||
Total foreign exchange contract notionals |
$ |
101,575 |
$ |
102,255 |
$ |
9,813,062 |
$ |
7,348,108 |
$ |
35,033 |
$ |
34,310 |
||||||
Equity contracts |
||||||||||||||||||
Swaps |
$ |
— |
$ |
— |
$ |
122,190 |
$ |
100,019 |
$ |
— |
$ |
— |
||||||
Futures and forwards |
— |
— |
26,459 |
23,161 |
— |
— |
||||||||||||
Written options |
— |
— |
374,468 |
333,945 |
— |
— |
||||||||||||
Purchased options |
— |
— |
332,799 |
266,570 |
— |
— |
||||||||||||
Total equity contract notionals |
$ |
— |
$ |
— |
$ |
855,916 |
$ |
723,695 |
$ |
— |
$ |
— |
||||||
Commodity and other contracts |
||||||||||||||||||
Swaps |
$ |
— |
$ |
— |
$ |
161,538 |
$ |
81,112 |
$ |
— |
$ |
— |
||||||
Futures and forwards |
1,201 |
— |
105,036 |
98,265 |
— |
— |
||||||||||||
Written options |
— |
— |
117,188 |
100,482 |
— |
— |
||||||||||||
Purchased options |
— |
— |
111,742 |
97,626 |
— |
— |
||||||||||||
Total commodity and other contract notionals |
$ |
1,201 |
$ |
— |
$ |
495,504 |
$ |
377,485 |
$ |
— |
$ |
— |
||||||
Credit derivatives(4)
|
||||||||||||||||||
Protection sold |
$ |
— |
$ |
— |
$ |
1,161,986 |
$ |
1,143,363 |
$ |
— |
$ |
— |
||||||
Protection purchased |
— |
95 |
1,201,251 |
1,195,223 |
15,428 |
19,744 |
||||||||||||
Total credit derivatives |
$ |
— |
$ |
95 |
$ |
2,363,237 |
$ |
2,338,586 |
$ |
15,428 |
$ |
19,744 |
||||||
Total derivative notionals |
$ |
275,550 |
$ |
235,193 |
$ |
61,531,844 |
$ |
59,871,634 |
$ |
165,479 |
$ |
215,026 |
||||||
(1) |
The notional amounts presented in this table do not include hedge accounting relationships under ASC 815 where Citigroup is hedging the foreign currency risk of a net investment in a foreign operation by issuing a foreign-currency-denominated debt instrument. The notional amount of such debt was $4,198 million and $6,450 million at September 30, 2014 and December 31, 2013, respectively.
|
(2) |
Derivatives in hedge accounting relationships accounted for under ASC 815 are recorded in either Other assets/Other liabilities or Trading account assets/Trading account liabilities on the Consolidated Balance Sheet.
|
(3) |
Management hedges represent derivative instruments used in certain economic hedging relationships that are identified for management purposes, but for which hedge accounting is not applied. These derivatives are recorded in either Other assets/Other liabilities or Trading account assets/Trading account liabilities on the Consolidated Balance Sheet.
|
(4) |
Credit derivatives are arrangements designed to allow one party (protection buyer) to transfer the credit risk of a “reference asset” to another party (protection seller). These arrangements allow a protection seller to assume the credit risk associated with the reference asset without directly purchasing that asset. The Company has entered into credit derivative positions for purposes such as risk management, yield enhancement, reduction of credit concentrations and diversification of overall risk. |
In millions of dollars at September 30, 2014 |
Derivatives classified
in Trading account
assets / liabilities(1)(2)(3)
|
Derivatives classified
in Other
assets / liabilities(2)(3)
|
||||||||||
Derivatives instruments designated as ASC 815 hedges |
Assets |
Liabilities |
Assets |
Liabilities |
||||||||
Over-the-counter |
$ |
1,159 |
$ |
189 |
$ |
3,021 |
$ |
342 |
||||
Cleared |
2,791 |
623 |
1 |
— |
||||||||
Interest rate contracts |
$ |
3,950 |
$ |
812 |
$ |
3,022 |
$ |
342 |
||||
Over-the-counter |
$ |
1,892 |
$ |
570 |
$ |
756 |
$ |
707 |
||||
Foreign exchange contracts |
$ |
1,892 |
$ |
570 |
$ |
756 |
$ |
707 |
||||
Total derivative instruments designated as ASC 815 hedges |
$ |
5,842 |
$ |
1,382 |
$ |
3,778 |
$ |
1,049 |
||||
Derivatives instruments not designated as ASC 815 hedges |
||||||||||||
Over-the-counter |
$ |
332,157 |
$ |
314,791 |
$ |
39 |
$ |
1 |
||||
Cleared |
212,808 |
218,472 |
8 |
7 |
||||||||
Exchange traded |
52 |
27 |
719 |
816 |
||||||||
Interest rate contracts |
$ |
545,017 |
$ |
533,290 |
$ |
766 |
$ |
824 |
||||
Over-the-counter |
$ |
139,883 |
$ |
140,359 |
$ |
— |
$ |
17 |
||||
Cleared |
759 |
713 |
— |
— |
||||||||
Exchange traded |
8 |
21 |
— |
— |
||||||||
Foreign exchange contracts |
$ |
140,650 |
$ |
141,093 |
$ |
— |
$ |
17 |
||||
Over-the-counter |
$ |
17,899 |
$ |
32,629 |
$ |
— |
$ |
— |
||||
Cleared |
205 |
403 |
— |
— |
||||||||
Exchange traded |
7,136 |
2,409 |
— |
— |
||||||||
Equity contracts |
$ |
25,240 |
$ |
35,441 |
$ |
— |
$ |
— |
||||
Over-the-counter |
$ |
11,392 |
$ |
12,581 |
$ |
— |
$ |
— |
||||
Exchange traded |
668 |
754 |
— |
— |
||||||||
Commodity and other contracts |
$ |
12,060 |
$ |
13,335 |
$ |
— |
$ |
— |
||||
Over-the-counter |
$ |
37,541 |
$ |
37,535 |
$ |
118 |
$ |
403 |
||||
Cleared |
3,290 |
3,365 |
5 |
140 |
||||||||
Credit derivatives(4)
|
$ |
40,831 |
$ |
40,900 |
$ |
123 |
$ |
543 |
||||
Total derivatives instruments not designated as ASC 815 hedges |
$ |
763,798 |
$ |
764,059 |
$ |
889 |
$ |
1,384 |
||||
Total derivatives |
$ |
769,640 |
$ |
765,441 |
$ |
4,667 |
$ |
2,433 |
||||
Cash collateral paid/received(5)(6)
|
$ |
3,258 |
$ |
11,828 |
$ |
197 |
$ |
292 |
||||
Less: Netting agreements(7)
|
(674,769 |
) |
(674,769 |
) |
— |
— |
||||||
Less: Netting cash collateral received/paid(8)
|
(40,435 |
) |
(43,789 |
) |
(2,297 |
) |
— |
|||||
Net receivables/payables included on the Consolidated Balance Sheet(9)
|
$ |
57,694 |
$ |
58,711 |
$ |
2,567 |
$ |
2,725 |
||||
Additional amounts subject to an enforceable master netting agreement but not offset on the Consolidated Balance Sheet | ||||||||||||
Less: Cash collateral received/paid |
$ |
(578 |
) |
$ |
(14 |
) |
$ |
— |
$ |
— |
||
Less: Non-cash collateral received/paid |
(9,350 |
) |
(5,663 |
) |
(997 |
) |
— |
|||||
Total Net receivables/payables(9)
|
$ |
47,766 |
$ |
53,034 |
$ |
1,570 |
$ |
2,725 |
||||
(1) |
The trading derivatives fair values are presented in Note 12 to the Consolidated Financial Statements. |
(2) |
Derivative mark-to-market receivables/payables related to management hedges are recorded in either Other assets/Other liabilities or Trading account assets/Trading account liabilities.
|
(3) |
Over-the-counter (OTC) derivatives include derivatives executed and settled bilaterally with counterparties without the use of an organized exchange or central clearing house. Cleared derivatives include derivatives executed bilaterally with a counterparty in the OTC market but then novated to a central clearing house, whereby the central clearing house becomes the counterparty to both of the original counterparties. Exchange traded derivatives include derivatives executed directly on an organized exchange that provides pre-trade price transparency. |
(4) |
The credit derivatives trading assets comprise $14,398 million related to protection purchased and $26,433 million related to protection sold as of September 30, 2014. The credit derivatives trading liabilities comprise $27,629 million related to protection purchased and $13,271 million related to protection sold as of September 30, 2014.
|
(5) |
For the trading assets/liabilities, this is the net amount of the $47,047 million and $52,263 million of gross cash collateral paid and received, respectively. Of the gross cash collateral paid, $43,789 million was used to offset trading derivative liabilities and, of the gross cash collateral received, $40,435 million was used to offset trading derivative assets.
|
(6) |
For cash collateral received with respect to non-trading derivative liabilities, this is the net amount of $2,589 million of the gross cash collateral received, of which $2,297 million is netted against OTC non-trading derivative positions within Other assets.
|
(7) |
Represents the netting of derivative receivable and payable balances for the same counterparty under enforceable netting agreements. Approximately $453 billion, $220 billion and $2 billion of the netting against trading account asset/liability balances is attributable to each of the OTC, cleared and exchange traded derivatives, respectively.
|
(8) |
Represents the netting of cash collateral paid and received by counterparty under enforceable credit support agreements. Substantially all cash collateral received is netted against OTC derivative assets. Cash collateral paid of approximately $40 billion and $4 billion is netted against each of the OTC and cleared derivative liabilities, respectively.
|
(9) |
The net receivables/payables include approximately $14 billion and $12 billion of derivative asset and liability fair values as of September 30, 2014, respectively, not subject to enforceable master netting agreements.
|
In millions of dollars at December 31, 2013 |
Derivatives classified in Trading
account assets / liabilities(1)(2)(3)
|
Derivatives classified in Other assets / liabilities(2)(3)
|
||||||||||
Derivatives instruments designated as ASC 815 hedges |
Assets |
Liabilities |
Assets |
Liabilities |
||||||||
Over-the-counter |
$ |
956 |
$ |
306 |
$ |
3,082 |
$ |
854 |
||||
Cleared |
2,505 |
585 |
5 |
— |
||||||||
Interest Rate contracts |
$ |
3,461 |
$ |
891 |
$ |
3,087 |
$ |
854 |
||||
Over-the-counter |
$ |
1,540 |
$ |
1,244 |
$ |
989 |
$ |
293 |
||||
Foreign exchange contracts |
$ |
1,540 |
$ |
1,244 |
$ |
989 |
$ |
293 |
||||
Over-the-counter |
$ |
— |
$ |
— |
$ |
— |
$ |
2 |
||||
Credit derivatives |
$ |
— |
$ |
— |
$ |
— |
$ |
2 |
||||
Total derivative instruments designated as ASC 815 hedges |
$ |
5,001 |
$ |
2,135 |
$ |
4,076 |
$ |
1,149 |
||||
Derivatives instruments not designated as ASC 815 hedges |
||||||||||||
Over-the-counter |
$ |
313,772 |
$ |
297,115 |
$ |
37 |
$ |
9 |
||||
Cleared |
311,114 |
319,190 |
27 |
5 |
||||||||
Exchange traded |
33 |
30 |
— |
— |
||||||||
Interest Rate contracts |
$ |
624,919 |
$ |
616,335 |
$ |
64 |
$ |
14 |
||||
Over-the-counter |
$ |
89,847 |
$ |
86,147 |
$ |
79 |
$ |
3 |
||||
Cleared |
1,119 |
1,191 |
— |
— |
||||||||
Exchange traded |
48 |
55 |
— |
— |
||||||||
Foreign exchange contracts |
$ |
91,014 |
$ |
87,393 |
$ |
79 |
$ |
3 |
||||
Over-the-counter |
$ |
19,080 |
$ |
28,458 |
$ |
— |
$ |
— |
||||
Exchange traded |
5,797 |
5,834 |
— |
— |
||||||||
Equity contracts |
$ |
24,877 |
$ |
34,292 |
$ |
— |
$ |
— |
||||
Over-the-counter |
$ |
7,921 |
$ |
9,059 |
$ |
— |
$ |
— |
||||
Exchange traded |
1,161 |
1,111 |
— |
— |
||||||||
Commodity and other Contracts |
$ |
9,082 |
$ |
10,170 |
$ |
— |
$ |
— |
||||
Over-the-counter |
$ |
38,496 |
$ |
38,247 |
$ |
71 |
$ |
563 |
||||
Cleared |
1,850 |
2,547 |
— |
— |
||||||||
Credit derivatives(4)
|
$ |
40,346 |
$ |
40,794 |
$ |
71 |
$ |
563 |
||||
Total Derivatives instruments not designated as ASC 815 hedges |
$ |
790,238 |
$ |
788,984 |
$ |
214 |
$ |
580 |
||||
Total derivatives |
$ |
795,239 |
$ |
791,119 |
$ |
4,290 |
$ |
1,729 |
||||
Cash collateral paid/received(5)(6)
|
$ |
6,073 |
$ |
8,827 |
$ |
82 |
$ |
282 |
||||
Less: Netting agreements(7)
|
(713,598 |
) |
(713,598 |
) |
— |
— |
||||||
Less: Netting cash collateral received/paid(8)
|
(34,893 |
) |
(39,094 |
) |
(2,951 |
) |
— |
|||||
Net receivables/payables included on the Consolidated Balance Sheet(9)
|
$ |
52,821 |
$ |
47,254 |
$ |
1,421 |
$ |
2,011 |
||||
Additional amounts subject to an enforceable master netting agreement but not offset on the Consolidated Balance Sheet | ||||||||||||
Less: Cash collateral received/paid |
$ |
(365 |
) |
$ |
(5 |
) |
$ |
— |
$ |
— |
||
Less: Non-cash collateral received/paid |
(7,478 |
) |
(3,345 |
) |
(341 |
) |
— |
|||||
Total Net receivables/payables(9)
|
$ |
44,978 |
$ |
43,904 |
$ |
1,080 |
$ |
2,011 |
||||
(1) |
The trading derivatives fair values are presented in Note 12 to the Consolidated Financial Statements. |
(2) |
Derivative mark-to-market receivables/payables related to management hedges are recorded in either Other assets/Other liabilities or Trading account assets/Trading account liabilities.
|
(3) |
Over-the-counter (OTC) derivatives include derivatives executed and settled bilaterally with counterparties without the use of an organized exchange or central clearing house. Cleared derivatives include derivatives executed bilaterally with a counterparty in the OTC market but then novated to a central clearing house, whereby the central clearing house becomes the counterparty to both of the original counterparties. Exchange traded derivatives include derivatives executed directly on an organized exchange that provides pre-trade price transparency. |
(4) |
The credit derivatives trading assets comprise $13,673 million related to protection purchased and $26,673 million related to protection sold as of December 31, 2013. The credit derivatives trading liabilities comprise $28,158 million related to protection purchased and $12,636 million related to protection sold as of December 31, 2013.
|
(5) |
For the trading assets/liabilities, this is the net amount of the $45,167 million and $43,720 million of gross cash collateral paid and received, respectively. Of the gross cash collateral paid, $39,094 million was used to offset derivative liabilities and, of the gross cash collateral received, $34,893 million was used to offset derivative assets.
|
(6) |
For cash collateral received with respect to non-trading derivative liabilities, this is the net amount of $3,233 million of gross cash collateral received of which $2,951 million is netted against non-trading derivative positions within other assets.
|
(7) |
Represents the netting of derivative receivable and payable balances for the same counterparty under enforceable netting agreements. Approximately $392 billion, $317 billion and $5 billion of the netting against trading account asset/liability balances is attributable to each of the OTC, cleared and exchange-traded derivatives, respectively.
|
(8) |
Represents the netting of cash collateral paid and received by counterparty under enforceable credit support agreements. Substantially all cash collateral received is netted against OTC derivative assets. Cash collateral paid of approximately $33 billion and $6 billion is netted against OTC and cleared derivative liabilities, respectively.
|
(9) |
The net receivables/payables include approximately $16 billion of both derivative asset and liability fair values not subject to enforceable master netting agreements.
|
Gains (losses) included in Other revenue
|
||||||||||||
Three Months Ended September 30, |
Nine months ended September 30, |
|||||||||||
In millions of dollars |
2014 |
2013 |
2014 |
2013 |
||||||||
Interest rate contracts |
$ |
25 |
$ |
5 |
$ |
146 |
$ |
(245 |
) |
|||
Foreign exchange |
(1,812 |
) |
867 |
(1,772 |
) |
(35 |
) |
|||||
Credit derivatives |
37 |
(196 |
) |
(191 |
) |
(367 |
) |
|||||
Total Citigroup |
$ |
(1,750 |
) |
$ |
676 |
$ |
(1,817 |
) |
$ |
(647 |
) |
|
Gains (losses) on fair value hedges(1)
|
||||||||||||
Three Months Ended September 30, |
Nine months ended September 30, |
|||||||||||
In millions of dollars |
2014 |
2013 |
2014 |
2013 |
||||||||
Gain (loss) on the derivatives in designated and qualifying fair value hedges |
||||||||||||
Interest rate contracts |
$ |
(330 |
) |
$ |
(97 |
) |
$ |
278 |
$ |
(2,588 |
) |
|
Foreign exchange contracts |
780 |
343 |
1,110 |
90 |
||||||||
Commodity contracts |
47 |
— |
(56 |
) |
— |
|||||||
Total gain (loss) on the derivatives in designated and qualifying fair value hedges |
$ |
497 |
$ |
246 |
$ |
1,332 |
$ |
(2,498 |
) |
|||
Gain (loss) on the hedged item in designated and qualifying fair value hedges |
||||||||||||
Interest rate hedges |
$ |
371 |
$ |
51 |
$ |
(283 |
) |
$ |
2,519 |
|||
Foreign exchange hedges |
(789 |
) |
(296 |
) |
(1,157 |
) |
6 |
|||||
Commodity hedges |
(20 |
) |
— |
86 |
— |
|||||||
Total gain (loss) on the hedged item in designated and qualifying fair value hedges |
$ |
(438 |
) |
$ |
(245 |
) |
$ |
(1,354 |
) |
$ |
2,525 |
|
Hedge ineffectiveness recognized in earnings on designated and qualifying fair value hedges |
||||||||||||
Interest rate hedges |
$ |
44 |
$ |
(46 |
) |
$ |
(2 |
) |
$ |
(69 |
) |
|
Foreign exchange hedges |
(11 |
) |
2 |
(11 |
) |
(4 |
) |
|||||
Total hedge ineffectiveness recognized in earnings on designated and qualifying fair value hedges |
$ |
33 |
$ |
(44 |
) |
$ |
(13 |
) |
$ |
(73 |
) |
|
Net gain (loss) excluded from assessment of the effectiveness of fair value hedges |
||||||||||||
Interest rate contracts |
$ |
(3 |
) |
$ |
— |
$ |
(3 |
) |
$ |
— |
||
Foreign exchange contracts(2)
|
2 |
45 |
(36 |
) |
100 |
|||||||
Commodity hedges(2)
|
27 |
— |
30 |
— |
||||||||
Total net gain (loss) excluded from assessment of the effectiveness of fair value hedges |
$ |
26 |
$ |
45 |
$ |
(9 |
) |
$ |
100 |
|||
(1) |
Amounts are included in Other revenue on the Consolidated Statement of Income. The accrued interest income on fair value hedges is recorded in Net interest revenue and is excluded from this table.
|
(2) |
Amounts relate to the premium associated with forward contracts (differential between spot and contractual forward rates). These amounts are excluded from the assessment of hedge effectiveness and are reflected directly in earnings. |
Three Months Ended September 30, |
Nine months ended September 30, |
|||||||||||
In millions of dollars |
2014 |
2013 |
2014 |
2013 |
||||||||
Effective portion of cash flow hedges included in AOCI |
||||||||||||
Interest rate contracts |
$ |
(70 |
) |
$ |
230 |
$ |
153 |
$ |
748 |
|||
Foreign exchange contracts |
1 |
34 |
(56 |
) |
37 |
|||||||
Credit derivatives |
— |
1 |
2 |
14 |
||||||||
Total effective portion of cash flow hedges included in AOCI |
$ |
(69 |
) |
$ |
265 |
$ |
99 |
$ |
799 |
|||
Effective portion of cash flow hedges reclassified from AOCI to earnings |
||||||||||||
Interest rate contracts |
$ |
(84 |
) |
$ |
(211 |
) |
$ |
(218 |
) |
$ |
(596 |
) |
Foreign exchange contracts |
(30 |
) |
(38 |
) |
(114 |
) |
(124 |
) |
||||
Total effective portion of cash flow hedges reclassified from AOCI to earnings(1)
|
$ |
(114 |
) |
$ |
(249 |
) |
$ |
(332 |
) |
$ |
(720 |
) |
(1) |
Included primarily in Other revenue and Net interest revenue on the Consolidated Income Statement.
|
In millions of dollars at September 30, 2014 |
Maximum potential
amount of
future payments
|
Fair
value
payable(1)(2)
|
||||
By industry/counterparty |
||||||
Bank |
$ |
668,108 |
$ |
7,250 |
||
Broker-dealer |
213,263 |
3,558 |
||||
Non-financial |
5,720 |
85 |
||||
Insurance and other financial institutions |
274,895 |
2,378 |
||||
Total by industry/counterparty |
$ |
1,161,986 |
$ |
13,271 |
||
By instrument |
||||||
Credit default swaps and options |
$ |
1,155,278 |
$ |
13,101 |
||
Total return swaps and other |
6,708 |
170 |
||||
Total by instrument |
$ |
1,161,986 |
$ |
13,271 |
||
By rating |
||||||
Investment grade |
$ |
867,548 |
$ |
2,598 |
||
Non-investment grade |
294,438 |
10,673 |
||||
Total by rating |
$ |
1,161,986 |
$ |
13,271 |
||
By maturity |
||||||
Within 1 year |
$ |
249,306 |
$ |
1,271 |
||
From 1 to 5 years |
842,025 |
8,761 |
||||
After 5 years |
70,655 |
3,239 |
||||
Total by maturity |
$ |
1,161,986 |
$ |
13,271 |
||
(1) |
In addition, fair value amounts payable under credit derivatives purchased were $28,172 million.
|
(2) |
In addition, fair value amounts receivable under credit derivatives sold were $26,433 million.
|
In millions of dollars at December 31, 2013 |
Maximum potential
amount of
future payments
|
Fair
value
payable(1)(2)
|
||||
By industry/counterparty |
||||||
Bank |
$ |
727,748 |
$ |
6,520 |
||
Broker-dealer |
224,073 |
4,001 |
||||
Non-financial |
2,820 |
56 |
||||
Insurance and other financial institutions |
188,722 |
2,059 |
||||
Total by industry/counterparty |
$ |
1,143,363 |
$ |
12,636 |
||
By instrument |
||||||
Credit default swaps and options |
$ |
1,141,864 |
$ |
12,607 |
||
Total return swaps and other |
1,499 |
29 |
||||
Total by instrument |
$ |
1,143,363 |
$ |
12,636 |
||
By rating |
||||||
Investment grade |
$ |
752,640 |
$ |
3,242 |
||
Non-investment grade |
390,723 |
9,394 |
||||
Total by rating |
$ |
1,143,363 |
$ |
12,636 |
||
By maturity |
||||||
Within 1 year |
$ |
221,562 |
$ |
858 |
||
From 1 to 5 years |
853,391 |
7,492 |
||||
After 5 years |
68,410 |
4,286 |
||||
Total by maturity |
$ |
1,143,363 |
$ |
12,636 |
||
(1) |
In addition, fair value amounts payable under credit derivatives purchased were $28,723 million.
|
(2) |
In addition, fair value amounts receivable under credit derivatives sold were $26,673 million.
|
• |
Level 1: Quoted prices for identical instruments in active markets.
|
• |
Level 2: Quoted prices for similar instruments in active markets; quoted prices for identical or similar instruments in markets that are not active; and model-derived valuations in which all significant inputs and significant value drivers are observable in active markets.
|
• |
Level 3: Valuations derived from valuation techniques in which one or more significant inputs or significant value drivers are unobservable.
|
In millions of dollars at September 30, 2014 |
Level 1(1)
|
Level 2(1)
|
Level 3 |
Gross inventory |
Netting(2)
|
Net balance |
||||||||||||
Assets |
||||||||||||||||||
Federal funds sold and securities borrowed or purchased under agreements to resell |
$ |
— |
$ |
176,675 |
$ |
3,479 |
$ |
180,154 |
$ |
(39,241 |
) |
$ |
140,913 |
|||||
Trading non-derivative assets |
||||||||||||||||||
Trading mortgage-backed securities |
||||||||||||||||||
U.S. government-sponsored agency guaranteed |
$ |
— |
$ |
18,990 |
$ |
789 |
$ |
19,779 |
$ |
— |
$ |
19,779 |
||||||
Residential |
— |
1,396 |
2,490 |
3,886 |
— |
3,886 |
||||||||||||
Commercial |
— |
2,408 |
554 |
2,962 |
— |
2,962 |
||||||||||||
Total trading mortgage-backed securities |
$ |
— |
$ |
22,794 |
$ |
3,833 |
$ |
26,627 |
$ |
— |
$ |
26,627 |
||||||
U.S. Treasury and federal agency securities |
$ |
17,413 |
$ |
4,293 |
$ |
7 |
$ |
21,713 |
$ |
— |
$ |
21,713 |
||||||
State and municipal |
— |
2,462 |
251 |
2,713 |
— |
2,713 |
||||||||||||
Foreign government |
50,150 |
25,598 |
385 |
76,133 |
— |
76,133 |
||||||||||||
Corporate |
— |
27,174 |
1,214 |
28,388 |
— |
28,388 |
||||||||||||
Equity securities |
51,172 |
2,535 |
1,955 |
55,662 |
— |
55,662 |
||||||||||||
Asset-backed securities |
— |
1,302 |
3,351 |
4,653 |
— |
4,653 |
||||||||||||
Other trading assets |
— |
12,500 |
4,739 |
17,239 |
— |
17,239 |
||||||||||||
Total trading non-derivative assets |
$ |
118,735 |
$ |
98,658 |
$ |
15,735 |
$ |
233,128 |
$ |
— |
$ |
233,128 |
||||||
Trading derivatives |
||||||||||||||||||
Interest rate contracts |
$ |
18 |
$ |
545,414 |
$ |
3,535 |
$ |
548,967 |
||||||||||
Foreign exchange contracts |
12 |
141,374 |
1,156 |
142,542 |
||||||||||||||
Equity contracts |
2,901 |
20,283 |
2,056 |
25,240 |
||||||||||||||
Commodity contracts |
305 |
11,225 |
530 |
12,060 |
||||||||||||||
Credit derivatives |
— |
38,082 |
2,749 |
40,831 |
||||||||||||||
Total trading derivatives |
$ |
3,236 |
$ |
756,378 |
$ |
10,026 |
$ |
769,640 |
||||||||||
Cash collateral paid(3)
|
$ |
3,258 |
||||||||||||||||
Netting agreements |
$ |
(674,769 |
) |
|||||||||||||||
Netting of cash collateral received |
(40,435 |
) |
||||||||||||||||
Total trading derivatives |
$ |
3,236 |
$ |
756,378 |
$ |
10,026 |
$ |
772,898 |
$ |
(715,204 |
) |
$ |
57,694 |
|||||
Investments |
||||||||||||||||||
Mortgage-backed securities |
||||||||||||||||||
U.S. government-sponsored agency guaranteed |
$ |
— |
$ |
36,776 |
$ |
92 |
$ |
36,868 |
$ |
— |
$ |
36,868 |
||||||
Residential |
— |
9,277 |
13 |
9,290 |
— |
9,290 |
||||||||||||
Commercial |
— |
554 |
10 |
564 |
— |
564 |
||||||||||||
Total investment mortgage-backed securities |
$ |
— |
$ |
46,607 |
$ |
115 |
$ |
46,722 |
$ |
— |
$ |
46,722 |
||||||
U.S. Treasury and federal agency securities |
$ |
95,333 |
$ |
16,547 |
$ |
6 |
$ |
111,886 |
$ |
— |
$ |
111,886 |
||||||
State and municipal |
$ |
— |
$ |
10,629 |
$ |
2,284 |
$ |
12,913 |
$ |
— |
$ |
12,913 |
||||||
Foreign government |
39,097 |
55,943 |
620 |
95,660 |
— |
95,660 |
||||||||||||
Corporate |
5 |
13,591 |
362 |
13,958 |
— |
13,958 |
||||||||||||
Equity securities |
2,806 |
419 |
761 |
3,986 |
— |
3,986 |
||||||||||||
Asset-backed securities |
— |
12,259 |
584 |
12,843 |
— |
12,843 |
||||||||||||
Other debt securities |
— |
645 |
65 |
710 |
— |
710 |
||||||||||||
Non-marketable equity securities |
— |
273 |
3,231 |
3,504 |
— |
3,504 |
||||||||||||
Total investments |
$ |
137,241 |
$ |
156,913 |
$ |
8,028 |
$ |
302,182 |
$ |
— |
$ |
302,182 |
||||||
In millions of dollars at September 30, 2014 |
Level 1(1)
|
Level 2(1)
|
Level 3 |
Gross inventory |
Netting(2)
|
Net balance |
||||||||||||
Loans(4)
|
$ |
— |
$ |
1,463 |
$ |
2,948 |
$ |
4,411 |
$ |
— |
$ |
4,411 |
||||||
Mortgage servicing rights |
— |
— |
2,093 |
2,093 |
— |
2,093 |
||||||||||||
Non-trading derivatives and other financial assets measured on a recurring basis, gross |
$ |
— |
$ |
10,246 |
$ |
108 |
$ |
10,354 |
||||||||||
Cash collateral paid |
$ |
197 |
||||||||||||||||
Netting of cash collateral received |
$ |
(2,297 |
) |
|||||||||||||||
Non-trading derivatives and other financial assets measured on a recurring basis |
$ |
— |
$ |
10,246 |
$ |
108 |
$ |
10,551 |
$ |
(2,297 |
) |
$ |
8,254 |
|||||
Total assets |
$ |
259,212 |
$ |
1,200,333 |
$ |
42,417 |
$ |
1,505,417 |
$ |
(756,742 |
) |
$ |
748,675 |
|||||
Total as a percentage of gross assets(5)
|
17.3 |
% |
79.9 |
% |
2.8 |
% |
||||||||||||
Liabilities |
||||||||||||||||||
Interest-bearing deposits |
$ |
— |
$ |
986 |
$ |
805 |
$ |
1,791 |
$ |
— |
$ |
1,791 |
||||||
Federal funds purchased and securities loaned or sold under agreements to repurchase |
$ |
— |
$ |
82,845 |
$ |
1,034 |
$ |
83,879 |
$ |
(39,241 |
) |
$ |
44,638 |
|||||
Trading account liabilities |
||||||||||||||||||
Securities sold, not yet purchased |
63,791 |
14,402 |
368 |
78,561 |
78,561 |
|||||||||||||
Trading derivatives |
||||||||||||||||||
Interest rate contracts |
$ |
14 |
$ |
530,491 |
$ |
3,597 |
$ |
534,102 |
||||||||||
Foreign exchange contracts |
24 |
141,260 |
379 |
141,663 |
||||||||||||||
Equity contracts |
2,959 |
29,367 |
3,115 |
35,441 |
||||||||||||||
Commodity contracts |
357 |
10,901 |
2,077 |
13,335 |
||||||||||||||
Credit derivatives |
— |
37,618 |
3,282 |
40,900 |
||||||||||||||
Total trading derivatives |
$ |
3,354 |
$ |
749,637 |
$ |
12,450 |
$ |
765,441 |
||||||||||
Cash collateral received(6)
|
$ |
11,828 |
||||||||||||||||
Netting agreements |
$ |
(674,769 |
) |
|||||||||||||||
Netting of cash collateral paid |
(43,789 |
) |
||||||||||||||||
Total trading derivatives |
$ |
3,354 |
$ |
749,637 |
$ |
12,450 |
$ |
777,269 |
$ |
(718,558 |
) |
$ |
58,711 |
|||||
Short-term borrowings |
$ |
— |
$ |
1,353 |
$ |
101 |
$ |
1,454 |
$ |
— |
$ |
1,454 |
||||||
Long-term debt |
— |
18,897 |
7,558 |
26,455 |
— |
26,455 |
||||||||||||
Non-trading derivatives and other financial liabilities measured on a recurring basis, gross |
$ |
— |
$ |
2,426 |
$ |
7 |
$ |
2,433 |
||||||||||
Cash collateral received(7)
|
$ |
292 |
||||||||||||||||
Total non-trading derivatives and other financial liabilities measured on a recurring basis |
$ |
— |
$ |
2,426 |
$ |
7 |
$ |
2,725 |
$ |
2,725 |
||||||||
Total liabilities |
$ |
67,145 |
$ |
870,546 |
$ |
22,323 |
$ |
972,134 |
$ |
(757,799 |
) |
$ |
214,335 |
|||||
Total as a percentage of gross liabilities(5)
|
7.0 |
% |
90.7 |
% |
2.3 |
% |
||||||||||||
(1) |
For the three and nine months ended September 30, 2014, the Company transferred assets of approximately $0.3 billion and $2.1 billion, respectively, from Level 1 to Level 2, primarily related to foreign government securities not traded in active markets during the respective periods and Citi refining its methodology for certain equity contracts to reflect the prevalence of off-exchange trading. During the three and nine months ended September 30, 2014, the Company transferred assets of approximately $0.7 billion and $3.7 billion, respectively, from Level 2 to Level 1, almost all related to foreign government bonds traded with sufficient frequency to constitute a liquid market. During the three months ended September 30, 2014, there were no material transfers of liabilities between Level 1 and Level 2. During the nine months ended September 30, 2014, the Company transferred liabilities of approximately $1.4 billion from Level 1 to Level 2, as Citi refined its methodology for certain equity contracts to reflect the prevalence of off-exchange trading.
|
(2) |
Represents netting of: (i) the amounts due under securities purchased under agreements to resell and the amounts owed under securities sold under agreements to repurchase; and (ii) derivative exposures covered by a qualifying master netting agreement and cash collateral offsetting. |
(3) |
Reflects the net amount of $47,047 million of gross cash collateral paid, of which $43,789 million was used to offset derivative liabilities.
|
(4) |
There is no allowance for loan losses recorded for loans reported at fair value. |
(5) |
Because the amount of the cash collateral paid/received has not been allocated to the Level 1, 2 and 3 subtotals, these percentages are calculated based on total assets and liabilities measured at fair value on a recurring basis, excluding the cash collateral paid/received on derivatives. |
(6) |
Reflects the net amount of $52,263 million of gross cash collateral received, of which $40,435 million was used to offset derivative assets.
|
(7) |
Reflects the net amount of $2,589 million of gross cash collateral received, of which $2,297 million was used to offset derivative assets.
|
In millions of dollars at December 31, 2013 |
Level 1(1)
|
Level 2(1)
|
Level 3 |
Gross inventory |
Netting(2)
|
Net balance |
||||||||||||
Assets |
||||||||||||||||||
Federal funds sold and securities borrowed or purchased under agreements to resell |
$ |
— |
$ |
172,848 |
$ |
3,566 |
$ |
176,414 |
$ |
(34,933 |
) |
$ |
141,481 |
|||||
Trading non-derivative assets |
||||||||||||||||||
Trading mortgage-backed securities |
||||||||||||||||||
U.S. government-sponsored agency guaranteed |
— |
22,861 |
1,094 |
23,955 |
— |
23,955 |
||||||||||||
Residential |
— |
1,223 |
2,854 |
4,077 |
— |
4,077 |
||||||||||||
Commercial |
— |
2,318 |
256 |
2,574 |
— |
2,574 |
||||||||||||
Total trading mortgage-backed securities |
$ |
— |
$ |
26,402 |
$ |
4,204 |
$ |
30,606 |
$ |
— |
$ |
30,606 |
||||||
U.S. Treasury and federal agency securities |
$ |
12,080 |
$ |
2,757 |
$ |
— |
$ |
14,837 |
$ |
— |
$ |
14,837 |
||||||
State and municipal |
— |
2,985 |
222 |
3,207 |
— |
3,207 |
||||||||||||
Foreign government |
49,220 |
25,220 |
416 |
74,856 |
— |
74,856 |
||||||||||||
Corporate |
— |
28,699 |
1,835 |
30,534 |
— |
30,534 |
||||||||||||
Equity securities |
58,761 |
1,958 |
1,057 |
61,776 |
— |
61,776 |
||||||||||||
Asset-backed securities |
— |
1,274 |
4,342 |
5,616 |
— |
5,616 |
||||||||||||
Other trading assets |
— |
8,491 |
3,184 |
11,675 |
— |
11,675 |
||||||||||||
Total trading non-derivative assets |
$ |
120,061 |
$ |
97,786 |
$ |
15,260 |
$ |
233,107 |
$ |
— |
$ |
233,107 |
||||||
Trading derivatives |
||||||||||||||||||
Interest rate contracts |
$ |
11 |
$ |
624,902 |
$ |
3,467 |
$ |
628,380 |
||||||||||
Foreign exchange contracts |
40 |
91,189 |
1,325 |
92,554 |
||||||||||||||
Equity contracts |
5,793 |
17,611 |
1,473 |
24,877 |
||||||||||||||
Commodity contracts |
506 |
7,775 |
801 |
9,082 |
||||||||||||||
Credit derivatives |
— |
37,336 |
3,010 |
40,346 |
||||||||||||||
Total trading derivatives |
$ |
6,350 |
$ |
778,813 |
$ |
10,076 |
$ |
795,239 |
||||||||||
Cash collateral paid(3)
|
$ |
6,073 |
||||||||||||||||
Netting agreements |
$ |
(713,598 |
) |
|||||||||||||||
Netting of cash collateral received |
(34,893 |
) |
||||||||||||||||
Total trading derivatives |
$ |
6,350 |
$ |
778,813 |
$ |
10,076 |
$ |
801,312 |
$ |
(748,491 |
) |
$ |
52,821 |
|||||
Investments |
||||||||||||||||||
Mortgage-backed securities |
||||||||||||||||||
U.S. government-sponsored agency guaranteed |
$ |
— |
$ |
41,810 |
$ |
187 |
$ |
41,997 |
$ |
— |
$ |
41,997 |
||||||
Residential |
— |
10,103 |
102 |
10,205 |
— |
10,205 |
||||||||||||
Commercial |
— |
453 |
— |
453 |
— |
453 |
||||||||||||
Total investment mortgage-backed securities |
$ |
— |
$ |
52,366 |
$ |
289 |
$ |
52,655 |
$ |
— |
$ |
52,655 |
||||||
U.S. Treasury and federal agency securities |
$ |
69,139 |
$ |
18,449 |
$ |
8 |
$ |
87,596 |
$ |
— |
$ |
87,596 |
||||||
State and municipal |
$ |
— |
$ |
17,297 |
$ |
1,643 |
$ |
18,940 |
$ |
— |
$ |
18,940 |
||||||
Foreign government |
35,179 |
60,948 |
344 |
96,471 |
— |
96,471 |
||||||||||||
Corporate |
4 |
10,841 |
285 |
11,130 |
— |
11,130 |
||||||||||||
Equity securities |
2,583 |
336 |
815 |
3,734 |
— |
3,734 |
||||||||||||
Asset-backed securities |
— |
13,314 |
1,960 |
15,274 |
— |
15,274 |
||||||||||||
Other debt securities |
— |
661 |
50 |
711 |
— |
711 |
||||||||||||
Non-marketable equity securities |
— |
358 |
4,347 |
4,705 |
— |
4,705 |
||||||||||||
Total investments |
$ |
106,905 |
$ |
174,570 |
$ |
9,741 |
$ |
291,216 |
$ |
— |
$ |
291,216 |
||||||
In millions of dollars at December 31, 2013 |
Level 1(1)
|
Level 2(1)
|
Level 3 |
Gross inventory |
Netting(2)
|
Net balance |
||||||||||||
Loans(4)
|
$ |
— |
$ |
886 |
$ |
4,143 |
$ |
5,029 |
$ |
— |
$ |
5,029 |
||||||
Mortgage servicing rights |
— |
— |
2,718 |
2,718 |
— |
2,718 |
||||||||||||
Non-trading derivatives and other financial assets measured on a recurring basis, gross |
$ |
— |
$ |
9,811 |
$ |
181 |
$ |
9,992 |
||||||||||
Cash collateral paid |
$ |
82 |
||||||||||||||||
Netting of cash collateral received |
$ |
(2,951 |
) |
|||||||||||||||
Non-trading derivatives and other financial assets measured on a recurring basis |
$ |
— |
$ |
9,811 |
$ |
181 |
$ |
10,074 |
$ |
(2,951 |
) |
$ |
7,123 |
|||||
Total assets |
$ |
233,316 |
$ |
1,234,714 |
$ |
45,685 |
$ |
1,519,870 |
$ |
(786,375 |
) |
$ |
733,495 |
|||||
Total as a percentage of gross assets(5)
|
15.4 |
% |
81.6 |
% |
3.0 |
% |
||||||||||||
Liabilities |
||||||||||||||||||
Interest-bearing deposits |
$ |
— |
$ |
787 |
$ |
890 |
$ |
1,677 |
$ |
— |
$ |
1,677 |
||||||
Federal funds purchased and securities loaned or sold under agreements to repurchase |
— |
85,576 |
902 |
86,478 |
(34,933 |
) |
51,545 |
|||||||||||
Trading account liabilities |
||||||||||||||||||
Securities sold, not yet purchased |
51,035 |
9,883 |
590 |
61,508 |
61,508 |
|||||||||||||
Trading account derivatives |
||||||||||||||||||
Interest rate contracts |
$ |
12 |
$ |
614,586 |
$ |
2,628 |
$ |
617,226 |
||||||||||
Foreign exchange contracts |
29 |
87,978 |
630 |
88,637 |
||||||||||||||
Equity contracts |
5,783 |
26,178 |
2,331 |
34,292 |
||||||||||||||
Commodity contracts |
363 |
7,613 |
2,194 |
10,170 |
||||||||||||||
Credit derivatives |
— |
37,510 |
3,284 |
40,794 |
||||||||||||||
Total trading derivatives |
$ |
6,187 |
$ |
773,865 |
$ |
11,067 |
$ |
791,119 |
||||||||||
Cash collateral received(6)
|
$ |
8,827 |
||||||||||||||||
Netting agreements |
$ |
(713,598 |
) |
|||||||||||||||
Netting of cash collateral paid |
(39,094 |
) |
||||||||||||||||
Total trading derivatives |
$ |
6,187 |
$ |
773,865 |
$ |
11,067 |
$ |
799,946 |
$ |
(752,692 |
) |
$ |
47,254 |
|||||
Short-term borrowings |
— |
3,663 |
29 |
3,692 |
— |
3,692 |
||||||||||||
Long-term debt |
— |
19,256 |
7,621 |
26,877 |
— |
26,877 |
||||||||||||
Non-trading derivatives and other financial liabilities measured on a recurring basis, gross |
$ |
— |
$ |
1,719 |
$ |
10 |
$ |
1,729 |
||||||||||
Cash collateral received(7)
|
$ |
282 |
||||||||||||||||
Non-trading derivatives and other financial liabilities measured on a recurring basis |
$ |
— |
$ |
1,719 |
$ |
10 |
$ |
2,011 |
$ |
2,011 |
||||||||
Total liabilities |
$ |
57,222 |
$ |
894,749 |
$ |
21,109 |
$ |
982,189 |
$ |
(787,625 |
) |
$ |
194,564 |
|||||
Total as a percentage of gross liabilities(5)
|
5.9 |
% |
91.9 |
% |
2.2 |
% |
||||||||||||
(1) |
For the three and nine months ended September 30, 2013, the Company transferred assets of $47 million and $1.0 billion, respectively, from Level 1 to Level 2. During the three and nine months ended September 30, 2013, the Company transferred assets of approximately $33 million and $49.1 billion, respectively, from Level 2 to Level 1. Almost all of the transfers during the nine months ended September 30, 2013 were related to U.S. Treasury securities held across the Company’s major investment portfolios where Citi obtained additional information from its external pricing sources to meet the criteria for Level 1 classification. There were no material liability transfers between Level 1 and Level 2 during the three and nine months ended September 30, 2013.
|
(2) |
Represents netting of: (i) the amounts due under securities purchased under agreements to resell and the amounts owed under securities sold under agreements to repurchase; and (ii) derivative exposures covered by a qualifying master netting agreement and cash collateral offsetting. |
(3) |
Reflects the net amount of $45,167 million of gross cash collateral paid, of which $39,094 million was used to offset derivative liabilities.
|
(4) |
There is no allowance for loan losses recorded for loans reported at fair value. |
(5) |
Because the amount of the cash collateral paid/received has not been allocated to the Level 1, 2 and 3 subtotals, these percentages are calculated based on total assets and liabilities measured at fair value on a recurring basis, excluding the cash collateral paid/received on derivatives. |
(6) |
Reflects the net amount of $43,720 million of gross cash collateral received, of which $34,893 million was used to offset derivative assets.
|
(7) |
Reflects the net amount of $3,233 million of gross cash collateral received, of which $2,951 million was used to offset derivative assets.
|
Net realized/unrealized gains (losses) incl. in |
Transfers |
Unrealized gains (losses) still held(3) |
|||||||||||||||||||||||||||||||
In millions of dollars |
Jun. 30, 2014 |
Principal transactions |
Other(1)(2)
|
into Level 3 |
out of Level 3 |
Purchases |
Issuances |
Sales |
Settlements |
Sept. 30, 2014 |
|||||||||||||||||||||||
Assets |
|||||||||||||||||||||||||||||||||
Federal funds sold and securities borrowed or purchased under agreements to resell |
$ |
3,363 |
$ |
116 |
$ |
— |
$ |
— |
$ |
— |
$ |
— |
$ |
— |
$ |
— |
$ |
— |
$ |
3,479 |
$ |
130 |
|||||||||||
Trading non-derivative assets |
|||||||||||||||||||||||||||||||||
Trading mortgage-backed securities |
|||||||||||||||||||||||||||||||||
U.S. government-sponsored agency guaranteed |
$ |
697 |
$ |
22 |
$ |
— |
$ |
217 |
$ |
(145 |
) |
$ |
97 |
$ |
6 |
$ |
(89 |
) |
$ |
(16 |
) |
$ |
789 |
$ |
18 |
||||||||
Residential |
2,610 |
63 |
— |
86 |
(77 |
) |
197 |
— |
(389 |
) |
— |
2,490 |
(4 |
) |
|||||||||||||||||||
Commercial |
409 |
7 |
— |
84 |
(58 |
) |
288 |
— |
(176 |
) |
— |
554 |
(4 |
) |
|||||||||||||||||||
Total trading mortgage-backed securities |
$ |
3,716 |
$ |
92 |
$ |
— |
$ |
387 |
$ |
(280 |
) |
$ |
582 |
$ |
6 |
$ |
(654 |
) |
$ |
(16 |
) |
$ |
3,833 |
$ |
10 |
||||||||
U.S. Treasury and federal agency securities |
$ |
— |
$ |
— |
$ |
— |
$ |
— |
$ |
— |
$ |
7 |
$ |
— |
$ |
— |
$ |
— |
$ |
7 |
$ |
— |
|||||||||||
State and municipal |
242 |
7 |
— |
4 |
(1 |
) |
15 |
— |
(16 |
) |
— |
251 |
6 |
||||||||||||||||||||
Foreign government |
465 |
(40 |
) |
— |
31 |
(64 |
) |
212 |
— |
(241 |
) |
22 |
385 |
(13 |
) |
||||||||||||||||||
Corporate |
1,262 |
83 |
— |
141 |
(104 |
) |
471 |
— |
(685 |
) |
46 |
1,214 |
(42 |
) |
|||||||||||||||||||
Equity securities |
1,863 |
(2 |
) |
— |
123 |
(35 |
) |
119 |
— |
(113 |
) |
— |
1,955 |
34 |
|||||||||||||||||||
Asset-backed securities |
3,376 |
394 |
— |
37 |
(56 |
) |
1,219 |
— |
(1,619 |
) |
— |
3,351 |
33 |
||||||||||||||||||||
Other trading assets |
4,016 |
56 |
— |
809 |
(607 |
) |
1,693 |
— |
(917 |
) |
(311 |
) |
4,739 |
(34 |
) |
||||||||||||||||||
Total trading non-derivative assets |
$ |
14,940 |
$ |
590 |
$ |
— |
$ |
1,532 |
$ |
(1,147 |
) |
$ |
4,318 |
$ |
6 |
$ |
(4,245 |
) |
$ |
(259 |
) |
$ |
15,735 |
$ |
(6 |
) |
|||||||
Trading derivatives, net(4)
|
|||||||||||||||||||||||||||||||||
Interest rate contracts |
17 |
76 |
— |
(194 |
) |
7 |
52 |
— |
(52 |
) |
32 |
(62 |
) |
94 |
|||||||||||||||||||
Foreign exchange contracts |
847 |
8 |
— |
7 |
(73 |
) |
3 |
— |
(1 |
) |
(14 |
) |
777 |
43 |
|||||||||||||||||||
Equity contracts |
(893 |
) |
8 |
— |
(171 |
) |
143 |
124 |
— |
(55 |
) |
(215 |
) |
(1,059 |
) |
(235 |
) |
||||||||||||||||
Commodity contracts |
(1,229 |
) |
(388 |
) |
— |
— |
(27 |
) |
— |
— |
— |
97 |
(1,547 |
) |
(228 |
) |
|||||||||||||||||
Credit derivatives |
(199 |
) |
(222 |
) |
— |
(16 |
) |
(89 |
) |
— |
— |
— |
(7 |
) |
(533 |
) |
(264 |
) |
|||||||||||||||
Total trading derivatives, net(4)
|
$ |
(1,457 |
) |
$ |
(518 |
) |
$ |
— |
$ |
(374 |
) |
$ |
(39 |
) |
$ |
179 |
$ |
— |
$ |
(108 |
) |
$ |
(107 |
) |
$ |
(2,424 |
) |
$ |
(590 |
) |
|||
Net realized/unrealized gains (losses) incl. in |
Transfers |
Unrealized gains (losses) still held(3) |
|||||||||||||||||||||||||||||||
In millions of dollars |
Jun. 30, 2014 |
Principal transactions |
Other(1)(2)
|
into Level 3 |
out of Level 3 |
Purchases |
Issuances |
Sales |
Settlements |
Sept. 30, 2014 |
|||||||||||||||||||||||
Investments |
|||||||||||||||||||||||||||||||||
Mortgage-backed securities |
|||||||||||||||||||||||||||||||||
U.S. government-sponsored agency guaranteed |
$ |
163 |
$ |
— |
$ |
2 |
$ |
18 |
$ |
(83 |
) |
$ |
— |
$ |
— |
$ |
(7 |
) |
$ |
(1 |
) |
$ |
92 |
$ |
— |
||||||||
Residential |
17 |
— |
— |
1 |
— |
— |
— |
(5 |
) |
— |
13 |
— |
|||||||||||||||||||||
Commercial |
7 |
— |
— |
— |
(4 |
) |
7 |
— |
— |
— |
10 |
2 |
|||||||||||||||||||||
Total investment mortgage-backed securities |
$ |
187 |
$ |
— |
$ |
2 |
$ |
19 |
$ |
(87 |
) |
$ |
7 |
$ |
— |
$ |
(12 |
) |
$ |
(1 |
) |
$ |
115 |
$ |
2 |
||||||||
U.S. Treasury and federal agency securities |
$ |
7 |
$ |
— |
$ |
— |
$ |
— |
$ |
— |
$ |
— |
$ |
— |
$ |
(1 |
) |
$ |
— |
$ |
6 |
$ |
— |
||||||||||
State and municipal |
2,102 |
— |
37 |
67 |
(69 |
) |
271 |
— |
(124 |
) |
— |
2,284 |
6 |
||||||||||||||||||||
Foreign government |
615 |
— |
(8 |
) |
— |
(63 |
) |
294 |
— |
(198 |
) |
(20 |
) |
620 |
(9 |
) |
|||||||||||||||||
Corporate |
512 |
— |
(18 |
) |
4 |
(136 |
) |
23 |
— |
(147 |
) |
124 |
362 |
(4 |
) |
||||||||||||||||||
Equity securities |
826 |
— |
18 |
6 |
(7 |
) |
2 |
— |
(84 |
) |
— |
761 |
(23 |
) |
|||||||||||||||||||
Asset-backed securities |
1,739 |
— |
4 |
— |
(2 |
) |
— |
— |
— |
(1,157 |
) |
584 |
(39 |
) |
|||||||||||||||||||
Other debt securities |
48 |
— |
— |
— |
— |
66 |
— |
(49 |
) |
— |
65 |
— |
|||||||||||||||||||||
Non-marketable equity securities |
3,722 |
— |
(8 |
) |
— |
— |
85 |
— |
(51 |
) |
(517 |
) |
3,231 |
42 |
|||||||||||||||||||
Total investments |
$ |
9,758 |
$ |
— |
$ |
27 |
$ |
96 |
$ |
(364 |
) |
$ |
748 |
$ |
— |
$ |
(666 |
) |
$ |
(1,571 |
) |
$ |
8,028 |
$ |
(25 |
) |
|||||||
Loans |
$ |
3,310 |
$ |
— |
$ |
(31 |
) |
$ |
8 |
$ |
— |
$ |
287 |
$ |
19 |
$ |
(513 |
) |
$ |
(132 |
) |
$ |
2,948 |
$ |
2 |
||||||||
Mortgage servicing rights |
2,282 |
— |
(18 |
) |
— |
— |
— |
53 |
(125 |
) |
(99 |
) |
2,093 |
(18 |
) |
||||||||||||||||||
Other financial assets measured on a recurring basis |
201 |
— |
14 |
(83 |
) |
— |
— |
35 |
(1 |
) |
(58 |
) |
108 |
(2 |
) |
||||||||||||||||||
Liabilities |
|||||||||||||||||||||||||||||||||
Interest-bearing deposits |
$ |
909 |
$ |
— |
$ |
184 |
$ |
— |
$ |
(12 |
) |
$ |
— |
$ |
117 |
$ |
— |
$ |
(25 |
) |
$ |
805 |
$ |
20 |
|||||||||
Federal funds purchased and securities loaned or sold under agreements to repurchase |
1,032 |
13 |
— |
— |
— |
— |
— |
117 |
(102 |
) |
1,034 |
5 |
|||||||||||||||||||||
Trading account liabilities |
|||||||||||||||||||||||||||||||||
Securities sold, not yet purchased |
472 |
(1 |
) |
— |
19 |
(40 |
) |
— |
— |
149 |
(233 |
) |
368 |
(11 |
) |
||||||||||||||||||
Short-term borrowings |
129 |
— |
— |
1 |
— |
— |
23 |
— |
(52 |
) |
101 |
(8 |
) |
||||||||||||||||||||
Long-term debt |
7,847 |
520 |
— |
476 |
(760 |
) |
— |
1,419 |
— |
(904 |
) |
7,558 |
215 |
||||||||||||||||||||
Other financial liabilities measured on a recurring basis |
6 |
— |
(2 |
) |
— |
— |
— |
— |
— |
(1 |
) |
7 |
(1 |
) |
|||||||||||||||||||
Net realized/unrealized gains (losses) incl. in |
Transfers |
Unrealized gains (losses) still held(3) |
|||||||||||||||||||||||||||||||
In millions of dollars |
Dec. 31, 2013 |
Principal transactions |
Other(1)(2)
|
into Level 3 |
out of Level 3 |
Purchases |
Issuances |
Sales |
Settlements |
Sept. 30, 2014 |
|||||||||||||||||||||||
Assets |
|||||||||||||||||||||||||||||||||
Federal funds sold and securities borrowed or purchased under agreements to resell |
$ |
3,566 |
$ |
37 |
$ |
— |
$ |
67 |
$ |
(8 |
) |
$ |
75 |
$ |
— |
$ |
— |
$ |
(258 |
) |
$ |
3,479 |
$ |
153 |
|||||||||
Trading non-derivative assets |
|||||||||||||||||||||||||||||||||
Trading mortgage-backed securities |
|||||||||||||||||||||||||||||||||
U.S. government-sponsored agency guaranteed |
$ |
1,094 |
$ |
120 |
$ |
— |
$ |
594 |
$ |
(743 |
) |
$ |
358 |
$ |
13 |
$ |
(606 |
) |
$ |
(41 |
) |
$ |
789 |
$ |
27 |
||||||||
Residential |
2,854 |
380 |
— |
239 |
(359 |
) |
1,877 |
— |
(2,501 |
) |
— |
2,490 |
108 |
||||||||||||||||||||
Commercial |
256 |
18 |
— |
160 |
(120 |
) |
524 |
— |
(284 |
) |
— |
554 |
1 |
||||||||||||||||||||
Total trading mortgage-backed securities |
$ |
4,204 |
$ |
518 |
$ |
— |
$ |
993 |
$ |
(1,222 |
) |
$ |
2,759 |
$ |
13 |
$ |
(3,391 |
) |
$ |
(41 |
) |
$ |
3,833 |
$ |
136 |
||||||||
U.S. Treasury and federal agency securities |
$ |
— |
$ |
3 |
$ |
— |
$ |
— |
$ |
— |
$ |
7 |
$ |
— |
$ |
(3 |
) |
$ |
— |
$ |
7 |
$ |
— |
||||||||||
State and municipal |
222 |
11 |
— |
149 |
(105 |
) |
33 |
— |
(59 |
) |
— |
251 |
(17 |
) |
|||||||||||||||||||
Foreign government |
416 |
(56 |
) |
— |
117 |
(166 |
) |
571 |
— |
(519 |
) |
22 |
385 |
18 |
|||||||||||||||||||
Corporate |
1,835 |
1 |
— |
394 |
(444 |
) |
1,742 |
— |
(2,353 |
) |
39 |
1,214 |
19 |
||||||||||||||||||||
Equity securities |
1,057 |
(215 |
) |
— |
159 |
(95 |
) |
1,305 |
— |
(256 |
) |
— |
1,955 |
22 |
|||||||||||||||||||
Asset-backed securities |
4,342 |
1,002 |
— |
120 |
(284 |
) |
2,921 |
— |
(4,750 |
) |
— |
3,351 |
246 |
||||||||||||||||||||
Other trading assets |
3,184 |
137 |
— |
1,840 |
(1,786 |
) |
4,568 |
— |
(2,827 |
) |
(377 |
) |
4,739 |
(14 |
) |
||||||||||||||||||
Total trading non-derivative assets |
$ |
15,260 |
$ |
1,401 |
$ |
— |
$ |
3,772 |
$ |
(4,102 |
) |
$ |
13,906 |
$ |
13 |
$ |
(14,158 |
) |
$ |
(357 |
) |
$ |
15,735 |
$ |
410 |
||||||||
Trading derivatives, net(4)
|
|||||||||||||||||||||||||||||||||
Interest rate contracts |
839 |
(508 |
) |
— |
(42 |
) |
(117 |
) |
94 |
— |
(150 |
) |
(178 |
) |
(62 |
) |
(11 |
) |
|||||||||||||||
Foreign exchange contracts |
695 |
105 |
— |
28 |
(43 |
) |
4 |
— |
(2 |
) |
(10 |
) |
777 |
67 |
|||||||||||||||||||
Equity contracts |
(858 |
) |
250 |
— |
(762 |
) |
473 |
386 |
— |
(192 |
) |
(356 |
) |
(1,059 |
) |
(402 |
) |
||||||||||||||||
Commodity contracts |
(1,393 |
) |
(140 |
) |
— |
25 |
(35 |
) |
— |
— |
— |
(4 |
) |
(1,547 |
) |
(9 |
) |
||||||||||||||||
Credit derivatives |
(274 |
) |
(449 |
) |
— |
(100 |
) |
(134 |
) |
103 |
— |
(3 |
) |
324 |
(533 |
) |
(196 |
) |
|||||||||||||||
Total trading derivatives, net(4)
|
$ |
(991 |
) |
$ |
(742 |
) |
$ |
— |
$ |
(851 |
) |
$ |
144 |
$ |
587 |
$ |
— |
$ |
(347 |
) |
$ |
(224 |
) |
$ |
(2,424 |
) |
$ |
(551 |
) |
||||
Net realized/unrealized gains (losses) incl. in |
Transfers |
Unrealized gains (losses) still held(3) |
|||||||||||||||||||||||||||||||
In millions of dollars |
Dec. 31, 2013 |
Principal transactions |
Other(1)(2)
|
into Level 3 |
out of Level 3 |
Purchases |
Issuances |
Sales |
Settlements |
Sept. 30, 2014 |
|||||||||||||||||||||||
Investments |
|||||||||||||||||||||||||||||||||
Mortgage-backed securities |
|||||||||||||||||||||||||||||||||
U.S. government-sponsored agency guaranteed |
$ |
187 |
$ |
— |
$ |
47 |
$ |
53 |
$ |
(137 |
) |
$ |
17 |
$ |
— |
$ |
(73 |
) |
$ |
(2 |
) |
$ |
92 |
$ |
(3 |
) |
|||||||
Residential |
102 |
— |
33 |
31 |
(1 |
) |
17 |
— |
(169 |
) |
— |
13 |
— |
||||||||||||||||||||
Commercial |
— |
— |
— |
4 |
(4 |
) |
10 |
— |
— |
— |
10 |
2 |
|||||||||||||||||||||
Total investment mortgage-backed securities |
$ |
289 |
$ |
— |
$ |
80 |
$ |
88 |
$ |
(142 |
) |
$ |
44 |
$ |
— |
$ |
(242 |
) |
$ |
(2 |
) |
$ |
115 |
$ |
(1 |
) |
|||||||
U.S. Treasury and federal agency securities |
$ |
8 |
$ |
— |
$ |
— |
$ |
— |
$ |
— |
$ |
— |
$ |
— |
$ |
(2 |
) |
$ |
— |
$ |
6 |
$ |
— |
||||||||||
State and municipal |
1,643 |
— |
102 |
784 |
(534 |
) |
769 |
— |
(480 |
) |
— |
2,284 |
72 |
||||||||||||||||||||
Foreign government |
344 |
— |
(13 |
) |
182 |
(105 |
) |
623 |
— |
(305 |
) |
(106 |
) |
620 |
(2 |
) |
|||||||||||||||||
Corporate |
285 |
— |
(5 |
) |
22 |
(137 |
) |
289 |
— |
(196 |
) |
104 |
362 |
(8 |
) |
||||||||||||||||||
Equity securities |
815 |
— |
30 |
18 |
(19 |
) |
8 |
— |
(91 |
) |
— |
761 |
(1 |
) |
|||||||||||||||||||
Asset-backed securities |
1,960 |
— |
15 |
— |
(44 |
) |
55 |
— |
(97 |
) |
(1,305 |
) |
584 |
— |
|||||||||||||||||||
Other debt securities |
50 |
— |
(1 |
) |
— |
— |
116 |
— |
(50 |
) |
(50 |
) |
65 |
— |
|||||||||||||||||||
Non-marketable equity securities |
4,347 |
— |
24 |
67 |
— |
704 |
— |
(310 |
) |
(1,601 |
) |
3,231 |
66 |
||||||||||||||||||||
Total investments |
$ |
9,741 |
$ |
— |
$ |
232 |
$ |
1,161 |
$ |
(981 |
) |
$ |
2,608 |
$ |
— |
$ |
(1,773 |
) |
$ |
(2,960 |
) |
$ |
8,028 |
$ |
126 |
||||||||
Loans |
$ |
4,143 |
$ |
— |
$ |
(183 |
) |
$ |
92 |
$ |
6 |
$ |
553 |
$ |
84 |
$ |
(630 |
) |
$ |
(1,117 |
) |
$ |
2,948 |
$ |
17 |
||||||||
Mortgage servicing rights |
2,718 |
— |
(233 |
) |
— |
— |
— |
165 |
(260 |
) |
(297 |
) |
2,093 |
(216 |
) |
||||||||||||||||||
Other financial assets measured on a recurring basis |
181 |
— |
39 |
(83 |
) |
— |
1 |
122 |
(10 |
) |
(142 |
) |
108 |
(20 |
) |
||||||||||||||||||
Liabilities |
|||||||||||||||||||||||||||||||||
Interest-bearing deposits |
$ |
890 |
$ |
— |
$ |
94 |
$ |
— |
$ |
(12 |
) |
$ |
— |
$ |
117 |
$ |
— |
$ |
(96 |
) |
$ |
805 |
$ |
(31 |
) |
||||||||
Federal funds purchased and securities loaned or sold under agreements to repurchase |
902 |
4 |
— |
54 |
— |
78 |
— |
106 |
(102 |
) |
1,034 |
(18 |
) |
||||||||||||||||||||
Trading account liabilities |
|||||||||||||||||||||||||||||||||
Securities sold, not yet purchased |
590 |
14 |
— |
68 |
(91 |
) |
— |
— |
443 |
(628 |
) |
368 |
(19 |
) |
|||||||||||||||||||
Short-term borrowings |
29 |
(31 |
) |
— |
81 |
— |
8 |
24 |
— |
(72 |
) |
101 |
(15 |
) |
|||||||||||||||||||
Long-term debt |
7,621 |
139 |
49 |
2,089 |
(2,998 |
) |
— |
3,365 |
— |
(2,331 |
) |
7,558 |
(205 |
) |
|||||||||||||||||||
Other financial liabilities measured on a recurring basis |
10 |
— |
(3 |
) |
4 |
— |
(1 |
) |
1 |
(3 |
) |
(7 |
) |
7 |
(1 |
) |
|||||||||||||||||
(1)
|
Changes in fair value for available-for-sale investments are recorded in Accumulated other comprehensive income (loss), unless other-than-temporarily impaired, while gains and losses from sales are recorded in Realized gains (losses) from sales of investments on the Consolidated Statement of Income.
|
(2) |
Unrealized gains (losses) on MSRs are recorded in Other revenue on the Consolidated Statement of Income.
|
(3) |
Represents the amount of total gains or losses for the period, included in earnings (and Accumulated other comprehensive income (loss) for changes in fair value of available-for-sale investments), attributable to the change in fair value relating to assets and liabilities classified as Level 3 that are still held at September 30, 2014.
|
(4) |
Total Level 3 derivative assets and liabilities have been netted in these tables for presentation purposes only. |
Net realized/unrealized gains (losses) incl. in |
Transfers |
Unrealized gains (losses) still held(3) |
|||||||||||||||||||||||||||||||
In millions of dollars |
Jun. 30, 2013 |
Principal transactions |
Other(1)(2)
|
into Level 3 |
out of Level 3 |
Purchases |
Issuances |
Sales |
Settlements |
Sept. 30, 2013 |
|||||||||||||||||||||||
Assets |
|||||||||||||||||||||||||||||||||
Federal funds sold and securities borrowed or purchased under agreements to resell |
$ |
4,177 |
$ |
70 |
$ |
— |
$ |
29 |
$ |
(534 |
) |
$ |
25 |
$ |
— |
$ |
— |
$ |
— |
$ |
3,767 |
$ |
(5 |
) |
|||||||||
Trading non-derivative assets |
|||||||||||||||||||||||||||||||||
Trading mortgage-backed securities |
|||||||||||||||||||||||||||||||||
U.S. government-sponsored agency guaranteed |
$ |
1,704 |
$ |
43 |
$ |
— |
$ |
295 |
$ |
(453 |
) |
$ |
160 |
$ |
6 |
$ |
(320 |
) |
$ |
(195 |
) |
$ |
1,240 |
$ |
4 |
||||||||
Residential |
2,938 |
99 |
— |
61 |
(132 |
) |
1,049 |
— |
(1,320 |
) |
— |
2,695 |
16 |
||||||||||||||||||||
Commercial |
326 |
24 |
— |
109 |
(54 |
) |
58 |
— |
(84 |
) |
— |
379 |
(48 |
) |
|||||||||||||||||||
Total trading mortgage-backed securities |
$ |
4,968 |
$ |
166 |
$ |
— |
$ |
465 |
$ |
(639 |
) |
$ |
1,267 |
$ |
6 |
$ |
(1,724 |
) |
$ |
(195 |
) |
$ |
4,314 |
$ |
(28 |
) |
|||||||
U.S. Treasury and federal agency securities |
$ |
— |
$ |
— |
$ |
— |
$ |
54 |
$ |
— |
$ |
— |
$ |
— |
$ |
— |
$ |
— |
$ |
54 |
$ |
2 |
|||||||||||
State and municipal |
241 |
9 |
— |
2 |
— |
11 |
— |
(8 |
) |
— |
255 |
4 |
|||||||||||||||||||||
Foreign government |
240 |
(3 |
) |
— |
7 |
— |
83 |
— |
(85 |
) |
— |
242 |
1 |
||||||||||||||||||||
Corporate |
1,688 |
62 |
— |
129 |
(240 |
) |
408 |
— |
(642 |
) |
(4 |
) |
1,401 |
44 |
|||||||||||||||||||
Equity securities |
190 |
(38 |
) |
— |
132 |
(25 |
) |
331 |
— |
(33 |
) |
— |
557 |
72 |
|||||||||||||||||||
Asset-backed securities |
4,259 |
99 |
— |
14 |
(88 |
) |
748 |
— |
(964 |
) |
— |
4,068 |
100 |
||||||||||||||||||||
Other trading assets |
2,276 |
59 |
— |
2 |
(84 |
) |
721 |
— |
(98 |
) |
(51 |
) |
2,825 |
12 |
|||||||||||||||||||
Total trading non-derivative assets |
$ |
13,862 |
$ |
354 |
$ |
— |
$ |
805 |
$ |
(1,076 |
) |
$ |
3,569 |
$ |
6 |
$ |
(3,554 |
) |
$ |
(250 |
) |
$ |
13,716 |
$ |
207 |
||||||||
Trading derivatives, net(4)
|
|||||||||||||||||||||||||||||||||
Interest rate contracts |
1,083 |
232 |
— |
(47 |
) |
(121 |
) |
65 |
— |
(33 |
) |
156 |
1,335 |
530 |
|||||||||||||||||||
Foreign exchange contracts |
367 |
39 |
— |
(1 |
) |
(9 |
) |
6 |
— |
(1 |
) |
— |
401 |
(15 |
) |
||||||||||||||||||
Equity contracts |
(1,092 |
) |
(224 |
) |
— |
(13 |
) |
(46 |
) |
60 |
— |
(69 |
) |
53 |
(1,331 |
) |
(814 |
) |
|||||||||||||||
Commodity contracts |
(218 |
) |
(223 |
) |
— |
(12 |
) |
(541 |
) |
— |
— |
— |
(76 |
) |
(1,070 |
) |
(332 |
) |
|||||||||||||||
Credit derivatives |
(41 |
) |
(108 |
) |
— |
24 |
(6 |
) |
7 |
— |
— |
84 |
(40 |
) |
(475 |
) |
|||||||||||||||||
Total trading derivatives, net(4)
|
$ |
99 |
$ |
(284 |
) |
$ |
— |
$ |
(49 |
) |
$ |
(723 |
) |
$ |
138 |
$ |
— |
$ |
(103 |
) |
$ |
217 |
$ |
(705 |
) |
$ |
(1,106 |
) |
|||||
Investments |
|||||||||||||||||||||||||||||||||
Mortgage-backed securities |
|||||||||||||||||||||||||||||||||
U.S. government-sponsored agency guaranteed |
$ |
420 |
$ |
— |
$ |
(12 |
) |
$ |
80 |
$ |
(371 |
) |
$ |
44 |
$ |
— |
$ |
(37 |
) |
$ |
— |
$ |
124 |
$ |
9 |
||||||||
Residential |
— |
— |
— |
— |
— |
— |
— |
— |
— |
— |
— |
||||||||||||||||||||||
Commercial |
3 |
— |
— |
1 |
— |
— |
— |
— |
— |
4 |
— |
||||||||||||||||||||||
Total investment mortgage-backed securities |
$ |
423 |
$ |
— |
$ |
(12 |
) |
$ |
81 |
$ |
(371 |
) |
$ |
44 |
$ |
— |
$ |
(37 |
) |
$ |
— |
$ |
128 |
$ |
9 |
||||||||
U.S. Treasury and federal agency securities |
$ |
9 |
$ |
— |
$ |
— |
$ |
— |
$ |
— |
$ |
— |
$ |
— |
$ |
— |
$ |
— |
$ |
9 |
$ |
— |
|||||||||||
State and municipal |
684 |
— |
6 |
5 |
— |
54 |
— |
(23 |
) |
— |
726 |
2 |
|||||||||||||||||||||
Foreign government |
367 |
— |
3 |
63 |
(55 |
) |
105 |
— |
(140 |
) |
(17 |
) |
326 |
(28 |
) |
||||||||||||||||||
Corporate |
404 |
— |
17 |
42 |
— |
85 |
— |
(75 |
) |
(1 |
) |
472 |
8 |
||||||||||||||||||||
Equity securities |
779 |
— |
34 |
— |
(1 |
) |
— |
— |
(13 |
) |
— |
799 |
33 |
||||||||||||||||||||
Asset-backed securities |
1,758 |
— |
14 |
— |
— |
180 |
— |
(14 |
) |
(95 |
) |
1,843 |
29 |
||||||||||||||||||||
Other debt securities |
51 |
— |
— |
— |
— |
— |
— |
(51 |
) |
— |
— |
— |
|||||||||||||||||||||
Non-marketable equity securities |
5,363 |
— |
111 |
— |
— |
68 |
— |
— |
(440 |
) |
5,102 |
100 |
|||||||||||||||||||||
Total investments |
$ |
9,838 |
$ |
— |
$ |
173 |
$ |
191 |
$ |
(427 |
) |
$ |
536 |
$ |
— |
$ |
(353 |
) |
$ |
(553 |
) |
$ |
9,405 |
$ |
153 |
||||||||
Net realized/unrealized gains (losses) incl. in |
Transfers |
Unrealized gains (losses) still held(3) |
|||||||||||||||||||||||||||||||
In millions of dollars |
Jun. 30, 2013 |
Principal transactions |
Other(1)(2)
|
into Level 3 |
out of Level 3 |
Purchases |
Issuances |
Sales |
Settlements |
Sept. 30, 2013 |
|||||||||||||||||||||||
Loans |
$ |
4,321 |
$ |
— |
$ |
(19 |
) |
$ |
— |
$ |
— |
$ |
— |
$ |
631 |
$ |
— |
$ |
(600 |
) |
$ |
4,333 |
$ |
(33 |
) |
||||||||
Mortgage servicing rights |
2,524 |
— |
(6 |
) |
— |
— |
— |
166 |
— |
(104 |
) |
2,580 |
(10 |
) |
|||||||||||||||||||
Other financial assets measured on a recurring basis |
245 |
— |
45 |
— |
— |
— |
107 |
(31 |
) |
(96 |
) |
270 |
41 |
||||||||||||||||||||
Liabilities |
|||||||||||||||||||||||||||||||||
Interest-bearing deposits |
$ |
831 |
$ |
— |
$ |
(19 |
) |
$ |
— |
$ |
— |
$ |
— |
$ |
23 |
$ |
— |
$ |
(5 |
) |
$ |
868 |
$ |
(8 |
) |
||||||||
Federal funds purchased and securities loaned or sold under agreements to repurchase |
1,007 |
14 |
— |
15 |
— |
— |
— |
— |
(113 |
) |
895 |
6 |
|||||||||||||||||||||
Trading account liabilities |
|||||||||||||||||||||||||||||||||
Securities sold, not yet purchased |
450 |
40 |
— |
30 |
(10 |
) |
— |
— |
182 |
(136 |
) |
476 |
— |
||||||||||||||||||||
Short-term borrowings |
335 |
(1 |
) |
— |
2 |
— |
— |
25 |
— |
(200 |
) |
163 |
(42 |
) |
|||||||||||||||||||
Long-term debt |
6,811 |
(309 |
) |
44 |
1,651 |
(1,016 |
) |
— |
54 |
— |
(316 |
) |
7,449 |
(349 |
) |
||||||||||||||||||
Other financial liabilities measured on a recurring basis |
95 |
— |
(23 |
) |
— |
— |
— |
10 |
— |
(111 |
) |
17 |
(23 |
) |
|||||||||||||||||||
Net realized/unrealized gains (losses) incl. in |
Transfers |
Unrealized gains (losses) still held(3) |
|||||||||||||||||||||||||||||||
In millions of dollars |
Dec. 31, 2012 |
Principal transactions |
Other(1)(2)
|
into Level 3 |
out of Level 3 |
Purchases |
Issuances |
Sales |
Settlements |
Sept. 30, 2013 |
|||||||||||||||||||||||
Assets |
|||||||||||||||||||||||||||||||||
Federal funds sold and securities borrowed or purchased under agreements to resell |
$ |
5,043 |
$ |
(93 |
) |
$ |
— |
$ |
627 |
$ |
(1,852 |
) |
$ |
42 |
$ |
— |
$ |
— |
$ |
— |
$ |
3,767 |
$ |
476 |
|||||||||
Trading non-derivative assets |
|||||||||||||||||||||||||||||||||
Trading mortgage-backed securities |
|||||||||||||||||||||||||||||||||
U.S. government-sponsored agency guaranteed |
$ |
1,325 |
$ |
119 |
$ |
— |
$ |
1,032 |
$ |
(1,158 |
) |
$ |
1,129 |
$ |
61 |
$ |
(1,027 |
) |
$ |
(241 |
) |
$ |
1,240 |
$ |
47 |
||||||||
Residential |
1,805 |
457 |
— |
378 |
(344 |
) |
2,947 |
— |
(2,541 |
) |
(7 |
) |
2,695 |
107 |
|||||||||||||||||||
Commercial |
1,119 |
116 |
— |
264 |
(238 |
) |
204 |
— |
(1,069 |
) |
(17 |
) |
379 |
7 |
|||||||||||||||||||
Total trading mortgage-backed securities |
$ |
4,249 |
$ |
692 |
$ |
— |
$ |
1,674 |
$ |
(1,740 |
) |
$ |
4,280 |
$ |
61 |
$ |
(4,637 |
) |
$ |
(265 |
) |
$ |
4,314 |
$ |
161 |
||||||||
U.S. Treasury and federal agency securities |
$ |
— |
$ |
— |
$ |
— |
$ |
54 |
$ |
— |
$ |
— |
$ |
— |
$ |
— |
$ |
— |
$ |
54 |
$ |
2 |
|||||||||||
State and municipal |
195 |
28 |
— |
2 |
— |
86 |
— |
(56 |
) |
— |
255 |
2 |
|||||||||||||||||||||
Foreign government |
311 |
(5 |
) |
— |
60 |
(61 |
) |
200 |
— |
(263 |
) |
— |
242 |
1 |
|||||||||||||||||||
Corporate |
2,030 |
32 |
— |
267 |
(340 |
) |
1,787 |
— |
(1,461 |
) |
(914 |
) |
1,401 |
(375 |
) |
||||||||||||||||||
Equity securities |
264 |
(34 |
) |
— |
180 |
(184 |
) |
471 |
— |
(140 |
) |
— |
557 |
347 |
|||||||||||||||||||
Asset-backed securities |
4,453 |
467 |
— |
100 |
(143 |
) |
3,780 |
— |
(4,372 |
) |
(217 |
) |
4,068 |
80 |
|||||||||||||||||||
Other trading assets |
2,321 |
165 |
— |
510 |
(1,082 |
) |
2,254 |
— |
(1,094 |
) |
(249 |
) |
2,825 |
6 |
|||||||||||||||||||
Total trading non-derivative assets |
$ |
13,823 |
$ |
1,345 |
$ |
— |
$ |
2,847 |
$ |
(3,550 |
) |
$ |
12,858 |
$ |
61 |
$ |
(12,023 |
) |
$ |
(1,645 |
) |
$ |
13,716 |
$ |
224 |
||||||||
Trading derivatives, net(4)
|
|||||||||||||||||||||||||||||||||
Interest rate contracts |
181 |
544 |
— |
702 |
(13 |
) |
208 |
— |
(115 |
) |
(172 |
) |
1,335 |
1,430 |
|||||||||||||||||||
Foreign exchange contracts |
— |
350 |
— |
29 |
(6 |
) |
21 |
— |
(9 |
) |
16 |
401 |
(183 |
) |
|||||||||||||||||||
Equity contracts |
(1,448 |
) |
37 |
— |
(37 |
) |
300 |
176 |
— |
(125 |
) |
(234 |
) |
(1,331 |
) |
(1,652 |
) |
||||||||||||||||
Commodity contracts |
(771 |
) |
188 |
— |
(5 |
) |
(536 |
) |
15 |
— |
(25 |
) |
64 |
(1,070 |
) |
108 |
|||||||||||||||||
Credit derivatives |
(342 |
) |
(254 |
) |
— |
134 |
(184 |
) |
19 |
— |
— |
587 |
(40 |
) |
(444 |
) |
|||||||||||||||||
Total trading derivatives, net(4)
|
$ |
(2,380 |
) |
$ |
865 |
$ |
— |
$ |
823 |
$ |
(439 |
) |
$ |
439 |
$ |
— |
$ |
(274 |
) |
$ |
261 |
$ |
(705 |
) |
$ |
(741 |
) |
||||||
Investments |
|||||||||||||||||||||||||||||||||
Mortgage-backed securities |
|||||||||||||||||||||||||||||||||
U.S. government-sponsored agency guaranteed |
$ |
1,458 |
$ |
— |
$ |
(10 |
) |
$ |
1,977 |
$ |
(3,721 |
) |
$ |
514 |
$ |
— |
$ |
(37 |
) |
$ |
(57 |
) |
$ |
124 |
$ |
9 |
|||||||
Residential |
205 |
— |
23 |
60 |
(265 |
) |
117 |
— |
(140 |
) |
— |
— |
— |
||||||||||||||||||||
Commercial |
— |
— |
— |
4 |
(12 |
) |
12 |
— |
— |
— |
4 |
— |
|||||||||||||||||||||
Total investment mortgage-backed securities |
$ |
1,663 |
$ |
— |
$ |
13 |
$ |
2,041 |
$ |
(3,998 |
) |
$ |
643 |
$ |
— |
$ |
(177 |
) |
$ |
(57 |
) |
$ |
128 |
$ |
9 |
||||||||
U.S. Treasury and federal agency securities |
$ |
12 |
$ |
— |
$ |
— |
$ |
— |
$ |
— |
$ |
— |
$ |
— |
$ |
(3 |
) |
$ |
— |
$ |
9 |
$ |
— |
||||||||||
State and municipal |
849 |
— |
4 |
12 |
(117 |
) |
261 |
— |
(158 |
) |
(125 |
) |
726 |
(3 |
) |
||||||||||||||||||
Foreign government |
383 |
— |
(1 |
) |
168 |
(256 |
) |
394 |
— |
(291 |
) |
(71 |
) |
326 |
(36 |
) |
|||||||||||||||||
Corporate |
385 |
— |
14 |
333 |
(116 |
) |
101 |
— |
(222 |
) |
(23 |
) |
472 |
4 |
|||||||||||||||||||
Equity securities |
773 |
— |
31 |
17 |
(1 |
) |
1 |
— |
(22 |
) |
— |
799 |
30 |
||||||||||||||||||||
Asset-backed securities |
2,220 |
— |
64 |
1,192 |
(1,684 |
) |
1,105 |
— |
(31 |
) |
(1,023 |
) |
1,843 |
4 |
|||||||||||||||||||
Other debt securities |
258 |
— |
— |
— |
(205 |
) |
— |
— |
(53 |
) |
— |
— |
— |
||||||||||||||||||||
Non-marketable equity securities |
5,364 |
— |
289 |
— |
— |
621 |
— |
(83 |
) |
(1,089 |
) |
5,102 |
271 |
||||||||||||||||||||
Total investments |
$ |
11,907 |
$ |
— |
$ |
414 |
$ |
3,763 |
$ |
(6,377 |
) |
$ |
3,126 |
$ |
— |
$ |
(1,040 |
) |
$ |
(2,388 |
) |
$ |
9,405 |
$ |
279 |
||||||||
Net realized/unrealized gains (losses) incl. in |
Transfers |
Unrealized gains (losses) still held(3) |
|||||||||||||||||||||||||||||||
In millions of dollars |
Dec. 31, 2012 |
Principal transactions |
Other(1)(2)
|
into Level 3 |
out of Level 3 |
Purchases |
Issuances |
Sales |
Settlements |
Sept. 30, 2013 |
|||||||||||||||||||||||
Loans |
$ |
4,931 |
$ |
— |
$ |
(97 |
) |
$ |
353 |
$ |
— |
$ |
59 |
$ |
644 |
$ |
(6 |
) |
$ |
(1,551 |
) |
$ |
4,333 |
$ |
(99 |
) |
|||||||
Mortgage servicing rights |
1,942 |
— |
411 |
— |
— |
— |
543 |
(1 |
) |
(315 |
) |
2,580 |
181 |
||||||||||||||||||||
Other financial assets measured on a recurring basis |
2,452 |
— |
51 |
1 |
— |
216 |
447 |
(2,041 |
) |
(856 |
) |
270 |
266 |
||||||||||||||||||||
Liabilities |
|||||||||||||||||||||||||||||||||
Interest-bearing deposits |
$ |
786 |
$ |
— |
$ |
(86 |
) |
$ |
22 |
$ |
— |
$ |
— |
$ |
86 |
$ |
— |
$ |
(112 |
) |
$ |
868 |
$ |
(298 |
) |
||||||||
Federal funds purchased and securities loaned or sold under agreements to repurchase |
841 |
74 |
— |
216 |
(15 |
) |
— |
— |
40 |
(113 |
) |
895 |
35 |
||||||||||||||||||||
Trading account liabilities |
|||||||||||||||||||||||||||||||||
Securities sold, not yet purchased |
365 |
51 |
— |
54 |
(21 |
) |
— |
— |
358 |
(229 |
) |
476 |
132 |
||||||||||||||||||||
Short-term borrowings |
112 |
25 |
— |
2 |
(4 |
) |
— |
316 |
— |
(238 |
) |
163 |
(40 |
) |
|||||||||||||||||||
Long-term debt |
6,726 |
62 |
113 |
3,016 |
(2,030 |
) |
— |
959 |
(1 |
) |
(1,046 |
) |
7,449 |
(1,027 |
) |
||||||||||||||||||
Other financial liabilities measured on a recurring basis |
24 |
— |
(208 |
) |
5 |
(2 |
) |
(3 |
) |
100 |
— |
(315 |
) |
17 |
(26 |
) |
|||||||||||||||||
(1)
|
Changes in fair value for available-for-sale investments are recorded in Accumulated other comprehensive income (loss), unless other-than-temporarily impaired, while gains and losses from sales are recorded in Realized gains (losses) from sales of investments on the Consolidated Statement of Income.
|
(2) |
Unrealized gains (losses) on MSRs are recorded in Other revenue on the Consolidated Statement of Income.
|
(3) |
Represents the amount of total gains or losses for the period, included in earnings (and Accumulated other comprehensive income (loss) for changes in fair value of available-for-sale investments), attributable to the change in fair value relating to assets and liabilities classified as Level 3 that are still held at September 30, 2013.
|
(4) |
Total Level 3 derivative assets and liabilities have been netted in these tables for presentation purposes only. |
• |
Transfers of Long-term debt of $2.1 billion from Level 2 to Level 3, and of $3.0 billion from Level 3 to Level 2, mainly related to structured debt, reflecting changes in the significance of unobservable inputs as well as certain underlying market inputs becoming less or more observable.
|
• |
Transfers of Other trading assets of $1.8 billion from Level 2 to Level 3, and of $1.8 billion from Level 3 to Level 2, related to trading loans, reflecting changes in the volume of market quotations.
|
• |
Transfers of Long-term debt of $1.7 billion from Level 2 to Level 3 included $1.3 billion related to the transfer of a previously bifurcated hybrid debt instrument from Level 2 to Level 3 to reflect the host contract and the reclassification of Level 3 commodity contracts into Long-term debt. Prior to the third quarter of 2013, certain bifurcated embedded derivatives were reported as derivatives within Trading account assets and Trading account liabilities, while the related debt host contracts were reported at fair value within Long-term debt. Beginning in the third quarter of 2013, these hybrid
|
• |
Additionally, during the third quarter of 2013, the Company transferred Long-term debt of $1.0 billion from Level 3 to Level 2, related mainly to structured debt driven by certain underlying market inputs becoming more observable as well as unobservable inputs used in the valuation becoming not significant.
|
• |
Transfers of Federal funds sold and securities borrowed or purchased under agreements to resell of $1.9 billion from Level 3 to Level 2 related to shortening of the remaining tenor of certain reverse repos. There is more transparency and observability for repo curves used in the valuation of structured reverse repos with tenors up to five years; thus, structured reverse repos maturing within five years are generally classified as Level 2.
|
• |
Transfers of U.S. government-sponsored agency guaranteed mortgage-backed securities in Investments of $2.0 billion from Level 2 to Level 3, and of $3.7 billion from Level 3 to Level 2, due to changes in the level of price observability for the specific securities. Similarly, there were transfers of U.S. government-sponsored agency guaranteed mortgage-backed securities in Trading securities of $1.0 billion from Level 2 to Level 3, and of $1.2 billion from Level 3 to Level 2.
|
• |
Transfers of asset-backed securities in Investments of $1.2 billion from Level 2 to Level 3, and of $1.7 billion from Level 3 to Level 2. These transfers were related to
|
• |
Transfers of Long-term debt of $3.0 billion from Level 2 to Level 3, included $1.3 billion related to the transfer of a previously bifurcated hybrid debt instrument from Level 2 to Level 3 to reflect the host contract and the reclassification of Level 3 commodity contracts into Long-term debt. The remaining amounts of Long-term debt transferred from Level 2 to Level 3 as well as the $2.0 billion transfer from Level 3 to Level 2 were related mainly to structured debt reflecting changes in the significance of unobservable inputs as well as certain underlying market inputs becoming less or more observable.
|
As of September 30, 2014 |
Fair Value(1)
(in millions)
|
Methodology |
Input |
Low(2)(3)
|
High(2)(3)
|
Weighted
Average(4)
|
||||||||
Assets |
||||||||||||||
|
Federal funds sold and securities
borrowed or purchased under
agreements to resell
|
$ |
3,006 |
Model-based |
Interest rate |
1.69 |
% |
2.18 |
% |
2.04 |
% |
||||
Mortgage-backed securities |
$ |
2,814 |
Price-based |
Price |
$ |
0.03 |
$ |
112.87 |
$ |
84.66 |
||||
905 |
Yield analysis |
Yield |
0.01 |
% |
21.53 |
% |
7.08 |
% |
||||||
|
State and municipal, foreign
government, corporate and other debt
securities
|
$ |
7,011 |
Price-based |
Price |
$ |
— |
$ |
155.70 |
$ |
90.50 |
||||
1,638 |
Cash flow |
Credit spread |
60 bps |
600 bps |
224 bps |
|||||||||
Equity securities(5)
|
$ |
1,874 |
Price-based |
Price (5)
|
$ |
— |
$ |
150.00 |
$ |
69.64 |
||||
755 |
Cash flow |
Yield |
4.00 |
% |
5.00 |
% |
4.50 |
% |
||||||
WAL |
0.10 years |
3.54 years |
1.12 years |
|||||||||||
Asset-backed securities |
$ |
3,786 |
Price-based |
Price |
$ |
— |
$ |
105.50 |
$ |
70.02 |
||||
Non-marketable equity |
$ |
1,629 |
Price-based |
Discount to price |
— |
% |
90.00 |
% |
8.19 |
% |
||||
1,179 |
Comparables analysis |
EBITDA multiples |
5.20 |
x |
12.50 |
x |
9.48 |
x |
||||||
400 |
Cash flow |
PE ratio |
8.30 |
x |
8.30 |
x |
8.30 |
x |
||||||
Price-to-book ratio |
1.00 |
x |
1.56 |
x |
1.15 |
x |
||||||||
Fund NAV |
$ |
1 |
$ |
67,511,273 |
$ |
30,871,087 |
||||||||
Derivatives—Gross(6)
|
||||||||||||||
Interest rate contracts (gross) |
$ |
6,989 |
Model-based |
Interest rate (IR) lognormal volatility |
14.15 |
% |
76.70 |
% |
24.27 |
% |
||||
Mean reversion |
1.00 |
% |
20.00 |
% |
10.44 |
% |
||||||||
Foreign exchange contracts (gross) |
$ |
1,198 |
Model-based |
Foreign exchange (FX) volatility |
0.45 |
% |
23.10 |
% |
9.24 |
% |
||||
291 |
Cash flow |
Interest rate |
5.00 |
% |
12.75 |
% |
5.83 |
% |
||||||
IR-FX correlation |
40.00 |
% |
60.00 |
% |
50.00 |
% |
||||||||
IR-IR correlation |
40.00 |
% |
40.00 |
% |
40.00 |
% |
||||||||
Equity contracts (gross)(7)
|
$ |
4,258 |
Model-based |
Equity volatility |
8.22 |
% |
80.00 |
% |
26.79 |
% |
||||
870 |
Price-based |
Equity forward |
84.19 |
% |
121.00 |
% |
98.80 |
% |
||||||
Equity-FX correlation |
(84.00 |
)% |
71.00 |
% |
(23.66 |
)% |
||||||||
Equity-equity correlation |
(66.30 |
)% |
99.00 |
% |
41.41 |
% |
||||||||
Price |
$ |
— |
$ |
174.94 |
$ |
53.76 |
||||||||
Commodity contracts (gross) |
$ |
2,605 |
Model-based |
Commodity volatility |
5.00 |
% |
66.00 |
% |
15.00 |
% |
||||
As of September 30, 2014 |
Fair Value(1)
(in millions)
|
Methodology |
Input |
Low(2)(3)
|
High(2)(3)
|
Weighted
Average(4)
|
||||||||
Commodity correlation |
(52.00 |
)% |
90.00 |
% |
27.00 |
% |
||||||||
Forward price |
54.72 |
% |
226.83 |
% |
96.86 |
% |
||||||||
Credit derivatives (gross) |
$ |
4,437 |
Model-based |
Recovery rate |
12.00 |
% |
60.00 |
% |
38.69 |
% |
||||
1,580 |
Price-based |
Credit correlation |
5.00 |
% |
95.00 |
% |
58.89 |
% |
||||||
Price |
$ |
0.25 |
$ |
108.67 |
$ |
44.08 |
||||||||
Credit spread |
1 bps |
1,377 bps |
208 bps |
|||||||||||
Upfront points |
1.01 |
99.90 |
71.85 |
|||||||||||
|
Nontrading derivatives and other financial
assets and liabilities measured on a
recurring basis (gross)(6)
|
$ |
47 |
Price-based |
Price |
$ |
— |
$ |
133.00 |
$ |
100.29 |
||||
45 |
Model-based |
Interest Rate |
7.01 |
% |
7.03 |
% |
7.02 |
% |
||||||
23 |
Comparables analysis |
EBITDA multiples |
3.60 |
x |
12.50 |
x |
11.52 |
x |
||||||
PE ratio |
9.40 |
x |
9.40 |
x |
9.40 |
x |
||||||||
Fund NAV |
$ |
1 |
$ |
10,229,908 |
$ |
8,376,456 |
||||||||
Redemption rate |
3.00 |
% |
99.50 |
% |
66.38 |
% |
||||||||
Discount to price |
— |
% |
52.00 |
% |
19.14 |
% |
||||||||
Price-to-book ratio |
1.20 |
x |
1.20 |
x |
1.20 |
x |
||||||||
Loans |
$ |
1,092 |
Cash flow |
Yield |
1.60 |
% |
4.50 |
% |
2.23 |
% |
||||
803 |
Price-based |
Price |
$ |
5.00 |
$ |
105.88 |
$ |
98.95 |
||||||
570 |
Model-based |
Credit spread |
35 bps |
923 bps |
204 bps |
|||||||||
442 |
Yield analysis |
|||||||||||||
Mortgage servicing rights |
$ |
1,998 |
Cash flow |
Yield |
6.14 |
% |
20.75 |
% |
12.00 |
% |
||||
WAL |
3.30 years |
8.48 years |
6.10 years |
|||||||||||
Liabilities |
||||||||||||||
Interest-bearing deposits |
$ |
805 |
Model-based |
Mean reversion |
1.00 |
% |
20.00 |
% |
10.50 |
% |
||||
Equity-IR Correlation |
31.00 |
% |
31.00 |
% |
31.00 |
% |
||||||||
Forward price |
54.72 |
% |
226.83 |
% |
96.86 |
% |
||||||||
Commodity correlation |
(52.00 |
)% |
90.00 |
% |
27.00 |
% |
||||||||
Commodity volatility |
5.00 |
% |
66.00 |
% |
15.00 |
% |
||||||||
|
Federal funds purchased and securities
loaned or sold under agreements to
repurchase
|
$ |
1,034 |
Model-based |
Interest rate |
0.77 |
% |
2.72 |
% |
2.34 |
% |
||||
Trading account liabilities |
||||||||||||||
Securities sold, not yet purchased |
$ |
333 |
Price-based |
Credit-IR correlation |
(70.49 |
)% |
5.37 |
% |
(41.74 |
)% |
||||
Price |
$ |
98.25 |
$ |
133.00 |
$ |
99.81 |
||||||||
|
Short-term borrowings and long-term
debt
|
$ |
7,531 |
Model-based |
IR lognormal volatility |
11.86 |
% |
87.59 |
% |
23.93 |
% |
||||
Mean reversion |
1.00 |
% |
20.00 |
% |
10.44 |
% |
||||||||
Equity volatility |
14.20 |
% |
27.10 |
% |
22.45 |
% |
||||||||
Equity-equity correlation |
(66.30 |
)% |
99.00 |
% |
40.90 |
% |
||||||||
Equity-FX correlation |
(84.00 |
)% |
48.70 |
% |
(26.80 |
)% |
||||||||
Equity forward |
90.00 |
% |
121.00 |
% |
98.40 |
% |
||||||||
Forward price |
54.72 |
% |
226.83 |
% |
97.33 |
% |
||||||||
Commodity correlation |
(52.00 |
)% |
90.00 |
% |
27.00 |
% |
||||||||
Commodity volatility |
5.00 |
% |
66.00 |
% |
15.00 |
% |
||||||||
As of December 31, 2013 |
Fair Value(1)
(in millions)
|
Methodology |
Input |
Low(2)(3)
|
High(2)(3)
|
Weighted
Average(4)
|
||||||||
Assets |
||||||||||||||
|
Federal funds sold and securities
borrowed or purchased under
agreements to resell
|
$ |
3,299 |
Model-based |
Interest rate |
1.33 |
% |
2.19 |
% |
2.04 |
% |
||||
Mortgage-backed securities |
$ |
2,869 |
Price-based |
Price |
$ |
0.10 |
$ |
117.78 |
77.60 |
|||||
1,241 |
Yield analysis |
Yield |
0.03 |
% |
21.80 |
% |
8.66 |
% |
||||||
|
State and municipal, foreign
government, corporate and other debt
securities
|
$ |
5,361 |
Price-based |
Price |
$ |
— |
$ |
126.49 |
$ |
87.47 |
||||
2,014 |
Cash flow |
Credit spread |
11 bps |
375 bps |
213 bps |
|||||||||
Equity securities(5)
|
$ |
947 |
Price-based |
Price (5)
|
$ |
0.31 |
$ |
93.66 |
$ |
86.90 |
||||
827 |
Cash flow |
Yield |
4.00 |
% |
5.00 |
% |
4.50 |
% |
||||||
WAL |
0.01 years |
3.55 years |
1.38 years |
|||||||||||
Asset-backed securities |
$ |
4,539 |
Price-based |
Price |
$ |
— |
$ |
135.83 |
$ |
70.89 |
||||
1,300 |
Model-based |
Credit spread |
25 bps |
378 bps |
302 bps |
|||||||||
Non-marketable equity |
$ |
2,324 |
Price-based |
Fund NAV |
$ |
612 |
$336,559,340 |
$124,080,454 |
||||||
1,470 |
Comparables analysis |
EBITDA multiples |
4.20 |
x |
16.90 |
x |
9.78 |
x |
||||||
533 |
Cash flow |
Discount to price |
— |
% |
75.00 |
% |
3.47 |
% |
||||||
Price-to-book ratio |
0.90 |
x |
1.05 |
x |
1.02 |
x |
||||||||
PE ratio |
9.10 |
x |
9.10 |
x |
9.10 |
x |
||||||||
Derivatives—Gross(6)
|
||||||||||||||
Interest rate contracts (gross) |
$ |
5,721 |
Model-based |
Interest rate (IR) lognormal volatility |
10.60 |
% |
87.20 |
% |
21.16 |
% |
||||
Foreign exchange contracts (gross) |
$ |
1,727 |
Model-based |
Foreign exchange (FX) volatility |
1.00 |
% |
28.00 |
% |
13.45 |
% |
||||
189 |
Cash flow |
Interest rate |
0.11 |
% |
13.88 |
% |
6.02 |
% |
||||||
IR-FX correlation |
40.00 |
% |
60.00 |
% |
50.00 |
% |
||||||||
IR-IR correlation |
40.00 |
% |
68.79 |
% |
40.52 |
% |
||||||||
Credit spread |
25 bps |
419 bps |
162 bps |
|||||||||||
Equity contracts (gross)(7)
|
$ |
3,189 |
Model-based |
Equity volatility |
10.02 |
% |
73.48 |
% |
29.87 |
% |
||||
563 |
Price-based |
Equity forward |
79.10 |
% |
141.00 |
% |
100.24 |
% |
||||||
Equity-equity correlation |
(81.30 |
)% |
99.40 |
% |
48.45 |
% |
||||||||
Equity-FX correlation |
(70.00 |
)% |
55.00 |
% |
0.60 |
% |
||||||||
Price |
$ |
— |
$ |
118.75 |
$ |
88.10 |
||||||||
Commodity contracts (gross) |
$ |
2,988 |
Model-based |
Commodity volatility |
4.00 |
% |
146.00 |
% |
15.00 |
% |
||||
Commodity correlation |
(75.00 |
)% |
90.00 |
% |
32.00 |
% |
||||||||
Forward price |
23.00 |
% |
242.00 |
% |
105.00 |
% |
||||||||
Credit derivatives (gross) |
$ |
4,767 |
Model-based |
Recovery rate |
20.00 |
% |
64.00 |
% |
38.11 |
% |
||||
1,520 |
Price-based |
Credit correlation |
5.00 |
% |
95.00 |
% |
47.43 |
% |
||||||
Price |
$ |
0.02 |
$ |
115.20 |
$ |
29.83 |
||||||||
Credit spread |
3 bps |
1,335 bps |
203 bps |
|||||||||||
Upfront points |
2.31 |
100.00 |
57.69 |
|||||||||||
|
Nontrading derivatives and other financial
assets and liabilities measured on a
recurring basis (gross)(6)
|
$ |
82 |
Price-based |
EBITDA multiples |
5.20 |
x |
12.60 |
x |
12.08 |
x |
||||
60 |
Comparables analysis |
PE ratio |
6.90 |
x |
6.90 |
x |
6.90 |
x |
||||||
38 |
Model-based |
Price-to-book Ratio |
1.05 |
x |
1.05 |
x |
1.05 |
x |
||||||
Price |
$ |
— |
$ |
105.10 |
$ |
71.25 |
||||||||
Fund NAV |
$ |
1.00 |
$ |
10,688,600 |
$ |
9,706,488 |
||||||||
As of December 31, 2013 |
Fair Value(1)
(in millions)
|
Methodology |
Input |
Low(2)(3)
|
High(2)(3)
|
Weighted
Average(4)
|
||||||||
Discount to price |
— |
% |
35.00 |
% |
16.36 |
% |
||||||||
Loans |
$ |
2,153 |
Price-based |
Price |
$ |
— |
$ |
103.75 |
$ |
91.19 |
||||
1,422 |
Model-based |
Yield |
1.60 |
% |
4.50 |
% |
2.10 |
% |
||||||
549 |
Yield analysis |
Credit spread |
49 bps |
1,600 bps |
302 bps |
|||||||||
Mortgage servicing rights |
$ |
2,625 |
Cash flow |
Yield |
3.64 |
% |
12.00 |
% |
7.19 |
% |
||||
WAL |
2.27 years |
9.44 years |
6.12 years |
|||||||||||
Liabilities |
||||||||||||||
Interest-bearing deposits |
$ |
890 |
Model-based |
Equity volatility |
14.79 |
% |
42.15 |
% |
27.74 |
% |
||||
Mean reversion |
1.00 |
% |
20.00 |
% |
10.50 |
% |
||||||||
Equity-IR correlation |
9.00 |
% |
20.50 |
% |
19.81 |
% |
||||||||
Forward price |
23.00 |
% |
242.00 |
% |
105.00 |
% |
||||||||
Commodity correlation |
(75.00 |
)% |
90.00 |
% |
32.00 |
% |
||||||||
Commodity volatility |
4.00 |
% |
146.00 |
% |
15.00 |
% |
||||||||
|
Federal funds purchased and securities
loaned or sold under agreements to
repurchase
|
$ |
902 |
Model-based |
Interest rate |
0.47 |
% |
3.66 |
% |
2.71 |
% |
||||
Trading account liabilities |
||||||||||||||
Securities sold, not yet purchased |
$ |
289 |
Model-based |
Credit spread |
166 bps |
180 bps |
175 bps |
|||||||
$ |
273 |
Price-based |
Credit-IR correlation |
(68.00 |
)% |
5.00 |
% |
(50.00 |
)% |
|||||
Price |
$ |
— |
$ |
124.25 |
$ |
99.75 |
||||||||
|
Short-term borrowings and long-term
debt
|
$ |
6,781 |
Model-based |
IR lognormal volatility |
10.60 |
% |
87.20 |
% |
20.97 |
% |
||||
868 |
Price-based |
Equity forward |
79.10 |
% |
141.00 |
% |
99.51 |
% |
||||||
Equity volatility |
10.70 |
% |
57.20 |
% |
19.41 |
% |
||||||||
Equity-FX correlation |
(70.00 |
)% |
55.00 |
% |
0.60 |
% |
||||||||
Equity-equity correlation |
(81.30 |
)% |
99.40 |
% |
48.30 |
% |
||||||||
Interest rate |
4.00 |
% |
10.00 |
% |
5.00 |
% |
||||||||
Price |
$ |
0.63 |
$ |
103.75 |
$ |
80.73 |
||||||||
Forward price |
23.00 |
% |
242.00 |
% |
101.00 |
% |
||||||||
(1) |
The fair value amounts presented in this table represent the primary valuation technique or techniques for each class of assets or liabilities. |
(2) |
Some inputs are shown as zero due to rounding. |
(3) |
When the low and high inputs are the same, there is either a constant input applied to all positions, or the methodology involving the input applies to one large position only. |
(4) |
Weighted averages are calculated based on the fair value of the instrument. |
(5) |
For equity securities, the price input is expressed on an absolute basis, not as a percentage of the notional amount. |
(6) |
Both trading and nontrading account derivatives—assets and liabilities—are presented on a gross absolute value basis. |
(7) |
Includes hybrid products. |
In millions of dollars |
Fair value |
Level 2 |
Level 3 |
||||||
September 30, 2014 |
|||||||||
Loans held-for-sale |
$ |
4,184 |
$ |
1,267 |
$ |
2,917 |
|||
Other real estate owned |
109 |
20 |
89 |
||||||
Loans(1)
|
3,441 |
3,027 |
414 |
||||||
Total assets at fair value on a nonrecurring basis |
$ |
7,734 |
$ |
4,314 |
$ |
3,420 |
|||
(1)
|
Represents impaired loans held for investment whose carrying amount is based on the fair value of the underlying collateral, including primarily real-estate secured loans. |
In millions of dollars |
Fair value |
Level 2 |
Level 3 |
||||||
December 31, 2013 |
|||||||||
Loans held-for-sale |
$ |
3,483 |
$ |
2,165 |
$ |
1,318 |
|||
Other real estate owned |
138 |
15 |
123 |
||||||
Loans(1)
|
4,713 |
3,947 |
766 |
||||||
Total assets at fair value on a nonrecurring basis |
$ |
8,334 |
$ |
6,127 |
$ |
2,207 |
|||
(1)
|
Represents impaired loans held for investment whose carrying amount is based on the fair value of the underlying collateral, including primarily real-estate secured loans. |
As of September 30, 2014 |
Fair Value(1)
(in millions)
|
Methodology |
Input |
Low |
High |
Weighted
average(2)
|
||||||||
Loans held-for-sale |
$ |
2,585 |
Price-based |
Price |
$ |
91.78 |
$ |
100.00 |
$ |
99.00 |
||||
Other real estate owned |
$ |
81 |
Price-based |
Appraised Value |
$ |
1,128,491 |
$ |
8,518,230 |
$ |
4,953,898 |
||||
Price |
$ |
51.81 |
$ |
100.00 |
$ |
78.37 |
||||||||
Discount to price |
13.00 |
% |
62.00 |
% |
32.00 |
% |
||||||||
Loans(3)
|
$ |
353 |
Price-based |
Discount to price(4)
|
13.00 |
% |
39.00 |
% |
31.00 |
% |
||||
(1)
|
The fair value amounts presented in this table represent the primary valuation technique or techniques for each class of assets or liabilities. |
(2) |
Weighted averages are calculated based on the fair value of the instrument. |
(3) |
Represents loans held for investment whose carrying amounts are based on the fair value of the underlying collateral. |
(4) |
Includes estimated costs to sell. |
As of December 31, 2013 |
Fair Value(1)
(in millions)
|
Methodology |
Input |
Low |
High |
Weighted
average(2)
|
||||||||
Loans held-for-sale |
$ |
912 |
Price-based |
Price(5)
|
$ |
60.00 |
$ |
100.00 |
$ |
98.77 |
||||
393 |
Cash Flow |
Credit Spread |
45 bps |
80 bps |
64 bps |
|||||||||
Other real estate owned |
$ |
98 |
Price-based |
Discount to price(4)
|
34.00 |
% |
59.00 |
% |
39.00 |
% |
||||
17 |
Cash Flow |
Price(5)
|
$ |
60.46 |
$ |
100.00 |
$ |
96.67 |
||||||
Appraised Value |
$ |
636,249 |
$ |
15,897,503 |
$ |
11,392,478 |
||||||||
Loans(3)
|
$ |
581 |
Price-based |
Discount to price(4)
|
34.00 |
% |
39.00 |
% |
35.00 |
% |
||||
109 |
Model-based |
Price(5)
|
$ |
52.40 |
$ |
68.00 |
$ |
65.32 |
||||||
Appraised Value |
$ |
6,500,000 |
$ |
86,000,000 |
$ |
43,532,719 |
||||||||
(1) |
The fair value amounts presented in this table represent the primary valuation technique or techniques for each class of assets or liabilities. |
(2) |
Weighted averages are based on the fair value of the instrument. |
(3) |
Represents loans held for investment whose carrying amounts are based on the fair value of the underlying collateral. |
(4) |
Includes estimated costs to sell. |
(5) |
Prices are based on appraised values. |
Three months ended September 30, |
||||||
In millions of dollars |
2014 |
2013 |
||||
Loans held-for-sale |
$ |
(11 |
) |
$ |
(44 |
) |
Other real estate owned |
(7 |
) |
(1 |
) |
||
Loans(1)
|
(158 |
) |
(186 |
) |
||
Total nonrecurring fair value gains (losses) |
$ |
(176 |
) |
$ |
(231 |
) |
(1)
|
Represents loans held for investment whose carrying amount is based on the fair value of the underlying collateral, including primarily real-estate loans. |
Nine months ended September 30, |
||||||
In millions of dollars |
2014 |
2013 |
||||
Loans held-for-sale |
$ |
58 |
$ |
(44 |
) |
|
Other real estate owned |
(15 |
) |
(6 |
) |
||
Loans(1)
|
(462 |
) |
(444 |
) |
||
Total nonrecurring fair value gains (losses) |
$ |
(419 |
) |
$ |
(494 |
) |
(1) |
Represents loans held for investment whose carrying amount is based on the fair value of the underlying collateral, including primarily real-estate loans. |
September 30, 2014 |
Estimated fair value |
||||||||||||||
|
Carrying
value
|
Estimated
fair value
|
||||||||||||||
In billions of dollars |
Level 1 |
Level 2 |
Level 3 |
||||||||||||
Assets |
|||||||||||||||
Investments |
$ |
30.9 |
$ |
32.2 |
$ |
5.0 |
$ |
24.8 |
$ |
2.4 |
|||||
Federal funds sold and securities borrowed or purchased under agreements to resell |
104.5 |
104.5 |
— |
94.8 |
9.7 |
||||||||||
Loans(1)(2)
|
629.7 |
627.2 |
— |
6.5 |
620.7 |
||||||||||
Other financial assets(2)(3)
|
247.1 |
247.1 |
9.0 |
170.0 |
68.1 |
||||||||||
Liabilities |
|||||||||||||||
Deposits |
$ |
940.9 |
$ |
938.5 |
$ |
— |
$ |
644.8 |
$ |
293.7 |
|||||
Federal funds purchased and securities loaned or sold under agreements to repurchase |
131.1 |
131.1 |
— |
131.0 |
0.1 |
||||||||||
Long-term debt(4)
|
197.4 |
204.4 |
— |
170.4 |
34.0 |
||||||||||
Other financial liabilities(5)
|
153.9 |
153.9 |
— |
43.2 |
110.7 |
||||||||||
December 31, 2013 |
Estimated fair value |
||||||||||||||
|
Carrying
value
|
Estimated
fair value
|
||||||||||||||
In billions of dollars |
Level 1 |
Level 2 |
Level 3 |
||||||||||||
Assets |
|||||||||||||||
Investments |
$ |
17.8 |
$ |
19.3 |
$ |
5.3 |
$ |
11.9 |
$ |
2.1 |
|||||
Federal funds sold and securities borrowed or purchased under agreements to resell |
115.6 |
115.6 |
— |
107.2 |
8.4 |
||||||||||
Loans(1)(2)
|
637.9 |
635.1 |
— |
5.6 |
629.5 |
||||||||||
Other financial assets(2)(3)
|
250.7 |
250.7 |
9.4 |
189.5 |
51.8 |
||||||||||
Liabilities |
|||||||||||||||
Deposits |
$ |
966.6 |
$ |
965.6 |
$ |
— |
$ |
776.4 |
$ |
189.2 |
|||||
Federal funds purchased and securities loaned or sold under agreements to repurchase |
152.0 |
152.0 |
— |
151.8 |
0.2 |
||||||||||
Long-term debt(4)
|
194.2 |
201.3 |
— |
175.6 |
25.7 |
||||||||||
Other financial liabilities(5)
|
136.2 |
136.2 |
— |
41.2 |
95.0 |
||||||||||
(1)
|
The carrying value of loans is net of the Allowance for loan losses of $16.9 billion for September 30, 2014 and $19.6 billion for December 31, 2013. In addition, the carrying values exclude $2.8 billion and $2.9 billion of lease finance receivables at September 30, 2014 and December 31, 2013, respectively.
|
(2) |
Includes items measured at fair value on a nonrecurring basis. |
(3) |
Includes cash and due from banks, deposits with banks, brokerage receivables, reinsurance recoverable and other financial instruments included in Other assets on the Consolidated Balance Sheet, for all of which the carrying value is a reasonable estimate of fair value.
|
(4) |
The carrying value includes long-term debt balances under qualifying fair value hedges. |
(5) |
Includes brokerage payables, separate and variable accounts, short-term borrowings (carried at cost) and other financial instruments included in Other liabilities on the Consolidated Balance Sheet, for all of which the carrying value is a reasonable estimate of fair value.
|
Changes in fair value gains (losses) for the |
||||||||||||
Three Months Ended September 30, |
Nine Months Ended September 30, |
|||||||||||
In millions of dollars |
2014 |
2013 |
2014 |
2013 |
||||||||
Assets |
||||||||||||
|
Federal funds sold and securities borrowed or purchased under agreements to resell
Selected portfolios of securities purchased under agreements to resell and securities borrowed
|
$ |
(137 |
) |
$ |
(37 |
) |
$ |
836 |
$ |
(505 |
) |
|
Trading account assets |
3 |
(102 |
) |
(235 |
) |
(272 |
) |
|||||
Investments |
(15 |
) |
24 |
37 |
(33 |
) |
||||||
Loans |
||||||||||||
Certain corporate loans(1)
|
(39 |
) |
37 |
(26 |
) |
324 |
||||||
Certain consumer loans(1)
|
2 |
(47 |
) |
(44 |
) |
(114 |
) |
|||||
Total loans |
$ |
(37 |
) |
$ |
(10 |
) |
(70 |
) |
210 |
|||
Other assets |
||||||||||||
MSRs |
$ |
(11 |
) |
$ |
(6 |
) |
$ |
(186 |
) |
$ |
410 |
|
Certain mortgage loans held for sale(2)
|
96 |
98 |
354 |
612 |
||||||||
Certain equity method investments |
(6 |
) |
(4 |
) |
(8 |
) |
(5 |
) |
||||
Total other assets |
$ |
79 |
$ |
88 |
$ |
160 |
$ |
1,017 |
||||
Total assets |
$ |
(107 |
) |
$ |
(37 |
) |
$ |
728 |
$ |
417 |
||
Liabilities |
||||||||||||
Interest-bearing deposits |
$ |
27 |
$ |
9 |
$ |
10 |
$ |
128 |
||||
|
Federal funds purchased and securities loaned or sold under agreements to repurchase
Selected portfolios of securities sold under agreements to repurchase and securities loaned
|
2 |
12 |
(4 |
) |
85 |
|||||||
Trading account liabilities |
(3 |
) |
(24 |
) |
1 |
14 |
||||||
Short-term borrowings |
(44 |
) |
(34 |
) |
(54 |
) |
54 |
|||||
Long-term debt |
794 |
(718 |
) |
66 |
(324 |
) |
||||||
Total liabilities |
$ |
776 |
$ |
(755 |
) |
$ |
19 |
$ |
(43 |
) |
||
(1) |
Includes mortgage loans held by mortgage loan securitization VIEs consolidated upon the adoption of ASC 810 Consolidation (SFAS 167) on January 1, 2010.
|
(2) |
Includes gains (losses) associated with interest rate lock-commitments for those loans that have been originated and elected under the fair value option. |
September 30, 2014 |
December 31, 2013 |
|||||||||||
In millions of dollars |
Trading assets |
Loans |
Trading assets |
Loans |
||||||||
Carrying amount reported on the Consolidated Balance Sheet |
$ |
11,071 |
$ |
4,409 |
$ |
9,262 |
$ |
4,105 |
||||
Aggregate unpaid principal balance in excess of (less than) fair value |
113 |
12 |
4 |
(79 |
) |
|||||||
Balance of non-accrual loans or loans more than 90 days past due |
8 |
4 |
97 |
5 |
||||||||
Aggregate unpaid principal balance in excess of fair value for non-accrual loans or loans more than 90 days past due |
(2 |
) |
3 |
41 |
5 |
|||||||
In millions of dollars |
September 30, 2014 |
December 31, 2013 |
||||
Carrying amount reported on the Consolidated Balance Sheet |
$ |
1,640 |
$ |
2,089 |
||
Aggregate fair value in excess of unpaid principal balance |
62 |
48 |
||||
Balance of non-accrual loans or loans more than 90 days past due |
— |
— |
||||
Aggregate unpaid principal balance in excess of fair value for non-accrual loans or loans more than 90 days past due |
— |
— |
||||
September 30, 2014 |
December 31, 2013 |
|||||||||||
In millions of dollars |
Corporate loans |
Consumer loans |
Corporate loans |
Consumer loans |
||||||||
Carrying amount reported on the Consolidated Balance Sheet |
$ |
2 |
$ |
— |
$ |
14 |
$ |
910 |
||||
Aggregate unpaid principal balance in excess of fair value |
10 |
— |
7 |
212 |
||||||||
Balance of non-accrual loans or loans more than 90 days past due |
— |
— |
— |
81 |
||||||||
Aggregate unpaid principal balance in excess of fair value for non-accrual loans or loans more than 90 days past due |
— |
— |
— |
106 |
||||||||
In billions of dollars |
September 30, 2014 |
December 31, 2013 |
||||
Interest rate linked |
$ |
10.7 |
$ |
9.8 |
||
Foreign exchange linked |
0.3 |
0.5 |
||||
Equity linked |
7.4 |
7.0 |
||||
Commodity linked |
2.0 |
1.8 |
||||
Credit linked |
2.7 |
3.5 |
||||
Total |
$ |
23.1 |
$ |
22.6 |
||
In millions of dollars |
September 30, 2014 |
December 31, 2013 |
||||
Carrying amount reported on the Consolidated Balance Sheet |
$ |
26,453 |
$ |
25,968 |
||
Aggregate unpaid principal balance in excess of (less than) fair value |
(357 |
) |
(866 |
) |
||
In millions of dollars |
September 30, 2014 |
December 31, 2013 |
||||
Carrying amount reported on the Consolidated Balance Sheet |
$ |
1,454 |
$ |
3,692 |
||
Aggregate unpaid principal balance in excess of (less than) fair value |
32 |
(38 |
) |
|||
Maximum potential amount of future payments |
||||||||||||
In billions of dollars at September 30, 2014 except carrying value in millions |
Expire within
1 year
|
Expire after
1 year
|
Total amount
outstanding
|
Carrying value
(in millions of dollars)
|
||||||||
Financial standby letters of credit |
$ |
24.6 |
$ |
73.2 |
$ |
97.8 |
$ |
257 |
||||
Performance guarantees |
7.2 |
4.7 |
11.9 |
33 |
||||||||
Derivative instruments considered to be guarantees |
15.4 |
77.2 |
92.6 |
1,404 |
||||||||
Loans sold with recourse |
— |
0.2 |
0.2 |
16 |
||||||||
Securities lending indemnifications(1)
|
105.7 |
— |
105.7 |
— |
||||||||
Credit card merchant processing(1)
|
86.5 |
— |
86.5 |
— |
||||||||
Custody indemnifications and other |
— |
41.0 |
41.0 |
54 |
||||||||
Total |
$ |
239.4 |
$ |
196.3 |
$ |
435.7 |
$ |
1,764 |
||||
Maximum potential amount of future payments |
||||||||||||
In billions of dollars at December 31, 2013 except carrying value in millions |
Expire within
1 year
|
Expire after
1 year
|
Total amount
outstanding
|
Carrying value
(in millions of dollars)
|
||||||||
Financial standby letters of credit |
$ |
28.8 |
$ |
71.4 |
$ |
100.2 |
$ |
429 |
||||
Performance guarantees |
7.6 |
4.9 |
12.5 |
42 |
||||||||
Derivative instruments considered to be guarantees |
6.0 |
61.6 |
67.6 |
797 |
||||||||
Loans sold with recourse |
— |
0.3 |
0.3 |
22 |
||||||||
Securities lending indemnifications(1)
|
79.2 |
— |
79.2 |
— |
||||||||
Credit card merchant processing(1)
|
85.9 |
— |
85.9 |
— |
||||||||
Custody indemnifications and other |
— |
36.3 |
36.3 |
53 |
||||||||
Total |
$ |
207.5 |
$ |
174.5 |
$ |
382.0 |
$ |
1,343 |
||||
(1) |
The carrying values of securities lending indemnifications and credit card merchant processing were not material for either period presented, as the probability of potential liabilities arising from these guarantees is minimal. |
Maximum potential amount of future payments |
||||||||||||
In billions of dollars at September 30, 2014 |
Investment
grade
|
Non-investment
grade
|
Not
rated
|
Total |
||||||||
Financial standby letters of credit |
$ |
72.4 |
$ |
15.4 |
$ |
10.0 |
$ |
97.8 |
||||
Performance guarantees |
6.9 |
4.1 |
0.9 |
11.9 |
||||||||
Derivative instruments deemed to be guarantees |
— |
— |
92.6 |
92.6 |
||||||||
Loans sold with recourse |
— |
— |
0.2 |
0.2 |
||||||||
Securities lending indemnifications |
— |
— |
105.7 |
105.7 |
||||||||
Credit card merchant processing |
— |
— |
86.5 |
86.5 |
||||||||
Custody indemnifications and other |
40.8 |
0.2 |
— |
41.0 |
||||||||
Total |
$ |
120.1 |
$ |
19.7 |
$ |
295.9 |
$ |
435.7 |
||||
Maximum potential amount of future payments |
||||||||||||
In billions of dollars at December 31, 2013 |
Investment
grade
|
Non-investment
grade
|
Not
rated
|
Total |
||||||||
Financial standby letters of credit |
$ |
76.2 |
$ |
14.8 |
$ |
9.2 |
$ |
100.2 |
||||
Performance guarantees |
7.4 |
3.6 |
1.5 |
12.5 |
||||||||
Derivative instruments deemed to be guarantees |
— |
— |
67.6 |
67.6 |
||||||||
Loans sold with recourse |
— |
— |
0.3 |
0.3 |
||||||||
Securities lending indemnifications |
— |
— |
79.2 |
79.2 |
||||||||
Credit card merchant processing |
— |
— |
85.9 |
85.9 |
||||||||
Custody indemnifications and other |
36.2 |
0.1 |
— |
36.3 |
||||||||
Total |
$ |
119.8 |
$ |
18.5 |
$ |
243.7 |
$ |
382.0 |
||||
In millions of dollars |
U.S. |
Outside of
U.S.
|
September 30, 2014 |
December 31,
2013
|
||||||||
Commercial and similar letters of credit |
$ |
1,537 |
$ |
5,587 |
$ |
7,124 |
$ |
7,341 |
||||
One- to four-family residential mortgages |
2,281 |
2,601 |
4,882 |
4,946 |
||||||||
Revolving open-end loans secured by one- to four-family residential properties |
13,616 |
2,999 |
16,615 |
16,781 |
||||||||
Commercial real estate, construction and land development |
7,308 |
1,132 |
8,440 |
8,001 |
||||||||
Credit card lines |
493,404 |
124,578 |
617,982 |
641,111 |
||||||||
Commercial and other consumer loan commitments |
161,325 |
97,426 |
258,751 |
225,795 |
||||||||
Other commitments and contingencies |
1,257 |
8,045 |
9,302 |
7,863 |
||||||||
Total |
$ |
680,728 |
$ |
242,368 |
$ |
923,096 |
$ |
911,838 |
||||
In millions, except per share amounts |
Total shares
purchased
|
Average
price paid
per share
|
Approximate dollar
value of shares that
may yet be purchased
under the plan or
programs
|
|||||
July 2014 |
||||||||
Open market repurchases(1)
|
1.8 |
$ |
47.71 |
$ |
777 |
|||
Employee transactions(2)
|
— |
— |
N/A |
|||||
August 2014 |
||||||||
Open market repurchases(1)
|
1.3 |
49.61 |
713 |
|||||
Employee transactions(2)
|
— |
— |
N/A |
|||||
September 2014 |
||||||||
Open market repurchases(1)
|
0.7 |
52.22 |
676 |
|||||
Employee transactions(2)
|
— |
— |
N/A |
|||||
Amounts as of September 30, 2014 |
3.8 |
$ |
49.19 |
$ |
676 |
|||
(1) |
Represents repurchases under the $1.2 billion 2014 common stock repurchase program (2014 Repurchase Program) that was approved by Citigroup’s Board of Directors and announced on April 23, 2014, which was part of the planned capital actions included by Citi in its 2014 Comprehensive Capital Analysis and Review. The 2014 Repurchase Program extends through the first quarter of 2015. Shares repurchased under the 2014 Repurchase Program are treasury stock. |
(2) |
Consisted of shares added to treasury stock related to (i) certain activity on employee stock option program exercises where the employee delivers existing shares to cover the option exercise, or (ii) under Citi’s employee restricted or deferred stock programs where shares are withheld to satisfy tax requirements. |
Exhibit Number |
Description of Exhibit |
3.01+ |
Restated Certificate of Incorporation of Citigroup Inc., as amended, as in effect on the date hereof. |
3.02 |
By-Laws of Citigroup Inc., as amended, as in effect on the date hereof, incorporated by reference to Exhibit 3.02 to Citigroup Inc.’s Current Report on Form 8-K filed January 10, 2013 (File No. 1-9924). |
10.01 +
|
Form of Citigroup 2015 CAP/DCAP Agreement. |
10.02 +
|
Form of Citigroup 2015 EU Immediate Award Agreement. |
12.01+ |
Calculation of Ratio of Income to Fixed Charges. |
12.02+ |
Calculation of Ratio of Income to Fixed Charges Including Preferred Stock Dividends. |
31.01+ |
Certification of principal executive officer pursuant to Section 302 of the Sarbanes-Oxley Act of 2002. |
31.02+ |
Certification of principal financial officer pursuant to Section 302 of the Sarbanes-Oxley Act of 2002. |
32.01+ |
Certification pursuant to 18 U.S.C. Section 1350, as adopted pursuant to Section 906 of the Sarbanes-Oxley Act of 2002. |
99.01+* |
Resolution Agreement dated as of June 28, 2013 among Fannie Mae, CitiMortgage, Inc. and Citibank, N.A. |
99.02+ |
Settlement Agreement dated as of September 25, 2013 between (i) Federal Home Loan Mortgage Corporation, and (ii) CitiMortgage, Inc. and Citibank, N.A., as successor in interest by merger to Citicorp Trust Bank. |
101.01+ |
Financial statements from the Quarterly Report on Form 10-Q of Citigroup Inc. for the quarterly period ended September 30, 2014, filed on October 30, 2014, formatted in XBRL: (i) the Consolidated Statement of Income, (ii) the Consolidated Balance Sheet, (iii) the Consolidated Statement of Changes in Equity, (iv) the Consolidated Statement of Cash Flows and (v) the Notes to Consolidated Financial Statements. |
|
Denotes a management contract or compensatory plan or arrangement.
|
* |
Confidential information contained in this agreement has been omitted and filed separately with the SEC. Confidential treatment has been requested for this information. |
